#dataisbeautiful
Text
In light of both the announcement of The Magnus Protocol and the introduction of polls to tumblr, I thought it would be a good time to reintroduce the fandom to Ye Olde TMA Fan Survey!

If you weren’t one of the 3,500+ people able to take the survey back in the day and it sounds like something you’re interested in, I’ve got good news for you:
THE TMA FAN SURVEY IS STILL UP AND RUNNING!
Take the survey here (it contains spoilers through the finale!!!)
Read after the break for more context and for the results of the initial run!
Exactly two years ago, a group of us launched the TMA Fan Survey as part of the fan project Eye Love TMA to celebrate the podcast that means so much to so many. In the two months between survey launch and the March 2021 finale, we got over 3,500 fans (and a few cast/crew members!) to take the survey. I had a blast getting to examine such a large set of data and analyse how the fandom related to the podcast through items such as:
Favourite character
Favourite season
Scariest episode
Charisma levels of the fandom as compared to the Archivist
What the Admiral looks like
How the Admiral wears trousers
Which entity fans are most afraid of
Which dancing Theresa May haunts the Archivist in the gap between his nightmares
And so, so much more!
Now, since the fandom has only continued to grow since the finale, and that means there are even more people who are able to contribute to this project, I decided to readvertise the survey.
Through the launch of TMagP, I’m going to be running a drive to collect Even More Data for the survey and release an updated newsletter come October.
Look at the finale-era results here.
Tumblr post of highlights from newsletter launch by the incredible niksfake
Adorable comic by shanni used to advertise the survey
Just to note that, going forward, I’m only going to be looking at the multiple choice questions on the survey. I already read through 3,500 responses to each of the 6 short answer questions and I am not going to read through any more, thank you very much.
Also, the survey was written in between the release of MAG 190 and MAG 191 and updated relevant episode-centric questions with each new release, so please feel free to laugh at some of the more outdated questions.
#the magnus archives#tma#tma spoilers#tmagp#dataisbeautiful#data#tma fan survey#eye love tma#jmart#the eye needs your opinions and thoughts#do your part and help feed the ceaseless watcher's creative consciousness by taking the survey#those of you that took the survey in the two years since we last advertised it#firstly thank you for that#and secondly how the hell did you find it
184 notes
·
View notes
Text
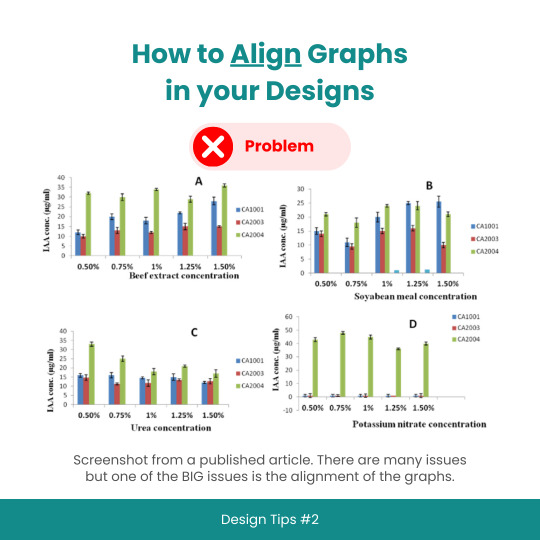


Design Tips #2: How to Align Graphs in your Designs
#designtips#datavisualization#graph#data#statistics#analytics#dataisbeautiful#chart#dashboard#datagram#dataart#infographic#informationisbeautiful#datatellingstories#datadesign#ddj#datasketch#dataviz
3 notes
·
View notes
Text
A little music database history.. 👾🕰

Published by Penguin in 1995 💽 Pretty steep fee (over $1000 adjustd for inflation), but it def wasn’t intended for personal use.. (see description below)
Image of CD case is from an Amazon posting of a new copy on sale today for $1,241. Unfortunately no screenshots online..
Excerpts from 1997 software review by Victor Cordell in Sound Series, Vol. 53, published on JSTOR.

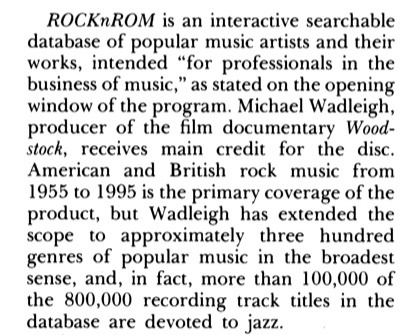
That’s right.. Michael Wadleigh! The same dude who took on the colossal task of video documenting 1969 Woodstock, and provided a lot of the footage used in the 1974 documentary on Janis Joplin. No mention of RocknRom on his Wikipedia bio. Just his filmography.
#music database#90s tech#music industry#database#data science#dataporn#dataisbeautiful#Michael Wadleigh
34 notes
·
View notes
Photo
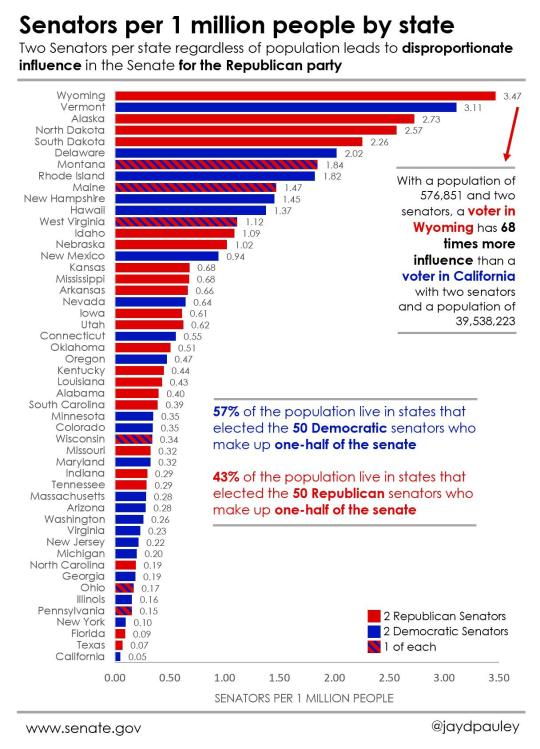
[OC] The structural advantage held by the Republican Party in the US Senate via dataisbeautiful
10 notes
·
View notes
Photo
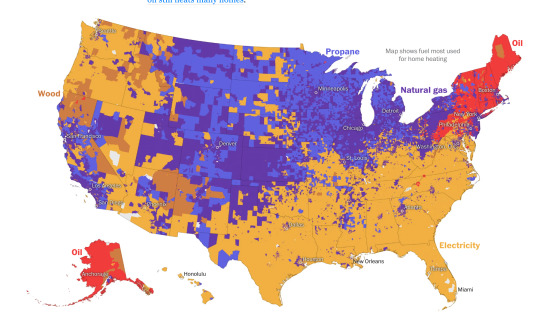
The Washington Post shows the main heat sources of US homes. 47% natural gas, 40% electricity, 5% propane, 4% oil, 2% wood and 2% other.
0 notes
Video
This is the world population including the population of china, population of usa, and population of india over time!
Be sure to join my discord for giveaways in the near future! https://discord.gg/nHZtuMD
1 note
·
View note
Text
hi I can recover your deleted or formatted Data from any devices if u want your deleted or formatted Data recover so contact on WhatsApp +923177960413
1 note
·
View note
Text

When I was novice I made a lot of mistakes then I came to know about this Community and I benefited from it.
#earn btc#bts yoongi#bts jin#jjba#bts suga#cryptocurrencies#cryptid#crypto#dataanalytics#data entry jobs#date and time#dataisbeautiful#sitting#shay#datsun#companion#victorias#linn#vent#vinyl#music video#vegan#bts#jimin#taehyung#jungkook#suga#vintage#tw ed vent#us
1 note
·
View note
Text
mentalists are the lamest kind of magicians because their whole power is statistic
#“your baboon brain was thinking of the colour red”#“you absolute fool I tricked you into thinking of the number seven”#my guy your whole act revolves around one r/dataisbeautiful post calm down
1 note
·
View note
Text

all the top comments on this r/dataisbeautiful post are unused compounds lmao you scumwits
746 notes
·
View notes
Text
r/dataisbeautiful is heaven for my autistic brain
10 notes
·
View notes
Photo
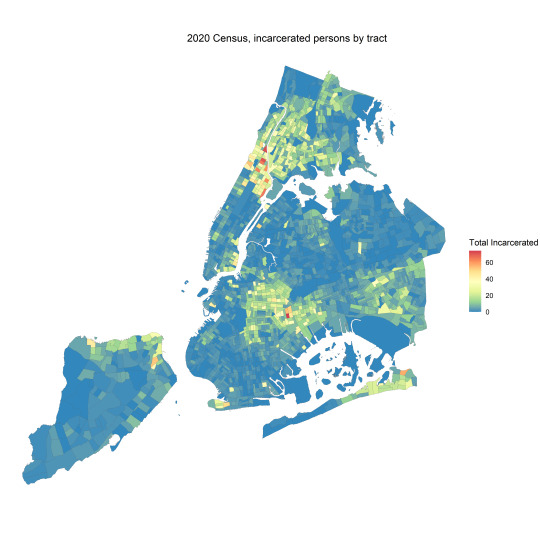
New York City map identifying what tract, in NYC, incarcerated New Yorkers come from
by u/LukaCola
TOOL USED: Visualization made using R Studio
Packages include: sf, ggplot2, leaflet, dplyr, tidyverse, haven, RColorBrewer, tmap, tmaptools
SOURCE: Data comes from New York 2020 census data https://data.census.gov/cedsci/ and https://latfor.state.ny.us/data/ - I unfortunately cannot share the tract level shapefile, but there are many available for New York City. This is possible due to recent legislative changes that require New York City to count incarcerated persons based on their home prior to incarceration, effectively eliminating some forms of prison gerrymandering in the state.
The calculation is relatively simple but I first transformed the block level data to tract level data as I find tract level visuals much more readable.
Then I subtracted the NYC 2020 census values from the adjusted population values and filtered out negative values, as prisons such as Rikers island result in a high negative population.
There is an issue where people are fairly heavily undercounted, with only about 16,000 incarcerated persons accounted for while there are about 40,000 that come from NYC. I have tried to work out this discrepancy but have had trouble figuring it out. It may be that the legislative task force's data simply under-adjusts due to known issues where they could not effectively locate a prisoner's original address, but I haven't been able to get in touch with them to figure this out. As helpful and valuable as their data is, they had to work with DOCCS data which is not always usable for this purpose.
The purpose of this is to identify what neighborhoods are most affected by incarceration, the data isn't especially surprising but it is interesting to see it mapped out. It was also an exercise in learning how to do GIS work and part of an ongoing project - so please forgive some of the sloppiness and lack of neighborhood labels.
E: Also figure I'd head this one up - this data can be contentious, but I am doing this out of interest for the communities affected. Incarceration is one of a few ways people can lose voting rights and the high rate of incarceration in these communities effectively hurts their voting power. For the purpose of drawing voting districts, this impact should be considered, especially as Black and Hispanic voters are especially impacted.
E2: Also here's the same on the block level, if you want to get really granular (I find this one much harder to visualize general trends though)
https://imgur.com/CH7MToI
E3: See here for discussion on rate vs total
https://www.reddit.com/r/dataisbeautiful/comments/yq0ik8/oc_new_york_city_map_identifying_what_tract_in/ivpdidp/
69 notes
·
View notes
Photo
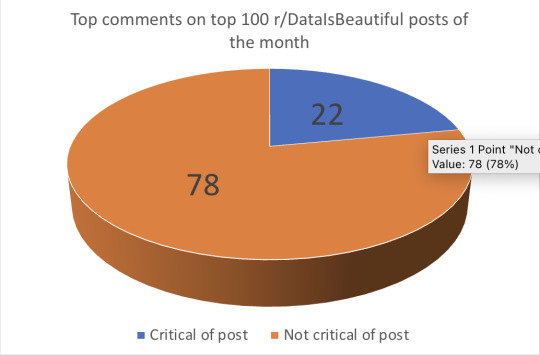
Fraction of the top 100 posts of the last month of r/DataIsBeautiful where the top comment is critical of the post
by u/rcxwhiz
18 notes
·
View notes
Photo

https://old.reddit.com/r/dataisbeautiful/comments/z9onek/a_shaded_relief_map_of_south_america_rendered/
39 notes
·
View notes
Note
https://www.reddit.com/r/dataisbeautiful/comments/65vxvk/pokemon_types_distribution_by_region_oc/?rdt=40304
maybe this could help?
Now I gotta make a chart to see how it compares
2 notes
·
View notes
Text
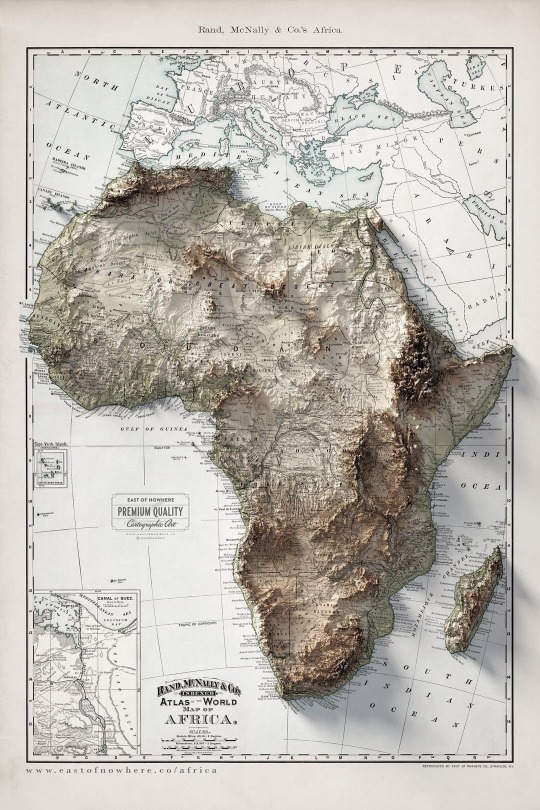
The topography of Africa
Source (https://reddit.com/r/dataisbeautiful/comments/14ivq1l/oc_the_topography_of_africa)
View On WordPress
5 notes
·
View notes
Last Seen Blogs

sweetbabymantykes
The benefits of being a marine biologist

gemini-elf-girl
sorry tsukki!

stephenabela
Stephen Abela

basilicums
Basilicum

livemobile88
livemobile88