#dataobject
Explore tagged Tumblr posts
Visit Tumblr Blog
Explore Tumblr blogs with no restrictions, modern design and the best experience.
Last Seen Tumblr Blogs


Fun Fact
The Tumblr office adopted Tommy, an 11-year-old Pomeranian.
Text
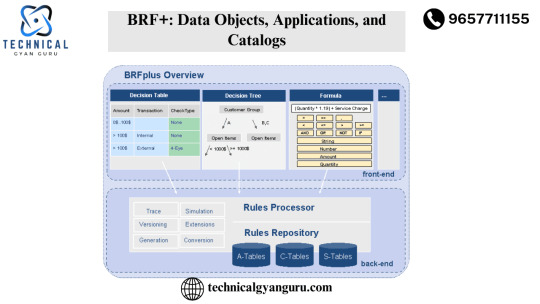
BRF+: Data Objects, Applications, and Catalogs
we began our BRF+ series. You will learn about BRF+ inventory, application, and data object generation ideas through this blog. Make sure you click the aforementioned link before continuing to read this article. Even if you thought the prior article was too technical, you should still read this one to gain a better understanding of BRP+ and apply it to the design of your actual project application. read more
#BRFPlus#DataObjects#Applications#Catalogs#BusinessRulesFramework#SAPBRFPlus#SAPApplications#DataManagement#ProcessAutomation#EnterpriseSolutions
0 notes
Text
Yah using excel to bulk program dataobjects
1 note
·
View note
Photo

After discussing ideas on data set objects in relation to honey and bees, we decided to use Josiah’s idea of a honey dipper to display our data set and information. So far, we have a few data points we would use on each of the rings: e.g. NZ honey exportation, NZ bee population through out the past few years. Each ring of the honey dipper would have a different set of data and each honey dipper would represent one year, so there’d be a few prototypes.
We also have an idea of making each of the rings in a hexagonal shape. At the moment, we are still unsure of how exactly we are going to create it, although most honey dippers are made from turned wood.
We will start the prototyping process, hopefully next week. We are planning on asking Krishna in the workshop for advice, otherwise we will have to find an outside source which will cost more money.
2 notes
·
View notes
Text
More prototypes for Data Objects
27/03/19 Using regular paper did not work very well as a prototype because it got soggy really quickly so I went into town and grabbed some paper straws and some plastic straws. I used a pocket knife to create holes in the straws and then tried using them. The more holes the less effective they were as straws, which is what I intended. I made large holes in the paper one, and tiny little holes in the plastic one.


Another prototype I did was with the bowls. The more hours that lifeguards had spent patrolling equalled the percentage of bowl left, ei, the more hours spent that year the less holes. Less hours spent, the more holes in the bowls. The idea is that when water is added to the bowls, the less water will be spilt if there are less holes. However I realised that bowls might not be the right household item to use, as you don't usually use bowls to hold water, so maybe a cup could be better? The idea worked however as I tested them with water and you could see clearly which one was stopping the water from getting through better. I need to elaborate better on the idea behind it, as I was trying to show that the more house patrolled, the better protected you are in the water, so I’m going to continue to play around with that idea and try and develop it.

1 note
·
View note
Text
미처 몰랐던 DataOject의 족보
미처 몰랐던 DataOject의 족보
수 년간 VBA 프로그래밍을 하면서 , 클립보드 핸들링은 늘 DataObject 를 이용해왔다. 오래 간만에 이 넘을 써먹을려니, 변수선언부터 이상했다. ‘Dim d As’까지 치면 사용가능한 데이터 타입이 나오는 데, 아무리 봐도 DataObject가 보이질 않는다. 혹시 비운의 Application.FileSearch처럼 2007 또는 2010 버전에서 사라졌나? 이거 없다면 API함수까지 동원해야 하나? 구글링을 통해 알아보니 다행히 사라지진 않았다. 다만 이것은 Userform 개체의 하위개체이므로 프로젝트에 Userform을 추가하여, ‘Microsoft Forms 2.0 Object Library’가 참조되도록 해주어야 한다. Collection개체처럼 기본메뉴인줄 알았다. 그나저나 뭐…

View On WordPress
0 notes
Text
Under Pressure - Reflection

Group 1: A-, A, B+ This groups project, in my opinion, was very good, it was creative and perfectly me the brief although I feel as if they could have blogged more as I feel like there was a lot of information missing. Group 2: A, A+, B This was another great project, in fact, I personally believe this project was easily the best out of everyone's, you can tell a lot of thought was put into being as creative as possible while also meeting the brief. But like the last project, I could see that this student could have blogged more, I didn’t see nearly as much information on the blog as much as they presented, they obviously had thought everything through, just didn’t blog very much. Group 3: A, A-, B I really enjoyed this data object, it was creative and efficiently showed their data and you could easily tell what they were showing just be viewing their data object. This was one of the best that was presented and I found it creative. They 100% met the brief, but again the blog didn’t have as much as I expected, although there was still a pretty good amount of information! Self Evaluation: Learning outcome 1: B Although our end product was nowhere near the end product we had hoped for, we demonstrated engagement with the creative process very efficiently as we prototyped every single day with different kinds of data objects/different ways to do them. Our final project definitely not the best but we learned a lot throughout the entire process and gained knowledge of many things and learnt what we are bad at so that in the future we can strive as individuals and work towards a better final outcome. It is very possible that we could have used more creative methods to ensure that our soap data object could have worked and this is why I have chosen a B. Although we prototyped a lot, we may have been doing the same ideas repetitively rather than doing a greater amount of research so we could use creative methods to solve the problem, instead we gave up and went for an easier data object which thinking back would have been us not being as creative as we SHOULD’VE been. Learning outcome 2: A Even though we resorted to using stress balls, a somewhat easier option for us to present, we put a lot of thought and effort into this. We efficiently explained our changes and why these occurred so we could show our data object in the best possible way. We had many problems and roadblocks throughout this project that it had changed and somewhat evolved so much we had difficulty explaining and showing every single change. All of our prototypes we had thought of we definitely took the brief into consideration, many times over someone would suggest an idea which someone else would reply “that doesn’t fit the brief, what can we change about this idea so it fits the brief?” If you take all of our prototypes into consideration, you will see as a group we applied critical thinking skills so we could fit the brief. Learning outcome 3: B+ A common thing I have seen by looking at other BCT students blogs is that not many people have actually posted that many blogs which is very surprising to me, I kept panicking that I hadn’t poster enough even though I have posted every single class and every single time my group has met up - I am just worried maybe I haven’t posted in as much detail as I should’ve to efficiently communicate my groups project intentions and outcomes. If I was to go back, I would make notes on my phone throughout the day so when I blog later in the day I would be able to add on to all of these notes, I feel if I did this for this project then I wouldn’t have struggled as much as I did to write things down which would help show decisions in our project. This is something I will do in future projects and I am sure it will help. Final thoughts: In general, after presenting our project and seeing other groups present theirs, I was embarrassed to present our data object. I’m disappointed in my self and my group that we weren’t able to have a better data object by the end of this, I do believe that if we didn’t have a 2 week holiday in between then I’m sure we would have a much better project. This holiday caused everything to be awkward and complicated with different group members going away at different times. Once we finished presenting all these amazing ideas started popping up in my head but sadly it was already too late, we had already finished and these ideas were pointless. Next project will be an interesting one for me as I have learned a lot from this project, and I would like to think I have learnt many ways that I can improve myself and improve whatever project I am working on.
Seeing how groups have completed this assignment has surprised me, many peoples projects were amazing but they didn’t blog as much as I would’ve expected to have seen from an amazing project. Let’s hope all my blogging helps.
0 notes
Photo

Holidays Work
Before the holidays we finished most of the strings we needed to do and also a few heads but we still had a bit of work to do over the holiday break.
Over the holidays the group came in on 3 days to do some work and to finish the project. I was unavailable to come in on two of the days as I was away but on those two days the group finished the measurements for the bigger heads for the Pois, they also finished the last few Pois we had to do which happened to be the very very large ones that took a lot of time to make as well as a lot of stuffing to fill the heads. On the third day, Tre and I came in and did some final touch-ups to make sure everything is done and up to a good standard. We have established that everything seems to be finished, except for one final poi which we could not complete as one of the other team members had taken it home to finish off. We will come in early on Monday to again make sure if everything is finished and to have one more final meeting to talk about if there are any last minute improvements we could make
0 notes
Photo


Photos of prototyping process
3 notes
·
View notes
Text
Data Objects Day 9
Today we began finalizing our data and started to think how we can change the aspects of the sweet to map our data to, as well as researching ways to actually make the food.
Most of my time today was compiling our data set on a spreadsheet, as well as trying to confirm as many of the numbers as possible.

A large majority of the data was taken from Chris’ original data set, but I also attempted to discover the dates that these events took place. From that I interpolated the data to show how long said war / epidemic lasted and a rough general estimate of how many fatalities there were/ would have been in a year. Not entirely sure if we’ll end up using that last one however, as it is pretty vague and is really just guesstimating.
Speaking of of guesstimating, we also decided that we should try to find out what disease has killed the most people. But that ended quickly as the numbers for both Cardiovascular Disease and Malaria were both very, very vague and the dates were equally as unclear. So that idea is pretty much scrapped for the time being. We tried to look at google scholar, however their data did not encompass the entire timeline we were looking for as we were trying to find out how many people were killed since the disease’s discovery.

Chris, Bel and Zhe did some brainstorming on what kind of sweets we should make and how we could map our data to them.

Bel’s ideas

Zhe’s ideas

Chris’ ideas
For the most part I didn’t take part in the brainstorming, but I did suggest that we could 3D print candy molds using Chris’ 3D printer. The problem with that is that we don’t know if the sweets would still be safe to eat after that. The plastic used is PLA which is supposed to be food safe, but we can’t be sure so we’re most likely gonna leave that idea behind. It’s a shame because if we 3D print candy molds we can make them any shape we want.
For tomorrow we’re planning on trying to actually create prototypes, so bought some chocolate buttons to try and see if we could use chocolate. For this prototype I’m replacing the poprocks with crushed pretzels as they are cheaper and should have similar enough properties, apart from popping of course.
4 notes
·
View notes
Text
final stretch
As our final day approaches we spent our last session, reflecting, helping any member who has missing information or needs help, and also our final discussion for improvements. Charles came over and we briefly explained to him our findings, also what we had ready to present for tomorrow. Charles pointed out some outlining issues that we had not considered. For example from a simple examine Charles asked us questions varying from our randomisation point to the size of the opening in the lid. He noticed that our middle pole was not exactly in the centre. Matt and I pulled the bin apart and got the pole more central and stronger. While small adjustments like these add to the accuracy we all know our data object is not the most ideal. However, this was a decision our group agreed to during our last meet up during the break. Due to high projected costs, and lack of supplies we decided to rework our final prototype rather than start with a new model that would perform very similar to the model that stands today. Questions and comments like these from Charles influenced us to plan and develop a projected final design further. Lachlan created a new CAD model with proposed materials and the type of construction we would include for our final object if we had the money and resources.

Images generated by Lachlan Smith
Overall, my group are sad that the process is nearing the end however, pleased with what we created. I have taken plenty away from experiences within the assignment. I look forward to reflecting further.
2 notes
·
View notes
Text
Data Objects 3 (TW)
Wednesday 27th March
My idea for this data object was to create a bracelet that represented the statistics of the working conditions of workers in the Bangalore garment industry. I had the idea to make the bracelet multicoloured a section representing the percentage of women who had experienced physical and sexual assault in the workplace and that i would make multiple to represent different percentages of data. (however my prototype is missing the different colours mainly because I had no other material sources, but if i were to make the product I would use dye and a thinner material.) I was inspired to make a bracelet as they are often used to express a stance or orientation towards something, people often wear bracelets in support of a foundation, band or for an event being held. Additionally, bracelets are common in many countries to be sold at markets and on the street. Coming from Thailand, bracelets are easy to make and also have a cultural significance to the Akha people, so is true in many other countries.
I had also been inspired by the following video, where SEQUENCE employs young men susceptible to the gang culture and violence that exists in El Salvador, to create bracelets that spread awareness and provide community for those men.
youtube
The data set I was focusing on:
Working conditions in the Bangalore garment industry [1]
Several recent reports have documented working conditions in the Bangalore garment industry. All workers except tailors are classified as unskilled, and typically work for low wages just at or below the statutory minimum wage. These wages have risen only marginally over a period of several years, failing to keep pace with the high rates of inflation in the IT metropolis of Bangalore. A joint report by the Dutch Clean Clothes Campaign, the India Committee of the Netherlands and Cividep India found that one-third of workers interviewed in garment factories earned less than the legal mini- mum wage for unskilled workers, even if they held semi-skilled or skilled positions. [2] Labourers work overtime hours to support their families, sometimes without the legally required compensation, and occasionally under threat of termination. Harassment by supervisors and floor managers is common, not least because of the low scope for women to rise to positions of authority on the shop- floor. A recent report by the UK organisation Sisters for Change found that over 60% of the female garment workers interviewed had been intimidated or threatened with violence. One in fourteen women had experienced physical violence, while a startling one in seven had been forced to commit a sexual act or forced to have sexual intercourse at work. In most of the cases of harassment and violence against women, supervisors and floor-in-charge managers are the perpetrators. [3]

Figure 1. bracelet prototype
References:
[1] Miedema, C. (2018, May 17). Labour Without Liberty - Female Migrant Workers in Bangalore's Garment Industry (full report). Retrieved from https://cleanclothes.org/resources/publications/labour-without-liberty-2013-female-migrant-workers-in-bangalores-garment-industry-full-version-1/view
[2] Doing Dutch – A research into the state of pay for workers in garment factories in India working for Dutch fashion brands (India Committee of the Netherlands, Sep 2016); source: http://www.indi- anet.nl/pdf/DoingDutch.pdf
[3] Eliminating violence against women at work (Sisters for Change & Munnade, Jun 2016); source: http://sistersforchange.org.uk/wp-content/uploads/2016/06/SFC_WomenatWork_FullReport_ 25June2016.pdf
3 notes
·
View notes
Text
Data Object - A Crossroads
I walked into class today anxious, still unhappy with my prototype and its lack of that “spark” that I was after, I took my seat and was already racking my brain for new ideas. In comes a new activity. Finding people outside of our usual groups, and presenting our ideas and issues to eachother while each working to help resolve said issues. It turns out that this was exactly what I needed. I tend to work much better in a group environment than solo, and taking input and drawing comparisons between my concept and other peoples was extremely helpful. I was paired with Chris who’s concept was based around epidemics, and representing them through lollipops, and I had an idea that he could use sour as a variable for the severity of each epidemic. This was the first thing that happened that led to the creation of my new concept. After sitting back down, my frustration with my concept after seeing other peoples had only grown. There were so many good ideas I had seen, and all of them had some kind of impact when you saw them. They showed the significant effects of the data as well as the data itself, which mine didn’t. Having seen so many new ideas though, everybody was in a mood for discussion. It was at this point that I smelt a very welcome and familiar smell. It was curry. This was the second thing that led to my new concept.
I mentioned the smell, to which a small bit of curry based banter started. Being in the frame of mind we were currently in, some ideas of using curry as a data object were thrown around as a bit of fun. Maybe this is actually a viable concept though? (this is where my idea for chris’s concept came into play) Spice, one of the main variables in curry, is entirely changeable. But wouldnt it be strange to use curry as an object? its a very one time use thing. What is spicy but re-useable?.... Hot sauce.
Finally ideas were starting to flow. The only issue I was having was that there is such a large disconnect between hot sauce and volcanoes. There is no logical step between them, except maybe lava or heat but its not immediately obvious what it would be. I took this as a perfect opportunity to find a new data set. What else is hot? What data can I use that has less of a disconnect? The answer I came to was the rising average global temperature. This was perfect, how better can I represent heat than with heat itself? Not only this, but it has a more dramatic and personally fulfilling impact than volcanoes. I managed to walk out of class today feeling much more on-track, and confident in my decision. I plan to prototype this using chilli extract or powder with ketchup by the end of the day, so updates on that tomorrow.
3 notes
·
View notes
Text
Data Objects Mock up 3
I have decided to stick with NZ bee hive numbers since it is a decent data set.

This attempt I used each layer of petals to represent a different year of bee hive numbers. I made a flower since my last attempt was a bit unsightly than what I had intended to make. Plus I discarded the stalk and leaves since they seemed unnecessary.
Bee Hive Numbers
2012 - 422,728 hives = 4.2cm leaves x 5
2014 - 507,247 hives = 5cm leaves x 6
2016 - 684,046 hives = 6.8cm leaves x 7
2018 - 879,758 hives = 8.8cm leaves x 8
The number of leaves are only for the flower to look complete since I have not found another set of data for those numbers to mean anything. The purple outline around the stamen is for the ultra-violet glow that bees are attracted to. The stamen is slightly raised to make it more authentic since flowers are not flat. The flower was modeled after a picture of the South African Ursinia speciosa which is part of the daisy family with the layers to show the data of specific years. This was the picture with an article about bees being colour blind to the colour red and the ultra-violet glow around stamens that bees are attracted to.
2 notes
·
View notes
Text

Prototyping...
So I came to realise that my initial idea of using an on-screen mouse to portray my dataset idea was not too innovative or as interesting as I’d thought. I researched similar ideas that could work out, but I eventually came up with this idea. An on-screen loading hour glass symbol that could represent time in my data set idea. The issue would be how I could prototype this idea. It’s a 2D object and I’m unsure on how I could replicate this symbol into a 3D form, for the prototype of course. I’m thinking that I could maybe still use this idea but use a 3D printer or just some cardboard to create it. Maybe in the 2D form but it would appear slightly thicker withholding the data (colour coordinated little cubes). My second idea is that I could do a digitalised version and use a motion censor to shuffle the data when somebody moves past the object and the data could still be visible.
Another idea was a more complex idea. Although I don’t think it’d be impractical but I’m just not sure how I would even be able to create it but it looks pretty sick in my head...I want to TRY and portray the data cubes as tiny squres tinted (almost like little windows) in colour coordination and when you look through the square it gives information, data or quotes on actual findings of teenagers and how much time they spend using the Internet. E.g. Purple could represent the group of teenagers who say they use 2-4 hours of internet per day (38%) and you’d look through the little purple tinted square and it would give data on one or more data respondents and would say something(s) like “I tend to spend more time using the internet for research and studying and homework” or “I use the Internet mainly for streaming movies and games, sometimes for research but mainly entertainment purposes”. It could be formal or informal. This idea was inspired by a popular necklace I’d seen online- called the “i love you” necklace which is a rather interesting item. It says “I love you” in 100 different languages and you have to look through a tiny gem in the necklace to see all of the wording. That’s the same idea I want to go for with this project. I don’t know how to physically produce it but it’d be interesting.
* Fun fact: 1 in 6 NZ teenagers spend more than 6 hours on the Internet in a day. Sourced by recent statistics.
1 note
·
View note
Photo

11/04/19
Today was a little more disjointed as there was a photoshop tutorial taught by Charles at the front of class, and some group members joined it, including me. I left it early as I have done a bit of photoshop before, but afterwards felt it was hard to concentrate because I kept looking over to see what they were doing. The rest of the team were trying to find the best data set that we could for this project. The name of the project is now called “Wear It Down” as that is what is happening with the soaps, as you use it to wash your hands it gets worn down. Laura wrote a good paragraph explaining the metaphor for mental health, which Ashton and I edited slightly. This is it:
“The more you use soap, the more worn down it gets. The problem gets smaller and more overlooked the more it gets worn down. The soap represents an individual who has a mental health issue and the user of the soap is a metaphor for how people tend to treat people with mental health issues- they’re usually ignorant and focus on themselves. The food coloring which is eventually released, when the soap gets too worn down, is meant to represent someone with bad mental health when their problems are too big to be overlooked anymore and are exposed to people who had been oblivious to their problems previously. The juxtaposition of the light coloured soap to the colourful dye on the inside has an impact on the user of the soap, and shows how the more you use the soap the more your issues come to light. Using soap is a subconscious task with preconceived notions, we want to subvert that and bring attention to our underlying issues.”
We found some really good data, however it was so vague:
1 in 5 (or 43.8 million) adults experience mental illness in a given year.
1 in 25 (or 10 million) adults experience a serious mental illness.
2.6% (or 6.1 million) of Americans have bipolar disorder.
18.1% (or 42 million) live with an anxiety disorder.
90% of those who die by suicide have an underlying mental illness.
We wanted to have more accurate numbers, and a reputable source of these numbers. We wanted 4 to compare, and we got some good data but only 3 to compare, which were:
Major Depression (US, 2017): https://www.nimh.nih.gov/health/statistics/major-depression.shtml
Overall Mental Illness (US, 2017): https://www.nimh.nih.gov/health/statistics/mental-illness.shtml
Bipolar (US, 2017): https://www.ncbi.nlm.nih.gov/pubmed/27618746 2.6% (or 6.1 million) of Americans have bipolar disorder http://fortune.com/2017/10/10/world-mental-health-day-2017-workplace-depression-anxiety/
We really wanted anxiety as well, because it is such a common mental illness that is often overlooked, however the only statistic we could find was from 2001-2003, and the rest of the statistics we had were from 2017.
Anxiety (US, 2001-2003): https://www.nimh.nih.gov/health/statistics/any-anxiety-disorder.shtml
Finally, after searching for a long time, we found a PDF with some really good data.

This dataset shows United States data in comparison to NZ, surrounding the percentage of depressive disorders (depression), to anxiety disorders. This dataset is from a reputable source, also has the total number of cases and more. This is the dataset we are going to run with.
After this was done we wanted to create another prototype of the soaps. Yesterday after class Ciara tried out one of the soaps again, a couple hours after creating it. Unfortunately the ink inside had dried, and so was not putting ink on her hands. To fix this today her and Patricia bought some gel dye instead, so that it wouldn’t dry down. They tested this out. Another issue came up with the soaps that we had bought. The ones that were not “Dove” did not melt down properly because they did not have cream in them like the Dove one did that we had used previously, and we could not use them. We need to buy some more Dove soaps to try.

Overall todays studio session was successful, and we are making good progress. Tomorrow we are going to come in and create some more prototypes as well as getting started on the written work so that we can have a draft done by Monday, as requested by Ben.
3 notes
·
View notes
Text
UNDER PRESSURE DEVELOPMENT PROCESS JOURNAL
This project was a collaboration between:
Ashton Smith
Isabella Royal
Laura Gilberd
Ciara Robinson Huggins
Patricia Chan
Astarlii Taokia
Here is my list of all the process blogs for our Under Pressure project: https://ashtoncreative.tumblr.com/post/184524792268/finishing-our-data-object/embed https://ashtoncreative.tumblr.com/post/184524379508/stressballs-why/embed https://ashtoncreative.tumblr.com/post/184514193733/hitting-a-roadblock/embed https://ashtoncreative.tumblr.com/post/184236161968/continuing-on-with-prototyping-slightly-changing/embed https://ashtoncreative.tumblr.com/post/184127461938/bath-bombs-prototype/embed https://ashtoncreative.tumblr.com/post/184101741753/why-are-we-using-soap-settling-on-our-data/embed https://ashtoncreative.tumblr.com/post/184075836013/prototyping-keyboard-and-soap/embed https://ashtoncreative.tumblr.com/post/184053788103/lost-with-ideas-prototyping-feeling-hopeless/embed https://ashtoncreative.tumblr.com/post/184030948318/killing-our-baby-stfu-ive-been-wondering/embed https://ashtoncreative.tumblr.com/post/183952897918/designing-mockupswe-met-up-on-a-friday-at-11pm-to/embed https://ashtoncreative.tumblr.com/post/183927934643/planning-resources-painting-in-order-to-create/embed https://ashtoncreative.tumblr.com/post/183906601538/grouping-up-going-with-suicide-yesterday-we-all/embed Isabellas posts (Astarlii videos): https://ultraisabellaroyal.tumblr.com/post/184514887129/the-pink-bath-bomb-prototype-in-action-this-one https://ultraisabellaroyal.tumblr.com/post/184514940953/this-was-another-pink-bath-bomb-however-this-one https://ultraisabellaroyal.tumblr.com/post/184515042925/this-is-the-green-bath-bomb-that-we-made-this-one Self Evaulation: https://ashtoncreative.tumblr.com/post/184612163713/under-pressure-reflection/embed
0 notes