#geospatial imaging
Explore tagged Tumblr posts
Visit Tumblr Blog
Explore Tumblr blogs with no restrictions, modern design and the best experience.
Last Seen Tumblr Blogs


Fun Fact
BuzzFeed published a report claiming that Tumblr was utilized as a distribution channel for Russian agents to influence American voting habits during the 2016 presidential election in Feb 2018.
Text
Hey did y'all know that there's an awesome online catalog of polar maps that are super detailed?
As well as this (slightly complicated) USGS tool that will provide things like historical aerial photographs of locations of your choosing, including Antarctica (the Antarctic Single Frames criteria under Data Sets has a lot of great aerial photographs).
So if you're wanting to explore locations in detail, I suggest these! (courtesy of my geoscientist best friend)
Go forth! Have fun! :)
24 notes
·
View notes
Text
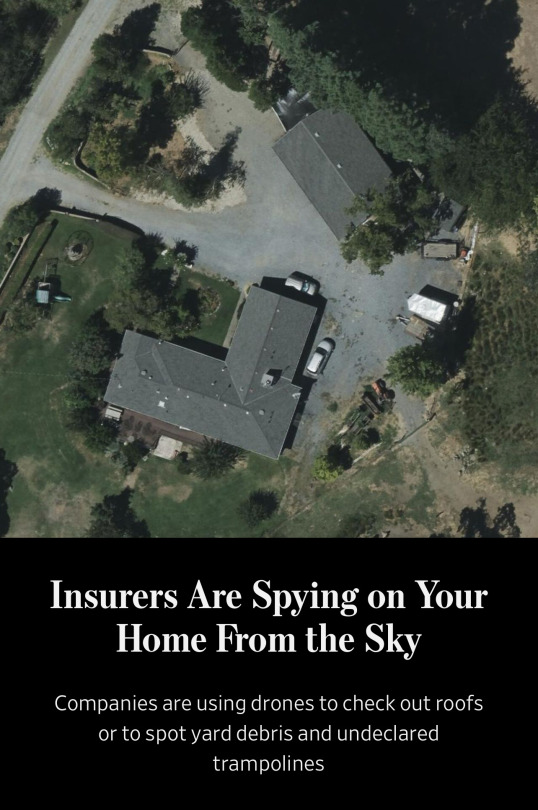
Cindy Picos was dropped by her home insurer last month. The reason: aerial photos of her roof, which her insurer refused to let her see.
“I thought they had the wrong house,” said Picos, who lives in northern California. “Our roof is in fine shape.”
Her insurer said its images showed her roof had “lived its life expectancy.” Picos paid for an independent inspection that found the roof had another 10 years of life. Her insurer declined to reconsider its decision.
Across the U.S., insurance companies are using aerial images of homes as a tool to ditch properties seen as higher risk.
Nearly every building in the country is being photographed, often without the owner’s knowledge. Companies are deploying drones, manned airplanes and high-altitude balloons to take images of properties. No place is shielded: The industry-funded Geospatial Insurance Consortium has an airplane imagery program it says covers 99% of the U.S. population.
The array of photos is being sorted by computer models to spy out underwriting no-nos, such as damaged roof shingles, yard debris, overhanging tree branches and undeclared swimming pools or trampolines. The red-flagged images are providing insurers with ammunition for nonrenewal notices nationwide.
“We’ve seen a dramatic increase across the country in reports from consumers who’ve been dropped by their insurers on the basis of an aerial image,” said Amy Bach, executive director of consumer group United Policyholders.
The increasingly sophisticated use of flyby photos comes as home insurers nationwide scramble to “derisk” their property portfolios, dropping less-than-perfect homes in an effort to recover from big underwriting losses.
(continue reading)
56 notes
·
View notes
Text
There are more than 114,000 missing persons in Mexico, and that number is continuing to rise. Criminal violence in the country is at a record level, largely driven by gangs and drug cartels. Many of those missing are buried in clandestine graves all across the country.
To contribute to the solution of this complex problem, a group of scientists from the Center for Research in Geospatial Information Sciences (CentroGeo) put technology and data analysis at the service of the searches.
"I never thought I would have to work on this, but if this knowledge is of any use, now is the time to show it," says José Luis Silván, a geographer at CentroGeo. Years ago, as part of his doctoral work, he specialized in measuring forest biomass and human populations through satellite information. At that time, he was far from imagining the scientific work he is doing today: investigating the potential of drones, hyperspectral images, and protocols to detect clandestine graves.
In a recent article published in the International Journal of Forensic Research and Criminology, Jorge Silván and researcher Ana Alegre insist that studying the geographical environment is very important to understand in depth a crime such as disappearance. Thus, “due to its context and diversity of climates, the case of Mexico may represent an opportunity for the development of investigations.”
Finding burials requires hard work. All available information and resources must be optimized. Therefore, scientists have evaluated the use of remote sensing tools and have systematized information from previous findings. They seek to discover patterns in the behavior of the perpetrators and, with this, to find burials.
According to Red Lupa, 88% of the 114,000 cases of disappearances in Mexico occurred between 2000 and May 2024. 10,315 were registered in 2023, the most on record. This represents an average of 29 people per day. Jalisco, Tamaulipas, State of Mexico, Veracruz and Nuevo Leon are the entities with the highest incidences.
Justice is almost non-existent, with 99% impunity for this crime. For this reason, since 2007 alone, civil society has formed more than 300 search groups, mostly made up of family members who scour the land guided by witness statements or organized in general brigades. These groups have detected most of the 5,696 clandestine graves reported on Mexican soil.
The association United for Our Disappeared searches in the north of the country, in Baja California. One of its members, who preferred to remain anonymous, has been searching for his son for 18 years. He says they have been using pointed rods to detect graves for more than 10 years. This is one of the most widely used tools in Mexico for this purpose. "We fit the rod in where we suspect the earth was removed, insert it, pull it out and smell it. If there are bone remains or tissue, you can tell by the smell. It is a strong odor, easy to detect. It smells like organic matter in the process of decomposition."
Before, he says, they used a georadar—a device similar to a pruning shear that detects inconsistencies in the ground—but they abandoned this practice because it was not very useful. The radar responds to almost any kind of object, from chips to boats. The last time they used it, it returned 40 suspicious spots, but none were positive. In Mexicali, another group uses a drone to fly over areas and detect changes in the terrain. Others have used machines to dig holes instead of shovels. Some innovations are abandoned over time, but the use of rods remains.
In 2014, after the disappearance of 43 Ayotzinapa normalistas in Mexico, Silván and other CentroGeo professionals joined the scientific advisory board on the case. During the search for the students, different civilian groups and government brigades detected dozens of illegal graves. In less than 10 months, the Mexican Attorney General's Office counted 60 sites and 129 bodies in the state of Guerrero. As a result of the raids, 300 illegal graves were revealed. Since then, the number of clandestine graves has only grown.
No one anticipated the size of this horror. The report "Searching between pain and hope: Findings of clandestine graves in Mexico 2020 - 2022", exposes with hemerographic data that in those two years, 1,134 clandestine graves were registered, with 2,314 bodies and 2,242 remains. In proportional terms, Colima reported the highest rate of illegal graves, with 10 per 100,000 inhabitants. It was followed by Sonora, Guanajuato, Guerrero, Sinaloa and Zacatecas.
By number of cases, Guanajuato, Sonora and Guerrero stand out. These three entities account for 42% of the records. By April 2023, a journalistic investigation by Quinto Elemento Lab reported that the number of illegal burials reached 5,696 clandestine graves, and that more than half of them were detected during the current federal administration.
Employing his field of study, remote sensing, José Luis Silván uses images captured with satellites, drones or airplanes, from which he extracts geospatial information using knowledge of the physics of light, mathematics and programming. Multispectral and hyperspectral images capture subsurface information using sensors that record wavelengths of light imperceptible to the human eye, making them useful for searching.
In 2016, during a first study by CentroGeo researchers, they simulated burials with pig carcasses to evaluate the potential of using hyperspectral cameras in searches and learn what information from the sensors was useful to them. The Mexican researchers knew from research in other countries that successful detection with these techniques depends, in part, on being able to recognize how carcasses (and their spectral images) change in different soils and climates.
The experiment was carried out on rented land in the state of Morelos. There they buried seven animals and evaluated the light reflected by the soil at different wavelengths for six months. They concluded that a hyperspectral camera, which provides more than a hundred layers of data, has the potential to detect clandestine burials, although the technique is only effective three months after burial. They tried to arrange for the acquisition of a camera and drone (valued at 5 million pesos) through the National Search Commission, but were unsuccessful.
Faced with this, they began to evaluate more affordable alternatives, such as multispectral devices. Today, despite the fact that spaces such as the Commission for the Search for Disappeared Persons of the State of Jalisco (COBUPEJ—-with which they have a partnership—has acquired this equipment, no national strategy exists to deploy these technologies systematically.
Some time later, the scientists took on a bigger challenge. When they briefed the National Search Commission on the usefulness of remote sensing for locating burials, officials told them that in some regions of the Northwest, the greatest need was to locate substances used to conceal crimes. "They dispose of them in caustic soda or with chemicals, char them and incinerate them in the open air or in crematoria; they throw the remains away or bury them," the researcher says.
So, in 2021, Silván's group did another experiment, this time in Hidalgo and with a spectroradiometer, which measures how different substances reflect light. For that study, they tested the trace of substances used in crimes. They found that diesel, muriatic acid and blood treated with anticoagulants require more precise imaging to be located, but that most substances, such as caustic soda, lime, blood and those resulting from open burning could be detected with multispectral sensors, which are less expensive.
CentroGeo has also participated in the development of complementary strategies to identify areas with a high probability of harboring clandestine graves. One example is the training of mathematical models with the coordinates of previous findings and the characteristics of the sites preferred by criminals, which they call clandestine spaces and which define as those which are easy to access for perpetrators and of low visibility to the population.
In addition, they have been using the signs that decomposing bodies leave on the vegetation for years. As a corpse decomposes, it releases nutrients into the soil, in particular increasing the concentration of nitrogen. In plants, this element is linked to chlorophyll, which gives them their greenness. In experiments with buried pigs, they have observed that a chlorophyll indicator can be quantified through satellite images. They measure how fast this index grows to detect sites with anomalies. This tool is available on the "Clandestine Space" platform.
Silván says that to interpret the nitrogen signal, they must consider that the gas signal can also vary due to the use of fertilizers or rains that carry nutrients. The presence of nitrogen, then, is not definitive proof of the existence of trenches, but it provides indications that justify paying attention in certain regions. The National Search Commission has been trained to use this indicator.
In Baja California, a northern state with 17,306 missing persons cases, these strategies have already been used. They first analyzed 52 locations of known graves and deduced that, because of the way they were distributed, there was a high probability of finding more graves at a distance of between 18 and 28 kilometers from those already known. They also looked for possible "clandestine spaces" and identified that 32% of the territory of Baja California had the potential to be used for that purpose. Finally, they reviewed the concentration of chlorophyll in satellite images. The result was a useful accompaniment for some family brigades.
Recently, Ana Alegre and José Silván analyzed geospatial models that could explain the distribution of graves in 10 states. They found that the travel time it would take an offender to get from urban streets to the grave is the factor that most influences the location of graves. "The secrecy sought by perpetrators seemed less important than reducing the effort they invest in creating the grave," their article says.
In addition to collaborating with the government, CentroGeo researchers work with civil associations such as Regresando a casa Morelos and Fuerzas unidas por nuestros desaparecidos en Nuevo León (FUNDENL). Some time ago, the former asked them to survey a site. "We collected thermal images and three-dimensional models to provide information," says Silván. In addition, they gave a workshop for visual interpretation. Silván describes the members of "Returning Home Morelos" as dedicated people. "They want to find their loved ones, they are willing to learn anything, to analyze an image or fly a drone. To everything."
With information from the FUNDENL collective and support from the American Jewish World Service, CentroGeo created "Huellas de vida", a platform that crosses the information of unfound persons and unidentified bodies with data from objects found in clandestine burial sites in Nuevo León. The intention is to detect coincidences that will help solve cases.
The geographer points out that the investigation is advancing, while the forms and numbers of disappearances are multiplying. Other countries, he says, are installing ground penetration radars on drones, or are planning to use electronic noses as indicators of methane, an element that corpses release at a certain stage of decomposition. To search for missing persons from the Spanish Civil War, for example, patterns in geographic data were tracked to narrow down search sites.
The big pending issue is to evaluate the real contribution that geographic information has had in uncovering crime scenes. "It is complicated to have feedback, even with the National Commission, because they are not obliged to tell us where they have findings." It will be until they have the new reports when they will be able to collate the results and measure the impact of their contributions. For now, "it is complicated to attribute the findings to our tools and information".
For his part, the member of United for our Disappeared assures that the search groups are the ones who have found most of the clandestine graves currently located. The usual thing, he says, is that the governments do not have departments for this work and only search when they have declarations that oblige them to do so. With the collectives it is different, because "we receive anonymous information, and even if we have no information, we still schedule searches and go out".
Finding graves is the beginning of another loss. When they have reason to excavate, they use picks and shovels and, if they find human remains, the authorities (who usually accompany them) cordon off the area and proceed with their work. If they are not present, they call them. "From there, many times we don't know what's going on, we don't get feedback from the authorities. We say that the person we found is lost again." The problem is general, "the collectives complain that people get lost in the bureaucratic process". In few cases, they say, the Prosecutor's Office restores the identity of the disappeared.
While technology is integrated into the systematic searches, collectives such as United for our Disappeared ask society to share the information they have on missing persons. "We only want to find them, all the information that reaches the collectives is anonymous," says the interviewee whose identity we reserve. The authorities have accepted this, he assures.
For his part, José Silván comments that, as a result of the collaboration with COBUPEJ and other institutions, they are about to publish a book to disseminate techniques for the detection of graves that they tested during their work.n de fosas que probaron durante un año en dos sitios de inhumación controlados en Jalisco, así como otras experiencias recogidas a nivel nacional a través de la ciencia ciudadana que hacen las madres buscadoras. The book is entitled Interpreting Nature to Find Them and is coordinated by Tunuari Chavez, head of the COBUPEJ context unit, and Jose Silvan under the direction of commissioner Victor Avila.
8 notes
·
View notes
Text
How Google Maps, Spotify, Shazam and More Work
"How does Google Maps use satellites, GPS and more to get you from point A to point B? What is the tech that powers Spotify’s recommendation algorithm?
From the unique tech that works in seconds to power tap-to-pay to how Shazam identifies 23,000 songs each minute, WSJ explores the engineering and science of technology that catches our eye.
Chapters:
0:00 Google Maps
9:07 LED wristbands
14:30 Spotify’s algorithm
21:30 Tap-to-Pay
28:18 Noise-canceling headphones
34:33 MSG Sphere
41:30 Shazam "
Source: The Wall Street Journal
#Tech#Algorithm#WSJ
Additional information:
" How Does Google Map Works?
Google Maps is a unique web-based mapping service brought to you by the tech giant, Google. It offers satellite imagery, aerial photography, street maps, 360° panoramic views of streets, real-time traffic conditions, and route planning for traveling by foot, car, bicycle, or public transportation.
A short history of Google maps:
Google Maps was first launched in February 2005, as a desktop web mapping service. It was developed by a team at Google led by Lars and Jens Rasmussen, with the goal of creating a more user-friendly and accurate alternative to existing mapping services. In 2007, Google released the first version of Google Maps for mobile, which was available for the Apple iPhone. This version of the app was a huge success and quickly became the most popular mapping app on the market. As time has passed, Google Maps has consistently developed and enhanced its capabilities, including the addition of new forms of map data like satellite and aerial imagery and integration with other Google platforms like Google Earth and Google Street View.
In 2013, Google released a new version of Google Maps for the web, which included a redesigned interface and new features like enhanced search and integration with Google+ for sharing and reviewing places.
Today, Google Maps is available on desktop computers and as a mobile app for Android and iOS devices. It is used by millions of people around the world to get directions, find places, and explore new areas.
How does google maps work?
Google Maps works by using satellite and aerial imagery to create detailed maps of the world. These maps are then made available to users through a web-based interface or a mobile app.
When you open Google Maps, you can search for a specific location or browse the map to explore an area. You can also use the app to get directions to a specific place or find points of interest, such as businesses, landmarks, and other points of interest. Google Maps uses a combination of GPS data, user input, and real-time traffic data to provide accurate and up-to-date information about locations and directions. The app also integrates with other Google services, such as Google Earth and Google Street View, to provide additional information and features.
Overall, Google Maps is a powerful tool that makes it easy to find and explore locations around the world. It’s available on desktop computers and as a mobile app for Android and iOS devices.
Google uses a variety of algorithms in the backend of Google Maps to provide accurate and up-to-date information about locations and directions. Some of the main algorithms used by Google Maps include:
Image recognition: Google Maps uses image recognition algorithms to extract useful information from the satellite and street view images used to create the map. These algorithms can recognize specific objects and features in the images, such as roads, buildings, and landmarks, and use this information to create a detailed map of the area.
Machine learning: Google Maps uses machine learning algorithms to analyze and interpret data from a variety of sources, including satellite imagery, street view images, and user data. These algorithms can identify patterns and trends in the data, allowing Google Maps to provide more accurate and up-to-date information about locations and directions.
Geospatial data analysis: Google Maps uses geospatial data analysis algorithms to analyze and interpret data about the earth’s surface and features. This includes techniques like geographic information systems (GIS) and geospatial data mining, which are used to extract useful information from large datasets of geospatial data.
Overall, these algorithms are an essential part of the backend of Google Maps, helping the service to provide accurate and up-to-date information to users around the world.
Google Maps uses a variety of algorithms to determine the shortest path between two points:
Here are some of the algorithms that may be used:
Dijkstra’s algorithm: This is a classic algorithm for finding the shortest path between two nodes in a graph. It works by starting at the source node and progressively exploring the graph, adding nodes to the shortest path as it goes.
A* search algorithm: This is another popular algorithm for finding the shortest path between two points. It works by combining the benefits of Dijkstra’s algorithm with a heuristic function that helps guide the search toward the destination node.
It’s worth noting that Google Maps may use a combination of these algorithms, as well as other specialized algorithms, to determine the shortest path between two points. The specific algorithms used may vary depending on the specifics of the route, such as the distance, the number of turns, and the type of terrain. "
Source: geeksforgeeks.org - -> You can read the full article at geeksforgeeks.org
#mktmarketing4you#corporatestrategy#marketing#M4Y#lovemarketing#IPAM#ipammarketingschool#ContingencyPlanning#virtual#volunteering#project#Management#Economy#ConsumptionBehavior#BrandManagement#ProductManagement#Logistics#Lifecycle
#Brand#Neuromarketing#McKinseyMatrix#Viralmarketing#Facebook#Marketingmetrics#icebergmodel#EdgarScheinsCultureModel#GuerrillaMarketing #STARMethod #7SFramework #gapanalysis #AIDAModel #SixLeadershipStyles #MintoPyramidPrinciple #StrategyDiamond #InternalRateofReturn #irr #BrandManagement #dripmodel #HoshinPlanning #XMatrix #backtobasics #BalancedScorecard #Product #ProductManagement #Logistics #Branding #freemium #businessmodel #business #4P #3C #BCG #SWOT #TOWS #EisenhowerMatrix #Study #marketingresearch #marketer #marketing manager #Painpoints #Pestel #ValueChain # VRIO #marketingmix
Thank you for following All about Marketing 4 You
youtube
2 notes
·
View notes
Text
Software in Intelligence Community - Lodi Palle
According to Lodi Palle Software engineering plays a crucial role in the intelligence community, which comprises various government agencies and organizations responsible for collecting, analyzing, and disseminating intelligence to support national security and decision-making.
Here are some ways in which software engineering is involved in the intelligence community:
Data Collection and Processing: The intelligence community deals with vast amounts of data from multiple sources, such as satellites, sensors, social media, and more. Software engineers design systems to collect, store, and process this data efficiently and securely. They also work on data integration and data cleaning to ensure accuracy and consistency.
Signal Processing and Analysis: Signal processing techniques are essential in extracting meaningful information from raw data, such as audio, images, and communications intercepts. Software engineers develop algorithms and software tools to analyze and interpret these signals, aiding in intelligence gathering and surveillance activities.
Data Analytics and Machine Learning: Machine learning and data analytics are increasingly crucial in the intelligence community. Software engineers build and maintain machine learning models that can detect patterns, identify anomalies, and predict potential threats based on historical data and real-time inputs.
Cybersecurity: Protecting sensitive information and critical infrastructure from cyber threats is a top priority for the intelligence community. Software engineers develop and implement robust cybersecurity solutions to defend against cyberattacks and maintain the confidentiality, integrity, and availability of data.
Communication and Collaboration Tools: Effective communication and collaboration are essential within the intelligence community and with external partners. Software engineers create secure communication platforms and collaboration tools to facilitate information sharing while ensuring data remains protected.
Intelligence Analysis Tools: Software engineers design and develop specialized software tools to aid intelligence analysts in their work. These tools may include data visualization software, link analysis tools, and intelligence fusion platforms to help analysts draw insights from complex data sets.
Cryptanalysis: In the realm of cryptography, software engineers work on breaking codes and ciphers used by adversaries. This field involves developing algorithms and tools to decipher encrypted communications and uncover valuable intelligence.
Automation and Efficiency: Automation plays a critical role in streamlining intelligence processes. Software engineers develop scripts, workflows, and automation tools to enhance efficiency, reduce manual tasks, and accelerate analysis and decision-making.
Geospatial Intelligence: Geospatial intelligence involves analyzing and interpreting data based on location information. Software engineers develop geospatial analysis tools to identify patterns, track movements, and provide geolocation information for intelligence purposes.
Overall, software engineering enables the intelligence community to leverage technology effectively, process vast amounts of data, and gain valuable insights to protect national security and make informed decisions. It is a dynamic and evolving field, driven by the need to stay ahead of emerging threats and challenges in an ever-changing global landscape.
#lode palle#lodi palle#lode emmanuel palle#software engineer#emmanuel palle#lode emmanuelle palle#emmanuelpalle#lodi emmanuel palle
12 notes
·
View notes
Text

Gsource Technologies excels in Lidar and Photogrammetry Services, offering precision in Roads and Powerline Models, Utility Mapped Models, PIM (Product Information Modeling), and Surface Models. Leveraging advanced technology, they provide comprehensive solutions, including 2D Linework, CAD Conversions, Automated Contours, and Topo Creation. Their Lidar services capture detailed geographical data, ensuring accuracy in terrain representation, while Photogrammetry enhances mapping with high-resolution images.
Gsource Technologies stands out by delivering utility-mapped models, crucial for infrastructure planning, and PIM for efficient product data management. The company's commitment to excellence is evident in their adept CAD conversions and automated contour generation, facilitating seamless integration into diverse projects. Gsource Technologies sets the benchmark in Lidar and Photogrammetry services, driving innovation in geospatial solutions.
#gsourcetechnologies#architecturedesigns#engineeringdesigns#lidarservices#photogrammetryservices#caddrafting
2 notes
·
View notes
Text
Global Geospatial Analytics Market – $33B (2024) to $56B by 2029, 11.1% CAGR
Segmentation Overview The geospatial analytics market is segmented by:
Type: Surface & field analytics; Geovisualization; Network analysis; Artificial neural networks; Others
Technology: Remote sensing; GPS; GIS; Others
Solutions: Geocoding & reverse geocoding; Reporting & visualization; Thematic mapping & spatial analysis; Data integration & ETL; Others
Applications: Surveying; Disaster risk reduction & management; Medicine & public safety; Climate change adaptation; Predictive asset management; Others
End-Users: Agriculture; Defense & intelligence; Utilities & communication; Automotive; Government; Travel & logistics; Others
Regions: North America; Latin America; Europe; Asia-Pacific; Middle East & Africa To buy the report, click on https://www.datamintelligence.com/buy-now-page?report=geospatial-analytics-market
Market Size & Forecast
The global geospatial analytics market is projected to expand at a CAGR of 12.8% between 2024 and 2031.
Other projections estimate market growth from USD 32.97 billion in 2024 to USD 55.75 billion by 2029.
A broader estimate values the market at USD 114.3 billion in 2024, expected to reach over USD 226.5 billion by 2030.
Introduction & Definition
Geospatial analytics is the process of gathering, interpreting, and visualizing location-based data—drawn from satellites, GPS, mobile devices, sensors, and social media—using GIS, AI, and computer vision. This powerful fusion helps governments and businesses gain real-time insights into transportation, urban planning, agriculture, disaster response, defense, utilities, and logistics.
Market Drivers & Restraints
Key Drivers:
Smart City Expansion: The proliferation of IoT sensors and connected devices in urban infrastructure drives demand for spatial analytics to manage traffic, utilities, public safety, and emergency planning.
Technological Integration: Advances in AI, 5G, satellite imaging, and edge computing enable high-resolution, real-time spatial decision-making.
Enterprise Adoption: Widespread demand for location intelligence across sectors—such as agriculture, defense, utilities, transportation, and retail—boosts comprehensive geospatial integration.
Restraints:
Privacy & Security: Handling sensitive spatial data raises concerns over surveillance, data protection, and regulatory compliance.
Data Complexity: Integrating varied data sources—maps, sensors, satellite imagery—remains a challenge due to formatting and standardization issues.
Cost & Skills Gap: High initial investment and talent shortages for GIS and AI expertise hinder full-scale adoption.
Segmentation Analysis
By Type: Surface & field analytics lead due to applications in topography, hydrology, and asset monitoring. Geovisualization supports urban planning and stakeholder communication.
By Technology: GIS dominates software solutions; GPS and remote sensing—particularly LiDAR, radar, and GNSS—are key data capture technologies.
By Solutions: Thematic mapping and ETL tools are in high demand for data-driven decisions across utilities, logistics, and infrastructure.
By Applications: Surveying, disaster mitigation, climate adaptation, asset management, medicine, and public safety are major application fields.
By End-Users: Agriculture (precision farming), defense (geospatial intelligence), utilities, transportation, government services, and logistics are top verticals.To get a free sample report, click on https://www.datamintelligence.com/download-sample/geospatial-analytics-market
Geographical Insights
North America: Holds the largest market share (~34% in 2024), driven by government and defense investments, smart cities, and GIS adoption.
Europe: Adoption spans from transport and delivery logistics to environmental tracking; EU programs boost earth observation and AI integration.
Asia-Pacific: Fastest-growing region due to rapid urbanization and expansion in countries like China, India, and Japan.
Middle East & Africa: High growth supported by smart city initiatives and infrastructure investments.
Recent Trends or News
AI-Embedded Spatial Tools: Major GIS platforms are embedding AI and machine learning for predictive analysis.
Mobile Mapping & 3D Scanning: Use of LiDAR-equipped vehicles and drones is increasing rapidly in infrastructure and mapping applications.
Pandemic & Disaster Applications: The pandemic accelerated use of geospatial analytics for vaccine distribution, health mapping, and crisis response.
Competitive Landscape
Leading companies in the geospatial analytics market include:
Microsoft
Google
General Electric (GE)
SAP
Salesforce
Precisely
Oracle
RMSI
OmniSci
Maxar Technologies
Hexagon AB
TomTom
Trimble
Esri
CARTO
Orbital Insight
These companies lead through AI-powered tools, cloud-native GIS, satellite imagery, mobile solutions, and strategic acquisitions.
Impact Analysis
Economic Impact: Geospatial analytics streamlines operations—optimizing routes, reducing resource wastage, and enhancing project ROI.
Environmental Impact: Unlocks data for spatial monitoring—supporting climate modeling, land-use mapping, environmental compliance, and disaster mitigation.
Social Impact: Shapes public health response systems, emergency services, and urban planning, while challenging privacy norms.
Technological Impact: Drives growth in cloud GIS, AI-engineered mapping, real-time analytics, and sensor networks, enabling scalable spatial insights.
Key Developments
GeoAnalytics Engine by Esri: An AI-integrated GIS platform for advanced spatial querying and real-time analytics.
Hexagon Captura Launch: Optical sensor-based system enhancing spatial measurement precision.
CADLM Acquisition by Hexagon: Adds simulation and reliability modeling for enhanced engineering workflows.
Orbital Insight Growth: Enhances satellite-based analytics capabilities through new partnerships and investment.
Report Features & Coverage
This market report includes:
Global and regional market sizing (2018–2024) with forecasts to 2031
In-depth segmentation by type, technology, solution, application, industry, and region
Competitive landscape with company profiling
Key trends, opportunities, and growth challenges
SWOT analysis, Porter’s Five Forces, and market attractiveness index
Recent innovations and investment updates
About Us
We are a global market intelligence firm committed to delivering in-depth insights across emerging technologies. Our expertise in geospatial analytics helps clients unlock data-driven innovation, streamline operations, and improve strategic planning across industries. We provide accurate forecasting, custom reports, and actionable guidance tailored to enterprise and government needs.
Contact Us
Email: [email protected]
Phone: +1 877 441 4866
0 notes
Text
How Drones Are Revolutionizing Infrastructure Monitoring in India
Infrastructure projects fuel India’s economic growth—from highways threading across mountains to pipelines buried beneath fields. But traditional inspections (using ground teams, scaffolding, and manual surveillance) are time-consuming, expensive, and often risky. Enter drones: high-flying game-changers, enabling safer, faster, and more accurate monitoring of critical assets. And at the forefront stands Aebocode Technologies, a premier drone manufacturing company in India pushing the boundaries of aerial innovation.

🛩️ From Sky to Site: The Rise of Drone Surveillance
India's infrastructure expansion—highways, railways, bridges, power lines—is monumental. The National Highways Authority of India (NHAI), for example, has mandated monthly drone surveys and video recording for large-scale projects. Private firms like Marvel Geospatial have flown drones over 31,000 km of national highways, boosting construction speed by up to 5×, and helping resolve disputes using timestamped 4K video evidence.
Similarly, power utilities adopt drones to detect hotspots and infrastructure faults early via thermal imaging . Oil & gas firms—like Oil India and GAIL—use drones to patrol pipelines in challenging terrain, spotting encroachments and leaks before they become crises.
Major Benefits Over Traditional Techniques
ChallengeTraditional ApproachDrone-Based SolutionImpact
Scale & time Slow ground-surveys Rapid aerial scans 40%‑60% faster
Cost Labor and equipment-heavy Fewer personnel, less gear ~40% cost savings
Safety Risky access Remote piloting Lower accident risk
Data quality Limited visuals High-res, thermal, multispectral Early problem detection
Documentation & tracking Fragmented, manual Geo-tagged reports & video Clear audit trail
Aebocode’s Role: India’s Leading Drone Manufacturing Company in India
Headquartered in Chandigarh, Aebocode Technologies is a trailblazing drone manufacturing company in India developing UAVs specifically for critical infrastructure applications. Their lineup includes urban/industrial drones equipped with high-definition cameras and sensors—ideal for mapping, surveying, and inspecting assets like bridges, towers, and pipelines .
Beyond hardware, Aebocode integrates analytics to detect cracks, hotspots, and structural anomalies—helping stakeholders prioritize maintenance before catastrophes. By enabling remote inspections, they bolster worker safety and optimize resource use, embodying the ethos of a true drone manufacturing company in India committed to infrastructure tech evolution.
Real-World Use Cases
1. Highway & Bridge Surveillance
During Bharatmala highway development, drone-based footage helped monitor project progress, curb encroachments, and enforce quality compliance. Aebocode's industrial drones, with thermal and HD imaging, could have empowered similar initiatives—automating monthly progress reports and reducing manual burden.
2. Power Line & Transmission Towers
Thermal sensors on Aebocode drones can detect unstable components, frayed wires, or joint failures in real-time. Scheduled or upon-event deployments enhance predictive maintenance—saving downtime and preventing blackouts.
3. Pipeline Monitoring
For oil, gas, or water pipelines spanning challenging terrain—especially in central and northern India—drones can patrol regularly, spot encroachments and early leaks, and relay geotagged images to operation centers . Aebocode’s fixed-wing models offer stability and extended flight time ideal for these missions.
4. Rail & Metro Systems
Indian Railways has piloted drone cleaning and surveillance at stations like Kamakhya. For track integrity, damaged sleepers, or vegetation, Aebocode drones can beam live video to maintenance crews—speeding up repairs and service reliability.
5. Urban Infrastructure & Smart Cities
Municipal corporations—including ones like Guntur and railway authorities—use drones to monitor urban cleanliness, traffic flow, and civic infra projects. Aebocode’s smart-city drones, with traffic analytics and pollution sensors, are perfectly aligned with these needs .
Tech Behind the Flight
Aebocode’s UAV systems integrate several cutting-edge features:
High‑Resolution & Thermal Cameras: Detect structural flaws and hotspots in pillars, bridges, towers.
Multispectral Sensors: Ideal for early crack detection and material stress analysis.
Extended Flight (up to 60 min): Enables wide-area surveys, especially with fixed-wing models.
Live Feed & Analytics: Enables real-time decisions—vital during infrastructure emergencies.
Geospatial Tagging: Metadata embeds location and altitude for precise action points.
Their in-house R&D emphasizes customized builds—a hallmark of a forward-thinking drone manufacturing company in India prioritizing localized innovation.
Regulatory & Operational Enablers
India’s drone policy—especially since the 2021 Drone Rules and Digital Sky platform—simplifies licensing and beyond-visual-line-of-sight (BVLOS) operations . Civilian adoption is rising, with PLI benefits and spotlight at events like Surya Drone Tech 2025, where Aebocode showcased its UAVs and even had the Uttarakhand Governor pilot one live aebocode.com.
Vision Ahead: Scaling & Impact
India’s infrastructure needs will only grow—roads, rails, power, pipelines, urban utilities. Drones offer:
Scale: Rapid surveying over vast tracts.
Insight: Detecting issues invisible from ground level.
Efficiency: Lower costs through automation and quicker deployment.
Leading drone manufacturing company in India like Aebocode are vital to this transformation. Their emphasis on “Make in India” ensures both self-reliance and compliance with local standards—accelerating national resilience.
Conclusion
Drones are ushering in a new era of infrastructure monitoring in India—safer, faster, and more accurate than ever. With mounting use across highways, power grids, pipelines, railways, and urban landscapes, they’re proving indispensable.
Aebocode Technologies, a pioneering drone manufacturing company in India, is at the heart of this revolution—offering bespoke UAVs, analytics, and training solutions that blend innovation with ground reality.
As infrastructure demands evolve, drone-enabled monitoring promises reduced costs, reduced risk, and higher uptime—building the backbone for a stronger, smarter India.
#fire fighting uav#firefighting drones#fighting drone#drones uav#firedrone#fixedwingdrone#cargodrones#drones
0 notes
Text

How Data Science is Helping Fight Climate Change
Climate change is no longer a distant threat—it’s a reality affecting ecosystems, economies, and everyday lives. From rising sea levels to extreme weather events, the impact is global. But there’s a powerful tool helping scientists, policymakers, and activists respond more effectively: Data Science.
With the explosion of big data, sensors, satellites, and machine learning algorithms, data science is becoming a central force in the fight against climate change. Let’s explore how.
1. Predicting Climate Patterns with Machine Learning
One of the most powerful applications of data science is in climate modeling and forecasting. Traditional models were limited in processing power and granularity. Now, with advanced machine learning techniques and high-performance computing, scientists can:
Simulate climate changes decades into the future
Predict weather patterns more accurately
Model extreme events like hurricanes, floods, or droughts
For example, DeepMind’s AI model, trained on vast datasets of radar data, can now predict rainfall with higher precision than traditional methods. These forecasts help communities prepare for disasters and reduce damage.
2. Satellite Imagery and Earth Observation
Satellites continuously gather images and climate data from space. These images are rich with information—about deforestation, glacier melting, ocean temperatures, and more.
Data scientists use image recognition and geospatial analytics to:
Monitor forest cover loss in the Amazon
Track ice sheet melting in Antarctica
Identify urban heat islands in growing cities
Measure carbon emissions from industrial zones
Organizations like NASA, ESA, and Google Earth Engine are publishing petabytes of open climate data for researchers to build models, apps, and solutions.
3. Carbon Footprint Analysis
Governments and companies are under increasing pressure to reduce their carbon footprints. But first, they need to measure them accurately.
Data science enables:
Carbon accounting across supply chains
IoT integration in factories for real-time emission tracking
Predictive models to simulate the impact of green policies
For instance, companies like Microsoft and Apple are using advanced analytics to reduce their net carbon emissions and optimize energy use across data centers.
4. Climate-Smart Agriculture
Agriculture is both a victim and a contributor to climate change. Data science is helping farmers adapt through climate-smart agriculture practices:
Yield prediction using historical and weather data
Soil health monitoring through sensors and analytics
Pest and disease detection using AI-driven image classification
Precision irrigation to reduce water usage
Platforms like IBM’s Watson Decision Platform for Agriculture use AI to give farmers insights that boost productivity while reducing environmental impact.
5. Greener Cities with Smart Data
Urban areas contribute heavily to CO₂ emissions. With smart data collected from sensors, traffic cams, GPS, and public utilities, data scientists help cities become more sustainable:
Optimizing public transport to reduce fuel consumption
Monitoring air quality in real-time
Planning green spaces using heat maps
Managing waste and recycling more efficiently
Cities like Singapore, Amsterdam, and San Francisco are already leading the way in becoming “smart cities,” using data science to reduce emissions and improve quality of life.
6. Renewable Energy Optimization
The shift to solar, wind, and hydro power brings new challenges: fluctuating outputs, grid integration, and energy storage. Here’s where data science steps in:
Forecasting sunlight and wind speeds to predict energy generation
Optimizing battery storage and distribution
Balancing supply and demand across the smart grid
AI models from companies like Google DeepMind have already improved the output prediction of wind farms by up to 20%.
7. Climate Research and Citizen Science
Open-source projects and platforms allow anyone to contribute to climate research. Data scientists use crowd-sourced data to:
Map plastic waste in oceans
Collect wildlife migration data
Record local temperature anomalies
Tools like Zooniverse, Kaggle, and Climate Central invite data scientists and enthusiasts to work on real-world climate datasets and challenges.
8. Policy and Decision-Making Support
Data science doesn't just help collect and analyze data—it also helps governments make better decisions.
Predictive models simulate the outcome of climate policies
Visualization tools make complex data easier for decision-makers to understand
Data-driven reports guide investments in green technologies
The Intergovernmental Panel on Climate Change (IPCC), for example, uses advanced data analytics to build global climate reports that influence international treaties and agreements.
Challenges and Ethical Considerations
While data science offers powerful tools, it also comes with challenges:
Data privacy in sensor-based tracking
Biases in datasets or algorithms
Digital divide, where developing countries may lack infrastructure for data collection
Data scientists must follow ethical guidelines and ensure inclusive, transparent, and responsible use of technology in climate work.
Conclusion: The Role of Data Scientists in a Greener Future
Climate change is a complex, urgent problem—but data science gives us the power to understand, predict, and act.
As a data scientist, you're not just crunching numbers. You're helping to:
Save forests
Reduce emissions
Optimize energy use
Protect communities
Shape global policies
It’s a field where technology meets responsibility. And in the climate battle, every line of clean, purposeful code matters.
#datascience#climatechange#machinelearning#ai#bigdata#sustainability#environmentaldata#greenai#smartcities#carbonfootprint#renewableenergy#earthobservation#climatemodeling#iot#geospatialanalytics#climateaction#cleantech#techforgood#datascienceforclimate#nschool academy
0 notes
Photo


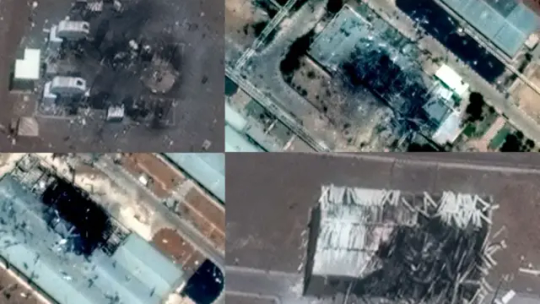

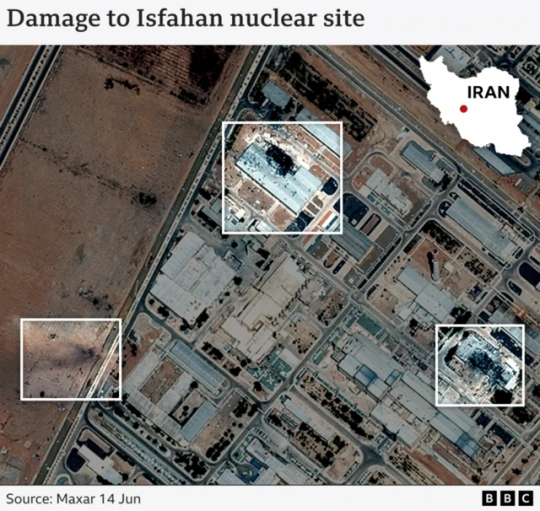


Paul Brown and Shayan SardarizadehBBC Verify senior journalists Chris Biggers/Umbra SpaceImagery and analysis captured on Friday by Umbra Space reveals damage to several parts of a missile complex near the city of Tabriz in north-western Iran.The damaged sites include, according to the annotated graphic provided by Umbra with analysis by geospatial intelligence consultant Chris Biggers: Weapon storage areas Missile shelters And silos In Kermanshah, low resolution imagery from Planet Labs shows what appears to be extensive burn marks to an area near a known missile base, and possible damage to two buildings.Footage we verified from the same site on Friday showed at least three large plumes of smoke rising from the base.Maxar also provided imagery showing significant damage to one structure at Iran's Islamic Revolutionary Guard Corps (IRGC) Ghadir ballistic missile base near Tehran, and considerable damage to the IRGC radar site in Piranshahr in West Azerbaijan Province. Paul Brown and Shayan SardarizadehBBC Verify senior journalists Maxar / BBCRecently released satellite imagery from Maxar shows the clearest picture yet of what happened at the Iranian nuclear sites at Natanz and Isfahan.At Natanz, we can see damage to the pilot fuel enrichment plant and an electrical substation, according to analysis by the Institute for Space and International Security.This follows on from earlier analysis of radar imagery that first showed the damage.On Friday, the head of the International Atomic Energy Agency, Rafael Grossi, told the UN Security Council that "the above-ground part of the pilot fuel enrichment plant, where Iran was producing uranium enriched up to 60% U-235, has been destroyed".Uranium-235 is essential both for nuclear power stations and also for nuclear weapons.Verified footage taken shortly after the strikes show several plumes of smoke rising from the site.On Saturday, the IAEA confirmed that four "critical buildings" had been damaged in Isfahan, including the Uranium conversion facility and the fuel plate fabrication plant.BBC Verify analysis of the latest images from Maxar found visible damage to at least two structures at Isfahan and an apparent scorch mark near the periphery of the site.The IAEA has said that "no increase in off-site radiation" has been recorded at either Natanz or Isfahan. Strikes by Israel and Iran are continuing as the conflict between the two countries enters its fourth day - you can read more about the ongoing conflict in our other live page Johanna ChisholmBBC Verify Live editor Hello and good morning from the live page team here at BBC Verify.We're continuing to track developments in Israel and Iran as the conflict between the two countries enters its fourth day.Here's what else we're keeping across: Digging into satellite imagery to locate where strikes have been carried out in Iran and Israel ... And using additional imagery to get a clearer picture of damage inflicted on two of Iran's key nuclear sites (more on that in our next post) In the Commons, our fact-check team will be across Home Secretary Yvette Cooper's expected statement, which comes after PM Keir Starmer announced there will be a full national statutory inquiry into grooming gangs We'll keep you updated on those lines here on BBC Verify Live - and for all the latest analysis and reaction head to the main BBC News live page.
0 notes
Text
Why Drone Mapping Is Changing the Way We Do Drone Survey
In the world of modern surveying, drone mapping is leading a major shift. No longer do teams rely solely on ground-based tools or slow, manual data collection. Instead, industries ranging from construction to environmental science are turning to drone-based solutions for faster, more accurate insights.

At LiDAR Solutions, we harness the power of drone mapping to deliver comprehensive site data in record time. Our drone systems capture high-resolution aerial images and convert them into 2D maps or 3D models with precise geospatial information. These outputs help project managers, engineers, and decision-makers make informed choices based on real-world visuals and data.
When paired with lidar surveying, the technology becomes even more powerful. LiDAR (Light Detection and Ranging) uses laser pulses to measure distances and capture detailed surface data—even through dense vegetation or in low-light conditions. This makes it ideal for topographic studies, infrastructure planning, and mining exploration.
What sets LiDAR-based drone survey solutions apart is their ability to combine speed with accuracy. Instead of taking weeks to gather and process site data, we can deliver detailed models within days. This efficiency saves businesses time, reduces labour costs, and eliminates many of the hazards associated with manual surveys.
Using a drone survey also limits disruption. We can scan hard-to-reach or hazardous areas without stepping foot on unstable ground. Whether you’re planning a new development or monitoring environmental changes over time, our approach offers unmatched safety and reliability.
LiDAR Solutions brings industry-grade drone systems and experienced pilots to every project. We customise each survey to suit your specific requirements and deliver your data in ready-to-use formats. From contour maps to elevation models, our outputs integrate seamlessly with CAD and GIS software.
As regulatory bodies demand greater transparency and accuracy in planning documents, investing in reliable survey methods has never been more important. Businesses that adopt lidar surveying and drone-based technologies are staying ahead of the curve.
In short, the evolution of drone survey methods is reshaping the landscape of surveying and mapping in Australia. Whether you manage a major infrastructure project or need precise data for environmental compliance, our team is here to help.
Want to learn how our drone mapping services can elevate your next project? Contact LiDAR Solutions today for a no-obligation consultation.
Source
0 notes
Text
Explore the Key Types of Satellite Imagery
Ever wondered how satellites capture detailed images of Earth? 🌍 Satpalda’s latest blog, Types of Satellite Imagery, breaks down the main categories — optical, infrared, radar, and hyperspectral — in a simple, insightful way. Whether you're in agriculture, urban planning, or environmental analysis, this quick guide shows how each type of imagery works and where it’s used. From cloud-penetrating radar to temperature-tracking thermal sensors, discover the tools shaping today’s geospatial intelligence.
0 notes
Text
If you ever had pastries at breakfast, drank soy milk, used soaps at home, or built yourself a nice flat-pack piece of furniture, you may have contributed to deforestation and climate change.
Every item has a price—but the cost isn’t felt only in our pockets. Hidden in that price is a complex chain of production, encompassing economic, social, and environmental relations that sustain livelihoods and, unfortunately, contribute to habitat destruction, deforestation, and the warming of our planet.
Approximately 4 billion hectares of forest around the world act as a carbon sink which, over the past two decades, has annually absorbed a net 7.6 billion metric tons of CO2. That’s the equivalent of 1.5 times the annual emissions of the US.
Conversely, a cleared forest becomes a carbon source. Many factors lead to forest clearing, but the root cause is economic. Farmers cut down the forest to expand their farms, support cattle grazing, harvest timber, mine minerals, and build infrastructure such as roads. Until that economic pressure goes away, the clearing may continue.
In 2024, however, we are going to see a big boost to global efforts to fight deforestation. New EU legislation will make it illegal to sell or export a range of commodities if they have been produced on deforested land. Sellers will need to identify exactly where their product originates, down to the geolocation of the plot. Penalties are harsh, including bans and fines of up to 4 percent of the offender's annual EU-wide turnover. As such, industry pushback has been strong, claiming that the costs are too high or the requirements are too onerous. Like many global frameworks, this initiative is being led by the EU, with other countries sure to follow, as the so-called Brussels Effect pressures ever more jurisdictions to adopt its methods.
The impact of these measures will only be as strong as the enforcement and, in 2024, we will see new ways of doing that digitally. At Farmerline (which I cofounded), for instance, we have been working on supply chain traceability for over a decade. We incentivize rule-following by making it beneficial.
When we digitize farmers and allow them and other stakeholders to track their products from soil to shelf, they also gain access to a suite of other products: the latest, most sustainable farming practices in their own language, access to flexible financing to fund climate-smart products such as drought-resistant seeds, solar irrigation systems and organic fertilizers, and the ability to earn more through international commodity markets.
Digitization helps build resilience and lasting wealth for the smallholders and helps save the environment. Another example is the World Economic Forum’s OneMap—an open-source privacy-preserving digital tool which helps governments use geospatial and farmer data to improve planning and decision making in agriculture and land. In India, the Data Empowerment Protection Architecture also provides a secure consent-based data-sharing framework to accelerate global financial inclusion.
In 2024 we will also see more food companies and food certification bodies leverage digital payment tools, like mobile money, to ensure farmers’ pay is not only direct and transparent, but also better if they comply with deforestation regulations.
The fight against deforestation will also be made easier by developments in hardware technology. New, lightweight drones from startups such as AirSeed can plant seeds, while further up, mini-satellites, such as those from Planet Labs, are taking millions of images per week, allowing governments and NGOs to track areas being deforested in near-real time. In Rwanda, researchers are using AI and the aerial footage captured by Planet Labs to calculate, monitor, and estimate the carbon stock of the entire country.
With these advances in software and hard-tech, in 2024, the global fight against deforestation will finally start to grow new shoots.
5 notes
·
View notes
Text
Drone Surveying: The Epitome of Precision & Aerial Intelligence
In the modern age of rapid infrastructure development, environmental assessment, and data-driven decision-making, drone surveying has emerged as a revolutionary force in the world of geospatial technology. Known for its exceptional precision and efficiency, drone surveying—also referred to as UAV (Unmanned Aerial Vehicle) surveying—is redefining the way we capture, process, and analyze spatial data.
What Is Drone Surveying?
Drone surveying is the process of using unmanned aerial vehicles equipped with sensors, cameras, and GPS receivers to collect geospatial data from the air. Unlike traditional surveying methods that often require significant manpower and time, drone surveying allows surveyors to access and map large or hard-to-reach areas quickly, accurately, and cost-effectively.

High-resolution imagery, LiDAR sensors, multispectral cameras, and thermal sensors can be mounted on drones depending on the application. The data captured is processed using photogrammetry software to create detailed maps, 3D models, orthophotos, and digital elevation models (DEMs).
Advantages of Drone Surveying
Unmatched Accuracy: With RTK (Real-Time Kinematic) and PPK (Post-Processed Kinematic) technologies, drone surveys can achieve centimeter-level accuracy, making them ideal for engineering, construction, and infrastructure projects.
Rapid Data Collection: Drones can survey hundreds of acres in a single flight, drastically reducing field time compared to traditional methods.
Cost Efficiency: Reduced manpower, minimal equipment setup, and quick data acquisition translate into lower overall project costs.
Enhanced Safety: Surveying hazardous, unstable, or dangerous terrains—such as cliffs, mines, and rooftops—can be done safely from the air without putting human lives at risk.
Versatile Applications: From construction site monitoring and agriculture to mining, forestry, flood modeling, and disaster assessment, drone surveying is applicable across numerous sectors.
Key Applications of Drone Surveying
Construction & Infrastructure: Drones provide topographic maps and volumetric calculations essential for earthworks, road design, and structural planning.
Agriculture: Multispectral imaging helps assess crop health, irrigation issues, and pest infestations with precision.
Mining & Quarrying: Drones offer real-time volume measurements of stockpiles and monitor ongoing excavation work efficiently.
Environmental Monitoring: Drones assist in tracking deforestation, erosion, and changes in water bodies with time-lapse mapping.
Urban Planning: They help in creating 3D city models for infrastructure development and land use planning.
The Future of Drone Surveying
The integration of AI, cloud computing, and machine learning is enhancing the analytical capabilities of drone data. Real-time insights, automation, and predictive modeling are becoming more accessible through user-friendly platforms.
As regulatory frameworks evolve and drone technology becomes more affordable, even small businesses and local governments are adopting UAV-based surveying to streamline projects and boost productivity.
Conclusion
Drone surveying stands as the epitome of precision and aerial intelligence, transforming industries with its dynamic capabilities. It not only improves the accuracy and speed of data collection but also opens up new possibilities for innovation in mapping and analysis. For anyone involved in geospatial projects—from engineers and architects to environmentalists and city planners—embracing drone surveying is no longer optional; it is essential for staying ahead in the digital age.
0 notes
Text
The Role of Aerial Surveying in Modern Infrastructure
In the evolving landscape of civil engineering and urban planning, Aerial Surveying has emerged as a cornerstone of modern infrastructure development. Its precision, speed, and wide-ranging applications make it indispensable for large-scale projects across Australia. From transportation networks to construction planning, the technique has significantly transformed how infrastructure is designed, monitored, and maintained.

What is Aerial Surveying?
Aerial Surveying is a method of collecting geospatial data using airborne platforms, such as drones, helicopters, or fixed-wing aircraft. The process involves capturing high-resolution images, LiDAR data, and other forms of remote sensing information from above the ground. This data is then processed to create detailed maps, 3D models, and geographic information system (GIS) layers, which support planning and decision-making processes.
Advantages of Aerial Surveying in Infrastructure Projects
1. Speed and Efficiency
Traditional ground-based surveys can be time-consuming, especially in expansive or difficult-to-access areas. Aerial Surveying dramatically reduces the time required to gather data over large terrains. This rapid turnaround allows project managers to make quicker decisions and maintain tighter construction timelines.
2. High Precision and Accuracy
With advancements in technology, especially LiDAR and photogrammetry, Aerial Surveying offers a high degree of accuracy. This is crucial for infrastructure projects where every millimetre matters. Precise topographic data enables better design and reduces the likelihood of costly errors or rework during construction.
3. Enhanced Safety
Surveying dangerous or inaccessible terrain manually can pose serious safety risks. Aerial Surveying removes personnel from hazardous environments such as cliffs, wetlands, or high-traffic urban areas. This significantly minimizes the risk of accidents and injuries while maintaining high-quality data collection.
4. Cost-Effective Solutions
While the initial investment in aerial equipment may seem high, the overall cost savings are substantial. Aerial Surveying eliminates the need for extensive ground crews, reduces man-hours, and decreases the likelihood of project delays due to incomplete or inaccurate data.
Applications of Aerial Surveying in Australian Infrastructure
Australia’s diverse landscape—from coastal regions to the Outback—presents unique challenges in infrastructure planning. Aerial Surveying has become particularly valuable in overcoming these challenges across a variety of applications.
Urban Planning and Development
In growing metropolitan areas like Sydney, Melbourne, and Brisbane, Aerial Surveying plays a critical role in urban planning. Accurate elevation models and detailed imagery support zoning, land-use planning, and environmental assessments.
Transportation and Roadways
Highway and railway construction relies heavily on topographic and corridor surveys. Aerial Surveying allows engineers to plan optimal routes, avoid natural obstacles, and identify potential geotechnical issues before they arise.
Mining and Resource Management
The mining industry in regions such as Western Australia benefits significantly from Aerial Surveying. It provides essential volumetric data for excavation planning and environmental compliance, and facilitates continuous monitoring of active sites.
Utilities and Energy Infrastructure
Power lines, pipelines, and renewable energy installations require precise alignment and regular inspections. Aerial Surveying supports the design and maintenance of these assets, ensuring minimal environmental impact and efficient land use.
Integration with Modern Technologies
The effectiveness of Aerial Surveying is amplified when integrated with modern digital tools. Geographic Information Systems (GIS), Building Information Modelling (BIM), and machine learning algorithms are increasingly used alongside aerial data to enhance infrastructure planning. These integrations allow stakeholders to visualize outcomes, simulate scenarios, and make data-driven decisions with higher confidence.
Regulatory Considerations in Australia
The use of drones and other aerial equipment is regulated by the Civil Aviation Safety Authority (CASA) in Australia. Compliance with these regulations ensures safe and responsible use of Aerial Surveying technologies. Professional surveyors must adhere to licensing requirements and operational guidelines to guarantee data integrity and legal compliance.
The Future of Aerial Surveying in Infrastructure
As technology continues to evolve, so will the capabilities of Aerial Surveying. The future points to even greater automation, real-time data processing, and integration with AI for predictive analytics. In a country as vast and varied as Australia, these advancements will be crucial in meeting the growing demand for resilient, efficient, and sustainable infrastructure.
Conclusion
Aerial Surveying is redefining the way infrastructure projects are conceived and executed. Its advantages in speed, accuracy, safety, and cost make it a vital tool in the modern engineering toolkit. As Australia's infrastructure needs grow more complex, the role of Aerial Surveying will only become more critical—ensuring that development is smarter, faster, and more sustainable for future generations.
0 notes
Text

Gsource Technologies is at the forefront of revolutionizing the fields of geospatial mapping and data acquisition through its cutting-edge photogrammetry and LiDAR design services. With a commitment to precision and innovation, Gsource Technologies offers a comprehensive suite of solutions that cater to a wide range of industries.
Photogrammetry, a technique that involves extracting accurate measurements and 3D models from 2D images, is one of the core services provided by Gsource. Their team of experts utilizes state-of-the-art software and hardware to capture, process, and analyze imagery, ensuring clients receive highly detailed and reliable data for various applications such as urban planning, agriculture, environmental monitoring, and more.
In addition to photogrammetry, Gsource Technologies specializes in LiDAR (Light Detection and Ranging) design services. LiDAR technology utilizes laser pulses to create detailed 3D maps of terrain, structures, and objects, even in challenging environments. Gsource's LiDAR solutions are instrumental in applications like forestry management, infrastructure assessment, and autonomous vehicle development.
What sets Gsource Technologies apart is their dedication to customizing solutions to meet the unique needs of each client. They work closely with customers to design tailored photogrammetry and LiDAR solutions that maximize efficiency, accuracy, and cost-effectiveness.
In a world driven by data, Gsource Technologies stands as a beacon of excellence, providing top-tier photogrammetry and LiDAR design services that empower industries to make informed decisions and drive progress.
3 notes
·
View notes