#html css pie chart
Explore tagged Tumblr posts
Visit Tumblr Blog
Explore Tumblr blogs with no restrictions, modern design and the best experience.
Last Seen Tumblr Blogs


Fun Fact
The KCSC sent more than 20K requests to delete posts related to prostitution and porn to Tumblr from January to June 2017.
Text
HTML CSS Pie Chart
#html css pie chart#css pie chart#html css#codenewbies#frontenddevelopment#html5 css3#css#css tricks#css snippets#learn css#webdesign#learn to code
3 notes
·
View notes
Text
Progress Bars
YAYINDA! https://mguzel.com.tr/progress-bars/
Progress Bars
Progress Bars Shortcodes
Check out all the progress bars options and can be set in different styles with Visual Composer Progress Bar, Pie Chart shortcodes.
Default
60%
0%
Contextual classes
Striped
Animated
Border Radius
Sizes
Animated & Tooltips
HTML/CSS
100%
Design
85%
WordPress
75%
Photoshop
85%
Colors
Primary
50%
Secondary
70%
Tertiary
75%
Quaternary
40%
Circular
HTML/CSS0%
HTML/CSS
Sizes
0%
HTML/CSS0%
HTML/CSS0%
Options
HTML/CSS0%
HTML/CSS0%
HTML/CSS0%
0 notes
Text
Transforming Data into Insight: 4 Useful Big Data Visualization Solutions
Big data is entering people’s lives. Although obtaining data is not a big problem, many people do not know how to draw conclusions because there is too much data. Therefore, I am here to provide 4 useful big data visualization tools to help you understand the data.

Datawrapper is an online data visualization tool for making interactive charts. Once you upload the data from the CSV file or paste it directly into the field, Datawrapper will generate a bar, line or any other related visualization file. Many journalists and news organizations use Datawrapper to embed real-time charts into their articles. It is very easy to use and produce effective graphics.
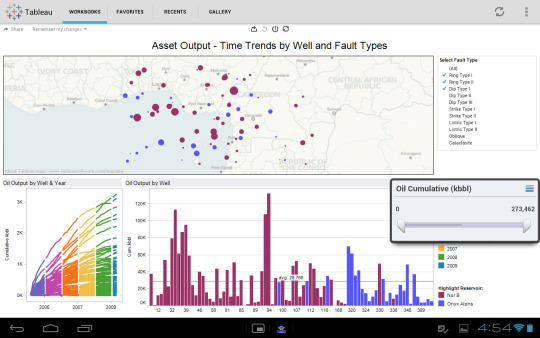
Tableau Public perfectly grafts data operations with beautiful charts. Its program is easy to use, companies can use it to drag and drop large amounts of data onto the digital “canvas”, and create various charts in a blink of an eye.
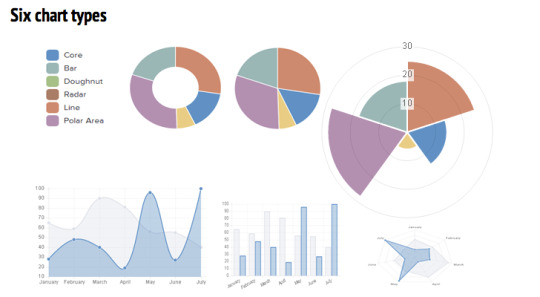
Chart.js is a free open-source JavaScript library for data visualization, which supports 8 chart types: bar, line, area, pie (doughnut), bubble, radar, polar, and scatter. Chart.js renders in HTML5 canvas and is widely covered as one of the best data visualization libraries.
D3.js is a JavaScript library for manipulating documents based on data. D3 helps you bring data to life using HTML, SVG, and CSS. D3’s emphasis on web standards gives you the full capabilities of modern browsers without tying yourself to a proprietary framework, combining powerful visualization components and a data-driven approach to DOM manipulation.
0 notes
Text
Discover 25+ CSS Charts And Graphs
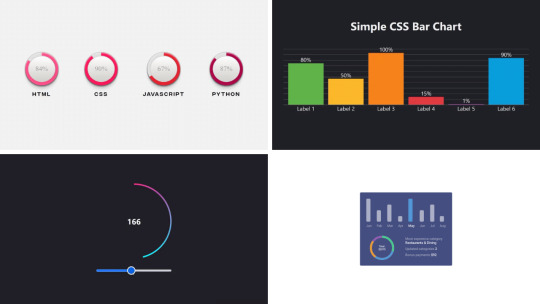
Welcome to CSS Monster, your go-to destination for discovering our curated collection of free HTML and CSS chart and graph code examples. These examples, carefully sourced from platforms like CodePen, GitHub, and other reputable resources, represent an exciting update to our July 2023 collection, introducing three new items to inspire your creativity. CSS, renowned for its versatility, offers a myriad of advantages when it comes to crafting charts and graphs: Flexibility: CSS empowers you with a high degree of customization, allowing the creation of charts and graphs that seamlessly align with your website's aesthetic. Interactivity: With the capabilities of CSS, you can design interactive charts and graphs that respond dynamically to user input, enhancing overall user engagement and experience. Performance: CSS-based charts and graphs are known for their swift loading times and optimal performance, ensuring a smooth user experience even on lower-end devices. We extend an invitation to explore our collection of CSS charts and graphs, tailored for both seasoned developers and those just starting their coding journey. We are confident that within this collection, you'll discover elements that ignite inspiration for your next project. It's worth noting that every item in our collection is freely available for use. So why wait? Embark on your exploration today and elevate your projects with the dynamic and visually appealing world of CSS charts and graphs! Author Hannah March 9, 2023 Links Just Get The Demo Link How To Download - Article How To Download - Video Made with HTML / CSS (SCSS) About a code PROGRESS DONUT CHARTS Compatible browsers:Chrome, Edge, Firefox, Opera, Safari Responsive:no Dependencies:- Author Adam Argyle February 12, 2023 Links Just Get The Demo Link How To Download - Article How To Download - Video Made with HTML / CSS / JS (Babel) About a code GRADIENT CIRCLE OUTLINE BOUND TO ANGLE Compatible browsers:Chrome, Edge, Firefox, Opera, Safari Responsive:yes Dependencies:- Author Mark Boots October 27, 2022 Links Just Get The Demo Link How To Download - Article How To Download - Video Made with HTML / CSS About a code SIMPLE CSS BAR CHART Compatible browsers:Chrome, Edge, Firefox, Opera, Safari Responsive:yes Dependencies:-
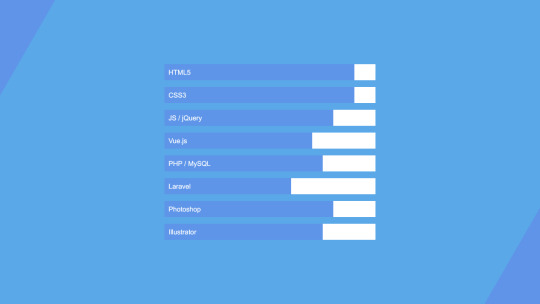
Author Temani Afif January 6, 2022 Links Just Get The Demo Link How To Download - Article How To Download - Video Made with HTML / CSS About a code CSS-ONLY PIE CHARTS Compatible browsers:Chrome, Edge, Firefox, Opera, Safari Responsive:no Dependencies:- Author Ana Tudor May 28, 2021 Links Just Get The Demo Link How To Download - Article How To Download - Video Made with HTML (Pug) / CSS (SCSS) About a code SKILLS CHART ANIMATION WITH A BIT OF HOUDINI MAGIC Compatible browsers:Chrome, Edge, Firefox, Opera, Safari Responsive:no Dependencies:-

Author Rami November 19, 2020 Links Just Get The Demo Link How To Download - Article How To Download - Video Made with HTML / CSS About a code PURE CSS AREA CHART Compatible browsers:Chrome, Edge, Firefox, Opera, Safari Responsive:no Dependencies:-
Author Jorge Mendes June 3, 2020 Links Just Get The Demo Link How To Download - Article How To Download - Video Made with HTML / CSS About a code GRAPH Compatible browsers:Chrome, Edge, Firefox, Opera, Safari Responsive:no Dependencies:-
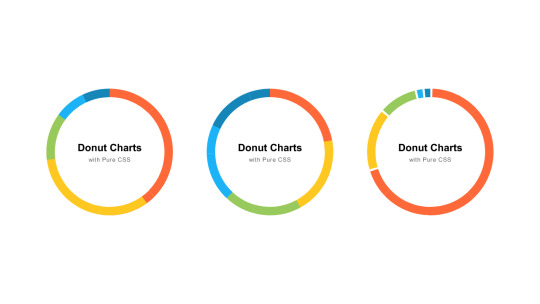
Author Jerry Low April 20, 2020 Links Just Get The Demo Link How To Download - Article How To Download - Video Made with HTML (Slim) / CSS (SCSS) About a code PURE CSS DONUT CHARTS Compatible browsers:Chrome, Edge, Firefox, Opera, Safari Responsive:no Dependencies:-
Author Ana Tudor May 21, 2019 Links Just Get The Demo Link How To Download - Article How To Download - Video Made with HTML (Pug) / CSS (SCSS) About a code PURE CSS BACKGROUND DEPENDING ON HEIGHT Compatible browsers:Chrome, Edge, Firefox, Opera, Safari Responsive:no Dependencies:-
Author sean_codes April 17, 2019 Links Just Get The Demo Link How To Download - Article How To Download - Video Made with HTML (Pug) / CSS (SCSS) About a code HTML CHART Compatible browsers:Chrome, Edge, Firefox, Opera, Safari Responsive:no Dependencies:-
Author Bence Szabo April 13, 2019 Links Just Get The Demo Link How To Download - Article How To Download - Video Made with HTML / CSS About a code THIS PEN IS 19% HTML & 81% CSS Compatible browsers:Chrome, Edge, Firefox, Opera, Safari Responsive:yes Dependencies:-
Author Anjanas_dh January 29, 2019 Links Just Get The Demo Link How To Download - Article How To Download - Video Made with HTML / CSS (SCSS) About a code PURPLE PIE CHART Compatible browsers:Chrome, Edge, Firefox, Opera, Safari Responsive:no Dependencies:- Author Sabine Robart January 13, 2019 Links Just Get The Demo Link How To Download - Article How To Download - Video Made with HTML / CSS (SCSS) About a code STATISTICS CARD Compatible browsers:Chrome, Edge, Firefox, Opera, Safari Responsive:no Dependencies:- Author Olivia Ng October 29, 2018 Links Just Get The Demo Link How To Download - Article How To Download - Video Made with HTML (Pug) / CSS (SCSS) / JS About a code CSS ANIMATION: A LINE GRAPH Compatible browsers:Chrome, Edge, Firefox, Opera, Safari Responsive:no Dependencies:simple-line-icons.css, jquery.js Author Ana Tudor July 4, 2018 Links Just Get The Demo Link How To Download - Article How To Download - Video Made with HTML (Pug) / CSS (SCSS) About a code INTERACTIVE, RESPONSIVE PIE CHART Compatible browsers:Chrome, Edge, Firefox, Opera, Safari Responsive:yes Dependencies:-
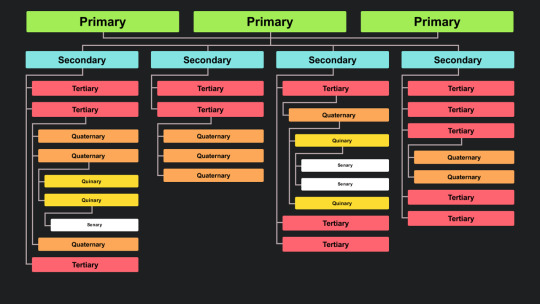
Author Erin E. Sullivan July 18, 2017 Links Just Get The Demo Link How To Download - Article How To Download - Video Made with HTML / CSS About a code SIMPLE AND RESPONSIVE ORGANIZATIONAL CHART Compatible browsers:Chrome, Edge, Firefox, Opera, Safari Responsive:yes Dependencies:-
Author Champlow July 13, 2017 Links Just Get The Demo Link How To Download - Article How To Download - Video Made with HTML / CSS (Less) About a code BAR GRAPH Compatible browsers:Chrome, Edge, Firefox, Opera, Safari Responsive:no Dependencies:-
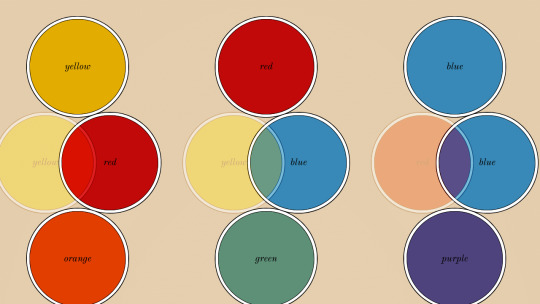
Author Chen Hui Jing February 24, 2017 Links Just Get The Demo Link How To Download - Article How To Download - Video Made with HTML / CSS (SCSS) About a code CHARLES HAYTER'S COLOUR DIAGRAMS Compatible browsers:Chrome, Edge, Firefox, Opera, Safari Responsive:yes Dependencies:- Author Nick Walsh February 14, 2017 Links Just Get The Demo Link How To Download - Article How To Download - Video Made with HTML / CSS (Sass) Read the full article
0 notes
Text
How to use JavaScript for data visualization
Data visualization is the process of transforming data into graphical or visual representations, such as charts, graphs, maps, etc. Data visualization can help us understand, analyze, and communicate data more effectively and efficiently.
JavaScript is a powerful and popular programming language that can be used for creating dynamic and interactive data visualizations in web browsers. JavaScript can manipulate the HTML and CSS elements of a web page, as well as fetch data from external sources, such as APIs, databases, or files.
To use JavaScript for data visualization, we need to learn how to:
Select and manipulate HTML elements: We can use JavaScript to select HTML elements by their id, class, tag name, attribute, or CSS selector. We can use methods such as getElementById(), getElementsByClassName(), getElementsByTagName(), querySelector(), or querySelectorAll() to return one or more elements. We can then use properties and methods such as innerHTML, style, setAttribute(), removeAttribute(), appendChild(), removeChild(), etc. to manipulate the selected elements.
Create and modify SVG elements: SVG (Scalable Vector Graphics) is a standard for creating vector graphics in XML format. SVG elements can be scaled without losing quality, and can be styled and animated with CSS and JavaScript. We can use JavaScript to create and modify SVG elements, such as , , , , , etc. We can use methods such as createElementNS(), setAttributeNS(), appendChild(), etc. to manipulate the SVG elements.
Handle events: We can use JavaScript to handle events that occur on the web page, such as mouse clicks, keyboard presses, window resizing, page loading, etc. We can use methods such as addEventListener() or removeEventListener() to attach or detach event handlers to elements. We can also use properties such as onclick, onkeyup, onload, etc. to assign event handlers to elements. An event handler is a function that runs when an event occurs. We can use the event object to access information about the event, such as its type, target, coordinates, key code, etc.
Use AJAX: We can use AJAX (Asynchronous JavaScript and XML) to send and receive data from a server without reloading the web page. We can use objects such as XMLHttpRequest or Fetch API to create and send requests to a server. We can also use methods such as open(), send(), then(), catch(), etc. to specify the request parameters, send the request, and handle the response. We can use properties such as readyState, status, responseText, responseJSON, etc. to access the state, status, and data of the response.
These are some of the basic skills we need to use JavaScript for data visualization. However, writing JavaScript code from scratch for data visualization can be challenging and time-consuming. That’s why many developers use JavaScript libraries and frameworks that provide pre-written code and templates for creating various types of data visualizations.
Some of the most popular JavaScript libraries and frameworks for data visualization are:
D3.js: D3.js (short for Data-Driven Documents) is a JavaScript library for producing dynamic and interactive data visualizations in web browsers. It makes use of SVG, HTML5, and CSS standards. D3.js allows us to bind data to DOM elements, apply data-driven transformations to them, and create custom visualizations with unparalleled flexibility1.
Chart.js: Chart.js is a JavaScript library for creating simple and responsive charts in web browsers. It uses HTML5 canvas element to render the charts. Chart.js supports various types of charts, such as line, bar, pie, doughnut, radar, polar area, bubble, scatter, etc.2
Highcharts: Highcharts is a JavaScript library for creating interactive and high-quality charts in web browsers. It supports SVG and canvas rendering modes. Highcharts supports various types of charts, such as line, spline, area, column, bar, pie, scatter, bubble, gauge, heatmap, treemap, etc. Highcharts also provides features such as zooming, panning, exporting, annotations, drilldowns, etc.
These are some of the popular JavaScript libraries and frameworks for data visualization. To use them in your web development project, you need to follow these steps:
Choose the right library or framework for your project: Depending on your project’s requirements, goals, and preferences, you need to select the most suitable library or framework that can help you create the data visualizations you want. You should consider factors such as the learning curve, documentation, community support, performance, compatibility, scalability, etc. of each library or framework before making a decision.
Add the library or framework to your web page: You can add a library or framework to your web page using either a script tag or an external file. The script tag can be placed either in the head or the body section of the HTML document. The external file can be linked to the HTML document using the src attribute of the script tag.
Learn how to use the library or framework features and functionalities: You need to read the documentation and guides of the library or framework you are using to understand how to use its features and functionalities effectively. You should also follow some tutorials and examples to get familiar with the syntax, conventions, patterns, and best practices of the library or framework.
Write your application code using the library or framework: You need to write your application code using the library or framework functions, methods, objects, components, etc. You should also test and debug your code regularly to ensure its functionality and quality.
These are some of the ways you can use JavaScript for data visualization. To learn more about JavaScript and data visualization, you can visit some of the online resources that offer tutorials, examples, exercises, and quizzes. Some of them are:
[W3Schools]: A website that provides free web development tutorials and references for HTML, CSS, JavaScript, and other web technologies.
[MDN Web Docs]: A website that provides documentation and guides for web developers, covering topics such as HTML, CSS, JavaScript, Web APIs, and more.
[Data Visualization with D3.js]: A website that provides a comprehensive course on data visualization with D3.js.
[e-Tutitions]: A website that provides online courses and for web , development, Learn JavaScript and you can book a free demo class.
[Codecademy]: A website that provides interactive online courses and projects for various programming languages and technologies.
0 notes
Text
Data Visualization in Frontend Development: Creating Interactive Charts and Graphs

Introduction
In the dynamic world of front-end development, data visualization plays a pivotal role in transforming complex information into intuitive and interactive charts and graphs. With businesses and users demanding richer experiences, front-end developers embrace innovative data presentation methods. In this blog, we'll explore the significance of data visualization in frontend development, understand its impact on frontend development services, and how frontend development companies leverage it to create engaging and user-friendly interfaces. Join us on this exciting journey into the realm of interactive charts and graphs!
Basics of Data Visualization
Data Types:
Categorical: Data that represent distinct categories or groups.
Numerical: Data with continuous or discrete numerical values.
Ordinal: Data with a predefined order or ranking.
Choosing Chart Types:
Categorical data: Bar charts (vertical/horizontal), stacked bar charts.
Numerical data: Line charts, scatter plots, histograms.
Ordinal data: Dot plots, ranked bar charts.
Popular Chart Types:
Bar charts: Visualize categorical data using bars of different lengths.
Line charts: Display trends and relationships between numerical data points.
Pie charts: Show proportions of different categories as a whole.
Tools and Libraries for Data Visualization
Frontend Libraries:
D3.js: Powerful library for creating interactive visualizations using HTML, SVG, and CSS.
Chart.js: User-friendly library with a variety of chart types and easy setup.
Comparison of Different Tools:
D3.js: Offers high customization but requires more coding skills.
Chart.js: Quick to implement with less coding required but may have limited customization options.
Selecting the Right Tool:
For complex, interactive visualizations, consider D3.js if you have front-end development expertise.
For simpler visualizations and faster implementation, choose Chart.js for efficient front-end development services.
Data Preparation and Formatting
Cleaning and processing data is essential to ensure accuracy and meaningful insights before visualising it.
Data cleaning involves removing errors, duplicates, and inconsistencies in the dataset.
Processing data includes transforming, reshaping, and aggregating it for better analysis.
Dealing with missing values requires imputing them with appropriate techniques or removing the affected records.
Outliers, which are extreme values, need to be handled by either adjusting them or considering them separately.
Transforming data into a suitable format for charts and graphs involves organizing it into columns, rows, or categories.
The data is converted into a compatible format, such as CSV or JSON, for visualization tools.
Creating Interactive Charts
Interactive charts provide enhanced user experiences and allow users to explore data interactively.
Adding tooltips, hover effects, and click events to charts can display additional information when users interact with specific elements.
Tooltips provide contextual information when hovering over data points, helping users understand the data better.
Hover effects highlight or change the appearance of chart elements to provide visual feedback when interacting with them.
Click events enable users to drill down into detailed data or navigate to related content.
Implementing interactive filters and data controls allows users to modify the chart's displayed data dynamically.
Filters enable users to select specific data subsets based on predefined or custom criteria.
Data controls, such as sliders or dropdown menus, provide a convenient way for users to interact with data parameters.
Frontend development company offer services to create visually appealing and interactive charts that meet specific business requirements.
These companies specialize in implementing front-end technologies and frameworks to create seamless and engaging user interfaces for data visualization.
Customizing Visualizations
Styling charts to match website design and branding enhances visual appeal and user experience.
CSS (Cascading Style Sheets) and SVG (Scalable Vector Graphics) are powerful tools for customizing chart appearance.
Using CSS, you can control colours, fonts, and layout to align with your front-end development company's branding.
SVG allows for scalable and resolution-independent graphics, ensuring crisp visuals on any screen.
Accessibility in Data Visualization
Accessibility is crucial for front-end development services to cater to all users, including those with disabilities.
Implement proper labels and alternative text (alt text) for charts and visual elements.
Alt text provides descriptions of images, making them understandable for screen readers.
Test visualizations for accessibility compliance using tools like Lighthouse or Wave.
Performance Optimization
Performance optimization is a crucial aspect of front-end development. It ensures that websites and applications run smoothly, providing a seamless user experience. Here are some techniques to improve chart rendering performance and handle real-time data updates efficiently:
Chart Rendering Performance:
Implement data caching: Store pre-rendered charts to reduce processing time.
Use optimized chart libraries: Choose high-quality and efficient rendering libraries.
Minimize DOM manipulation: Limit the number of redraws and updates to the chart's DOM elements.
Enable hardware acceleration: Utilize the GPU to accelerate rendering, especially for complex charts.
Implement data pagination: Load and render data in chunks to avoid overwhelming the browser.
Lazy Loading of Data:
Load data on demand: Fetch data only when needed, particularly for large datasets.
Implement infinite scrolling: Load additional data as users scroll down instead of loading everything upfront.
Handling Real-time Data Updates:
Use efficient data update algorithms: Optimize updating chart data to minimize computation.
Implement data streaming: Receive and process real-time data updates incrementally, reducing the load on the front end.
Utilize web sockets: Establish a persistent connection for real-time data transfer, avoiding frequent HTTP requests.
By employing these techniques, front-end development companies can significantly enhance performance and provide efficient front-end development services.
Conclusion
In conclusion, data visualization has emerged as an essential aspect of front-end development. It empowers front-end development companies to craft visually appealing, user-friendly interfaces that convey information effectively. By embracing interactive charts and graphs, front-end developers can elevate the overall user experience, making data more accessible and engaging for everyone. As businesses continue to emphasize data-driven decision-making, mastering the art of data visualization will be a crucial skill for front-end developers. So, let's embrace the power of data visualization and unlock a world of creativity and innovation in the front-end development domain.
0 notes
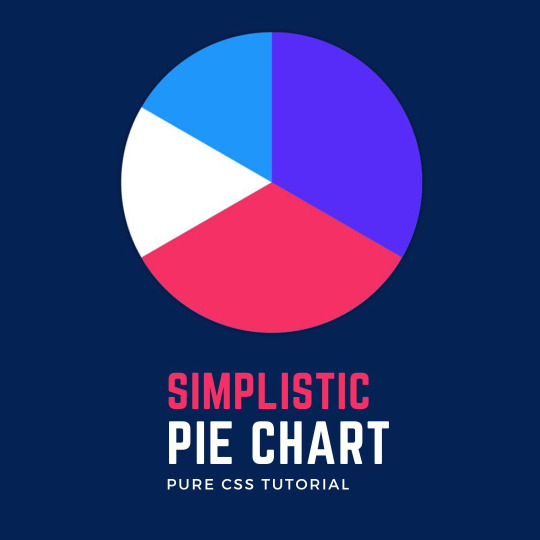
Photo

🔴 Create PIE Chart using only HTML & CSS | Radial Gradient ☞ https://bit.ly/2PFsqQ5 #html #css #javascript
6 notes
·
View notes
Link
0 notes
Photo
CSS Pie Chart
#css pie chart#pie chart html css#how to make pie chart#css tricks#html css tutorial#CSS Tutorial for beginner#css tutorial#codenewbies#learn css#learn to code#code#100daysofcode
0 notes
Text
React dist unpkg

#React dist unpkg how to#
#React dist unpkg install#
#React dist unpkg code#
#React dist unpkg code#
To lint your code, run the tests, and create code coverage reports: npm run full-test Requirementsreact-vis makes use of ES6 array methods such as.
#React dist unpkg install#
DevelopmentTo develop on this component, install the dependencies and then build and watch the static files: npm install & npm run startOnce complete, you can view the component's example in your browser (will open automatically).Īny changes you make to the example code will run the compiler to build the files again. Sunbursts about making sunburst diagrams. Parallel Coordinates about making parallel coordinate charts.
#React dist unpkg how to#
Scales and Data about how the attributes can be adjusted.Īnimations about how to tweak animations in the library. #4 More informationTake a look at the folder with examples or check out some docs: The global reactVis object will now be available for you to play around. If you're working in a non-node environment, you can also directly include the bundle and compiled style using basic html tags. … and add the following code to your render function: Import the necessary components from the library. Here's an example of importing only the legends "~react-vis/dist/styles/legends" This helps minimize the size of the outputted CSS. You can also select only the styles you want to use. npm install react-vis -saveInclude the built main CSS file in your HTML page or via "~react-vis/dist/style" react-vis supports the React's lifecycle and doesn't create unnecessary nodes. The library provides a set of defaults which can be overridden by the custom user's settings. This provides a high level of control of chart layout for applications that need it. For instance, separate X and Y axis components. react-vis provides a set of basic building blocks for different charts. react-vis doesn't require any deep knowledge of data visualization libraries to start building your first visualizations. This project initially started as a mozilla-services project.OverviewA collection of react components to render common data visualization charts, such as line/area/bar charts, heat maps, scatterplots, contour plots, hexagon heatmaps, pie and donut charts, sunbursts, radar charts, parallel coordinates, and tree maps. Title: Ĭonst log = (type) => (console, type) įor more information on what themes we support, see Using Themes. You'll also need to alias the default export property to use the Form component: const Form = fault Note: The CDN version does not embed react or react-dom. You can also install react-jsonschema-form (the 1.x version) which works with React 15+. Then import the dependency as follows: import Form from latest version requires React 16+. Installation ¶įirst install the dependency from npm: $ npm install -save React-jsonschema-form also comes with tools such as uiSchema and other form props to customize the look and feel of the form beyond the default themes. If you have a priori knowledge of your data and want a toolkit for generating forms for it, you might look elsewhere. If you want to generate a form for any data, sight unseen, simply given a JSON schema, react-jsonschema-form may be for you. React-jsonschema-form is meant to automatically generate a React form based on a JSON Schema. A simple React component capable of building HTML forms out of a JSON schema.Ī live playground is hosted on GitHub Pages:
0 notes
Text
Beautiful CSS Chart & Graph Framework - Charts.css
Beautiful CSS Chart & Graph Framework – Charts.css
Charts.css is a CSS data visualization framework that turns regular HTML tables into beautiful and customizable charts. Chart Types: Bar Column Area Line Pie How to use it: 1. Install and import the Charts.css framework. # Yarn $ yarn add charts.css # NPM $ npm i charts.css <link rel="stylesheet" href="/path/to/dist/charts.min.css" /> 2. Add the charts-css to your HTML table and specify the…
View On WordPress
0 notes
Text
Popular Data Visualization Tools
Survey is done for various reasons such as doing market research, customer satisfaction and to get the idea of future market trends. There are good number of data visualization tools in market that you can use in Visualizing survey data. But you may get confused when you see many data visualization tools so we have highlighted 3 Popular data visualization tools.
Tableau (and Tableau Public)
Tableau is considered the number one data visualization tool and it has many options available such as desktop app, server and hosted online versions, and a free public option. There are 100+ data import options you can try, from text files such as Excel, CSV files to Google Ads, survey software and to Salesforce data.
There are multiple chart formats as well as mapping capability through which you can output your survey data. That means you can also make color-coded maps which will showcase geographically important data in such a format which is much easier and faster to gain insights.
You can use the public version of Tableau totally free.
Pros
· More than 100+ data import options
· Mapping capability
· Free public version available
· Lots of video tutorials and articles to teach you how to use Tableau
Cons
· Non-free versions are expensive for you if you are a student or small business owner($70/month/user for the Tableau Creator software)
· Problem of public version is you can’t keep data analyses private
Infogram
Infogram is one of the popular survey data visualization tool. Its main feature is you can make visualization by doing drag-and-drop. So as a beginner, you can create awesome and cool visualizations of data for marketing reports, infographics, social media posts, maps, dashboards, and more.
You can export finished visualizations into a number of formats such as PNG, .JPG, .GIF, .PDF, and .HTML. Even interactive visualizations are also possible; you can also embed into websites or apps. Infogram also has a WordPress plugin that makes embedding visualizations even easier for WordPress users so you don’t need to code anything.
Pros
· Tiered pricing, including a free plan with basic features
· It has 35+ chart types and 550+ map types
· Drag and drop feature
· Use API for connecting additional data sources
Cons
· Significantly fewer built-in data sources compared to other apps
Google Charts
Google Charts is another powerful and free data visualization tool that you can use for making interactive charts and also for embedding online. It works perfectly with dynamic data and the outputs are based on HTML5 and SVG, so without the use of any additional plugins they work in any browser. Data sources include Google Spreadsheets, Google Fusion Tables, Salesforce, and other SQL databases.
There are a variety of chart types, including maps, scatter charts, column and bar charts, histograms, area charts, pie charts, treemaps, timelines, gauges, and many others. These charts can be customized completely, via simple CSS editing.
Pros
· It’s totally Free
· Good collection of chart formats available
· Cross-browser compatible since it uses HTML5/SVG
· You can work with dynamic data
Cons
· Beyond the tutorials and forum available, there’s limited support
Article Source: data visualization tools
0 notes
Text
Chart JS, the complete guide. ChartJS missing manual

Description
Chart JS the missing manual! ===================================================================== Course is made in the version Chart JS 2.7.2 New videos are used with version Chart JS 2.7.3 ===================================================================== Why Should you take this course? Let me explain my personal story. When I started to learn Chart JS it was a real challenge. Creating charts was already hard, however understanding the documentation was the biggest structure. I could not belief how complicated the documentation was. I felt it was written by expert developers that assume you knew how to already code in Chart JS. Just look at the documentation and a lot is missing out. I remembered when I finally was able to get a chart on the page. I felt like I won the jackpot. Finally it worked but I quickly realize that what I really wanted was create charts that are directly connected with my database. And nothing about that single topic is found anywhere. Because of this struggle I decided to create this wonderfully detailed course. This is what I coined as the Chart JS missing manual. Why? Because it covers so much in detail en topics not being shown in Chart JS documentation. This course is what I would say the course I wished I had before starting out. It would save a lot of time and could get me up to speed fast. ===================================================================== How you learn in this Chart JS course? ===================================================================== In this course I will take you from absolute beginner in Chart JS to a professional Chart JS developer. You will be following along with the codes but there is more. You will get challenging questions about Chart JS. You will be tested with some challenges in Chart JS and see if you can complete them on time. You will get problem cases that forces you to think and debug the problems in the chart. ========================================================================== What can you expect from this course? ========================================================================== You will be able to create charts guaranteed! This course is very easy to follow as we are doing step by step. More complicated items will even be discussed line by line. You will create: Line chart with Chart JS Bar chart with Chart JS Stacked bar chart with Chart JS Horizontal bar chart with Chart JS Radar chart with Chart JS Polar chart with Chart JS Pie chart with Chart JS Doughnut chart with Chart JS Gauge Chart with Chart JS (YES we can make them as well with minor tweaks!) Bubble chart with Chart JS Scatter chart with Chart JS Create Chart Titles Combo Bar Line Chart Customize Chart Legends Customize Chart Tooltips Chart JS Color management / Gradient / Chart Colors based on color Drill Down Charts / Clickable Charts Chart JS with Database MYSQL PHP Dynamic charts with AJAX update and input forms You will learn how to make each of these charts and I will be updating these sections every once and a while. ChartJS is developing quickly with many new features and charts. This course will be your absolute reference course for making every possible chart with Chart JS. And you will be solving some challenging problems to see if you are really a PRO in Chart JS! Some of them are really hard but once you master that you are very skilled to make all kind of charts with Chart JS! ========================================================================== “What Version is this course made?” In this entire course you will learn codes in the version Chart JS 2.7.2. New videos are created in latest version Chart JS 2.7.3. ========================================================================== “What is the most exciting part of this course?” My obsession of having real dynamic charts from a database. It is one of the best skills that you must know. It is discussed here in depth. ========================================================================== “Do you update the course with new items” Yes weekly new items appear and currently this course is being hugely extended! ========================================================================== 3 Reason why you will love this course! ========================================================================== You will truly learn how to make a chart for the web in a easy step to step follow guide. It is in bite size steps which makes it easy to follow even if you are completely new to HTML, CSS and JavaScript. This course will always be updated with the latest ChartJS development, there are far more charts than those. This course will be you absolute reference sheet for ChartJS. It covers the most important aspects of Chart JS library and makes sure you are ready to start using it to build chart. ========================================================================== The main objective of this course ========================================================================== Make Chart JS accessible for everyone who wants to learn it. At the end of this course you MUST and WILL be confident that you can create any chart with Chart JS with ease. ========================================================================== Let’s go and start make those Charts! ========================================================================== It is time to dive in! Start and create your charts for the web! Join this course and make the web a more chart friendly place! Read the full article
0 notes
Photo

18+ JavaScript Libraries for Creating Beautiful Charts
It’s practically impossible to imagine any dashboard without graphs and charts. They present complex statistics quickly and effectively. Additionally, a good graph also enhances the overall design of your website.
In this article, I’ll show you some of the best JavaScript libraries for graphs / charts. These libraries will help you create beautiful and customisable charts for your future projects.
While most of the libraries are free and open source, some of them provide a paid version with additional features.
D3.js — Data-Driven Documents
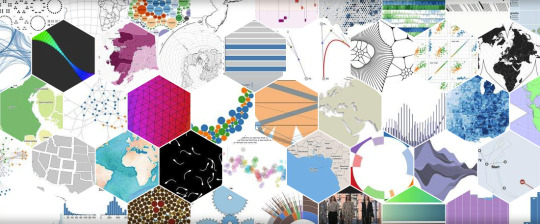
When we think of charting today, D3.js is the first name that comes up. Being an open source project, D3.js definitely brings many powerful features that were missing in most of the existing libraries. Features like "Enter and Exit", powerful transitions and syntax familiarity with jQuery or Prototype make it one the best JavaScript libraries for charting. Charts in D3.js are rendered via HTML, SVG and CSS.
Unlike many other JavaScript libraries, D3.js doesn't ship with any pre-built charts out of the box. However, you can look at the list of graphs built with D3.js to get an overview.
D3.js doesn't work well with older browsers like IE8. You can always use plugins like aight plugin for cross browser compatibility.
Websites like NYTimes, Uber and Weather.com have used D3.js extensively in the past.
Google Charts
Google Charts is my go-to JavaScript library for creating charts easily. It provides many pre-built charts like area charts, bar charts, calendar charts, pie Charts, geo charts, and more.
Google charts also comes with various customization options that help in changing the look of the graph. Charts are rendered using HTML5/SVG to provide cross-browser compatibility and cross platform portability to iPhones, iPads, and Android. It also includes VML for supporting older IE versions.
Here's a great list of examples built using Google charts.
ChartJS
ChartJS provides beautiful flat designs for charts. It uses HTML5 canvas element for rendering. Support for older browsers like IE7/8 is added through polyfill.
ChartJS charts are responsive by default. They work well in mobiles and tablets. With 6 different types of core charts out of the box (core, bar, doughnut, radar, line, and polar area), ChartJS is definitely one of the most impressive open source charting libraries in recent times.
Chartist.js
Chartist.js provides beautiful responsive charts. Just like ChartJS, Chartist.js is also the product of the community that was frustrated by using highly priced JavaScript charting libraries. It uses SVG to render the charts. It can be controlled and customised through CSS3 media queries and Sass. Also, note that Chartist.js provides cool animations that will work only in modern browsers.
n3-charts
If you are an Angular developer, you will definitely find n3-charts extremely useful and interesting. n3-charts is built on top of D3.js and Angular. It provides various standard charts in the form of customisable Angular directives.
Checkout list of charts built using ns-charts.
Ember Charts
Ember Charts is another great open source repository built with D3.js and Ember.js. It provides time series, bar, pie, and scatter charts that are easily customisable. It uses SVG to render charts.
The post 18+ JavaScript Libraries for Creating Beautiful Charts appeared first on SitePoint.
by Ivaylo Gerchev via SitePoint http://bit.ly/2W4SYix
0 notes
Text
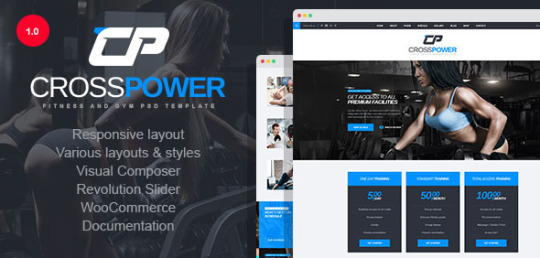
CrossPower - Sport Gym Fitness WordPress Theme
New Post has been published on http://wpelegant.com/crosspower-sport-gym-fitness-wordpress-theme/
CrossPower - Sport Gym Fitness WordPress Theme
CrossPower – Sport Gym Fitness WordPress Theme http://themeforest.net/category/wordpress/retail/health-beauty
CrossPower is our new, modern WordPress Theme, designed specifically for sport websites, gyms, yoga studios, fitness and crossfit clubs.

First and foremost, the Theme features Visual Page Builder Plugins – an incredible tool to create your own, unique web pages. Your website is going to be a total success because we created all the neccessary pages for it. Several blog and gallery options are going to be the best way to show people what you do and share sport transformation stories with them; the shop page will come in handy if you decide to start selling your sport items; the schedule page will help you make sure that your clients are up to date with your club’s timetable and are always in time for the class; the template also features the team page to show the public that your team is the most professional out there.
This theme abounds with widgets and shortcodes. Comes with several options for beardcrumbs and copyright, as well as footers and headers. The template is available in light and dark versions, and boxed or wide layout variations. Features fonts from Google Fonts library and Font Awesome icons. The code of the theme is well formatted and commented. Powered by Twitter Bootstrap v3 this template is going to give you the best user experince!
This template is surely going to make your sport business thrive! Just give it a try and see for yourself! In case anything goes wrong our support team is always ready to back you up!
Use Visual Builder Plugins to create your own unique pages!

Main video presentation sections:


Visual Builder
You can now use Visual Builder to create singlepage or multipage websites with no coding!
Main Visual Builder features:
Drag’n’drop layout building and editing.
Easy to create multipage and single page sites.
Creating other pages based on existing saved page.
Inline content editing.
Easy-to-edit and customize predefined building blocks.
Highlighted HTML source code editing.
Project import and export.
Drag’n’drop images upload.
Easy page preview.
Creating ZIP archive with all files needed for uploading onto production server.
Webserver is not necessary.
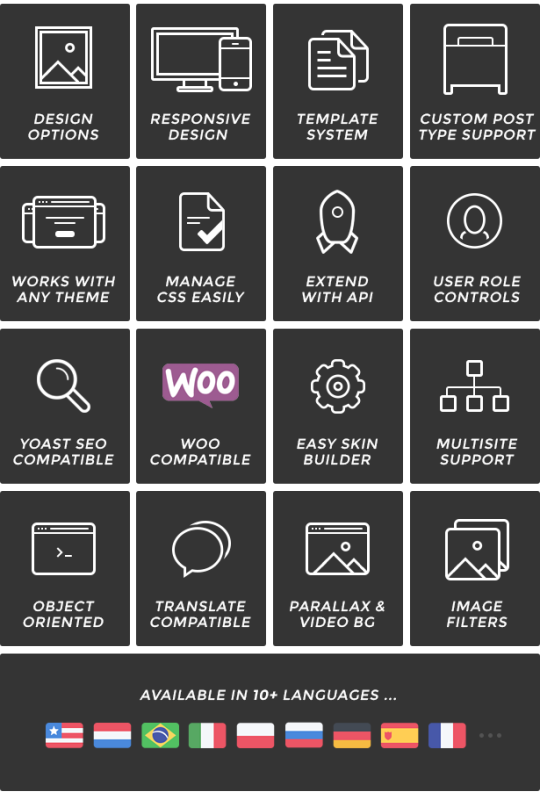
Theme Features
Features List
Redux FrameWork based
Clean and Valid Code
Fully Responsive
Boxed and Wide Layouts
Light and Dark versions
Parallax Sections
Animate everything you want
Extreamly Customizable
Free Fonts and Icons
Tones of Shortcodes
Well Documented
Working PHP Scripts and Widgets included:
Flickr Widget
MailChimp Subscribe Form
Twitter Widget
Contact Form
Search
Clean and Valid Code
And much more
What You Get
WordPress Theme, CSS, JS & PHP files
Sample data files
Working PHP scripts
Free Icon Fonts
Good documentation
Credits ans Sources
As we mentioned earlier, we used Twitter Bootstrap v3 as CSS framework and HTML5 Boilerplate for this template.
Fonts:
http://www.google.com/fonts/ – Google WebFonts
http://www.socicon.com/ – Social Icons Font
http://fontawesome.io/ – Font Awesome
http://icomoon.io/ – teaser rt-icons font
Theme feature
modernizr-2.6.2.min.js detecting browsers features.
jquery-2.2.4.min.js is a popular JavaScript library.
bootstrap.min.js is a stantard Twitter Bootstrap library.
respond.min.js is required for Twitter Bootstrap v3 work in older browsers.
html5shiv.min.js adds HTML5 compatibility for older browsers.
superfish.js is a script that enables dropdown menu.
hoverIntent.js is a component for superfish menu.
jquery.flexslider-min.js is a jQuery plugin for main and bottom sliders.
jquery.isotope.min.js is a jQuery plugin for filtrable gallery.
jquery.prettyPhoto.js is a jQuery plugin for displaying lightbox content.
jquery.ui.totop.js is a jQuery plugin for toTop button.
jquery.easing.1.3.js is a jQuery plugin for different types of animation
jquery.scrollTo-min.js and jquery.localscroll-min.js needed for smooth single page navigation.
jquery.easypiechart.min.js is a jQuery plugin that uses the canvas element to render simple pie charts for single values.
jquery.jflickrfeed.min.js plugin makes it easy to pull Flickr feeds and display them on your site.
jquery.tweet.min.js plugin enables twitter widget on your site.
owl.carousel.min.js is a jQuery carousel plugin for “partners” section
jquery.bxslider.min.js is a jQuery slider plugin
jquery.nicescroll.min.js is a plugin used to replace browsers standard scroll bar
jquery.fractionslider.min.js is a great slider plugin for main slider
jquery.parallax-1.1.3.js is used for parallax backgrounds.
jquery.appear.js is used to find out if HTML element is inside browser viewport
jquery.countTo.js is used for teasers with counter
jquery.cookie.js is used for store cookies information in theme
Visual Builder scripts
jquery-ui.min.js is a popular UI library for jQuery
jquery.scrollbar.min.js is a jQuery plugin for custom scrollbar
tinymce.min.js is a popular WYSIWYG editor
dropzone.js is drag’n’drop file upload library
bootstrap-select.min.js is s custom select for Twitter Bootstrap using button dropdown
angular.min.js is a powerfull Google javascript framework
angular-bootstrap-select.js is a Angular module for select input elements
angular-dropzone.js is a module for Angular to work with Dropzone lib
angular-sanitize.min.js is a module for Angular to sanitize HTML code
angular.ngStorage.min.js is a module for Angular to work with browser Local Storage
Images
depositphotos.com
danielezedda.com
foodiesfeed.com
gratisography.com
magdeleine.co
picjumbo.com
picography.co
unsplash.com
freepsdfiles.net
free-logo-design.net
NOTE: The images used in the theme are not included in the main download file, they are only for the preview purpose.
You can find a list of used images in template documentation.
30
Check WordPress Theme
0 notes