#httpmethods
Explore tagged Tumblr posts
Visit Tumblr Blog
Explore Tumblr blogs with no restrictions, modern design and the best experience.
Last Seen Tumblr Blogs


Fun Fact
In 2020, 44% of users from Denmark used Tumblr daily.
Text
youtube
0 notes
Text
#codeonedigest#httpmethods#httpverbs#httpresponsecodes#springboot#springframework#intellij#postman#java
0 notes
Text
Cypress testing - a swift, less hassle and awesome tests!
What is it about:
A little bit about Cypress.io. This is a new javascript end-to-end testing tool. Its fast, easy and awesome. For more details, please have a look on their website Cypress.io As a testing professional, I would like to briefly explain how I am going to use this tool and write simple tests. The first thing I have done is, I have downloaded and install cypress from their website. I have already installed npm-node.js in my system. Before jumping into cypress, knowledge of javascript, jquery is highly desirable.
cd /your/project/path
npm install cypress --save-dev
see here for original cypress installation steps >> installation step
Please set the following under settings>configuration if you want the test runner to run the test immediately after making changes.
watchForFileChanges: true
System configuration :
Windows 8.1 Pro, i5 3.10 GHz processor, 8GB RAM, 128 GB SSD drive
Writing my own very simple cypress tests:
Let us do some more groundwork before writing the tests. Install a js editor of your choice. I have used Atom.js editor for creating the tests. Ensure you have cypress.json file in the project root folder. Then navigate to integration/examples folder or create a folder of your choice. Open the created folder from the js editor. Now create a test_spec.js file or you give an appropriate name of the file with extension .js and save under that location.
Let’s start:
1) First Test- is to compare very simple input values as below, write the below test in the test_spec.js file and save. Click on the ' test_spec.js' it will open a browser and start running the test and see the test result got passed
describe('Compare two input values', function() { it('Test to compare two inputs values', function() { var first_input =100; var second_input = 100; expect(first_input).to.equal(second_input) cy.log(first_input + second_input) }) })

2)Now we will test the selection of a 'checkbox' and verify the display of a message after selection:
describe('Checkbox Selection test', function() { it('Check if the checkbox is selected successfully and verify the message', function() { cy.visit('http://www.seleniumeasy.com/test/basic-checkbox-demo.html') cy.get('#isAgeSelected').check() cy.get('#txtAge') .invoke('text') .then(text => { const someText = text; cy.log(someText); expect(someText).to.contain('Success - Check box is checked') }); }) })

3) How to test an 'api' and verify values received using cy.request() ?
describe('Verify the Api Get method', function(){ it('Verify the 'userid', id and title is received in response', function(){ cy.request('GET', 'https://jsonplaceholder.typicode.com/posts/42') .then((response) => { // response.body is automatically serialized into JSON expect(response.body).to.have.property('userId', 5) // true expect(response.body).to.have.property('id', 42) // true }) }) })

4) How do we test an 'alert' message and its text using cy.stub ()?
describe('Test an alert and the text displaying', function() { it('Verify alert and its text content', function(){ cy.visit('http://www.seleniumeasy.com/test/javascript-alert-box-demo.html') const stub = cy.stub() cy.on ('window:alert', stub) cy .get('button').contains('Click me!').click() .then(() => { expect(stub.getCall(0)).to.be.calledWith('I am an alert box!') }) }) })

5) Cypress test using a cy.wrap() and object passed into the wrap method:
describe('Object passed into Wrap method', function() { it('Check if the object passed into Wrap method and call BMI ', function() { const getBMI= (weight, height) => { var weight ; var height ; var hghtintoMtr = height / 100; var squareHght = hghtintoMtr * hghtintoMtr; var bmi = parseFloat(weight/squareHght).toFixed(2) ; return bmi } cy.wrap({ bmi: getBMI }).invoke('bmi', 78, 176).should('eq', '25.18') // true cy.wrap({ bmi: getBMI }).invoke('bmi', 85, 181).should('eq', '25.95') // true }) })

6) Conditional testing using cypress, calling a random js function and check the message.
describe("Conditional testing, check success or fail", () => { it('Verify the success or failure test', function() { const message = myMessage(); if (message == "success"){ expect(message).to.equal("success"); }else { expect(message).to.equal("fail"); } })
})
function myMessage(){ var words = ['success', 'fail']; var word = words[Math.floor(Math.random() * words.length - 1)]; return word; }

7)Using cypress test the ‘toast’ message
describe('Test the toast message', function() { it('Verify the the two toast message', function() { cy.visit('https://www.primefaces.org/primeng/#/toast') cy.get('button[label="Success"]').find('span').contains("Success").click({force:true}) cy.wait(1000) cy.get('div.ui-toast-detail').invoke('text') .then((text)=>{ const toastText = text; expect(toastText).to.equal("Order submitted"); }) cy.wait(1000) cy.get('button[label="Error"]').find('span').contains("Error").click({force:true}) cy.wait(1000) cy.get('.ui-toast-message-content').find('div').find('div').contains("Validation failed").invoke('text') .then((text)=>{ const toastText = text; expect(toastText).to.equal("Validation failed"); }) }) })

8)Cypress test using 'before', route() and XHR post method to check the status 200 received and text:
describe('XHR POST form submission test', () => { before(() => { cy.visit('https://resttesttest.com/') }) it('Verify whether the successfull submits of an XHR POST method on form submission', () => { cy.wait(3000) cy.get('#httpmethod').select('POST') cy.get('#urlvalue').clear() cy.get('#urlvalue').type('https://httpbin.org/post') cy.get('#addprambutton').click() cy.get('.input-medium.fakeinputname:last').type('Sample', {force: true}) cy.get('.input-xlarge.realinputvalue:last').type(' SomeNameHere ', {force: true}) cy.server(); cy.route('POST', '/post').as('paramform') // note that the route needs to match trailing slashes cy.get('#submitajax').click() .wait('@paramform') .its('status').should('equal', 200) .then(() => { cy.get('#statuspre').contains('HTTP 200 OK').should('exist') cy.get('#outputpre').contains('SomeNameHere').should('exist') }) }) })
9) Using cy.request(), cypress test to verify the receive the response status 200
describe('Verify response 200 is received', function(){ it('Check whether the response 200 is received', function(){ cy.request('GET', 'https://jsonplaceholder.typicode.com/posts/42') .then((response) => { expect(response.status).to.eq(200) }) }) })

10)Cypress test using a 'writeFile' method to write json data to a file in the following location:

describe('Write to file and verify data', function(){ it('Check whether the writing to file and verify the json data', function(){ cy.writeFile('/path/to/data.json', {name: 'Apple2', email: '[email protected]'}) .then((user) => { let jsonUser = JSON.parse(user) expect(jsonUser.name).to.equal('Apple2') expect(jsonUser.email).to.equal('[email protected]') }) }) })
2 notes
·
View notes
Video
youtube
ВИДЯЩИЙ | Саша Мисанова | Мистика | Ужасы | Scary Stories | Страшилки | ... Скачать бесплатно весь сборник "Точка опоры" тут - http://sashamisanova.com/ Читай Сашу первым здесь - https://vk.com/s.misanova (вк) https://t.me/sashamisanova (телеграм) Сказать Саше Спасибо можно комментарием под этим видео, либо в ее группах по ссылкам выше, либо купив Саше кофе - https://www.tinkoff.ru/collectmoney/crowd/vilkhovik.aleksandra1/vJfKB41655/?short_link=9bEY1qOWmLR&httpMethod=GET
0 notes
Text
How to Setup Cloudant Backend For ACRA (Application Crash Reports for Android)
How to Setup Cloudant Backend For ACRA (Application Crash Reports for Android)
(No Ratings Yet) Loading...
Tung Dao Xuan, [email protected], is the author of this article and he contributes to RobustTechHouse Blog
What is ACRA?
ACRA stands for Application Crash Reports for Android. This library helps your software send crash reports to a backend of your choice.
The Acralyzer is an open source backend for ACRA reports that is really simple to install. The only server-side requirement is Apache CouchDB. You can host it on your own server or use the free hosting services of Cloudant.
Setup Cloudant backend
Step 1:
Sign up an account with Cloudant
Step 2:
Open Replication tab and fill in the fields as shown below:
Source database (Remote Database tab): http://get.acralyzer.com/distrib-acra-storage
Target database (New Database tab) : acra-<name_of_your_database>
Then, click the Replicate button.
Step 3:
Continue to replicate another:
Source database (Remote Database tab): http://get.acralyzer.com/distrib-acralyzer
Target database (New Database tab) : acralyzer
Then, click the Replicate button.
After that, open the Databases tab, you will see the 2 databases you have replicated.
Step 4:
Open acra-<name_of_your_database> database (in this tutorial is: acra-demo), select the Permissions tab.
Click the Generate API key button and note down Key and Password. You will need them when you integrate ACRA with your Android software.
Remove the Reader permission and add the Writer permission for the key you have just generated.
To confirm your backend is created successfully, go to https://<your_cloudant_account>.cloudant.com/acralyzer/_design/acralyzer/index.html and you will see the result as below figure.
Setup Android code with ACRA.
Step 1:
In build.gradle file, add ACRA library:
compile ‘ch.acra:acra:4.6.2’
Step 2:
In your AndroidManifest.xml file, declare internet permission.
<uses-permission android:name=”android.permission.INTERNET”>
Step 3:
In your class that extends from Application class, update ACRA configuration like this
@ReportsCrashes( formUri = "https://<your_cloudant_account>.cloudant.com/acra-<name_of_your_database>/_design/acra-storage/_update/report", reportType = HttpSender.Type.JSON, httpMethod = HttpSender.Method.POST, formUriBasicAuthLogin = "<your_key_that_is_created_before>", formUriBasicAuthPassword = "<your_password_that_is_created_before >", customReportContent = { ReportField.APP_VERSION_CODE, ReportField.APP_VERSION_NAME, ReportField.ANDROID_VERSION, ReportField.PACKAGE_NAME, ReportField.REPORT_ID, ReportField.BUILD, ReportField.STACK_TRACE, ReportField.DISPLAY, ReportField.TOTAL_MEM_SIZE, ReportField.AVAILABLE_MEM_SIZE }, mode = ReportingInteractionMode.SILENT ) public class <YourClassName> extends Application { @Override public final void onCreate() { super.onCreate(); ACRA.init(this); }
Conclusion
You are done! Run your software and see your crash reports to find out where the problems in your software and fix it.
You can configure report content and use other features. To find out more, check out the links below:
https://github.com/ACRA/acra/wiki/AdvancedUsage
https://github.com/ACRA/acra/wiki/ReportContent
https://github.com/ACRA
http://www.acra.ch/
RobustTechHouse is a leading tech company for mobile app development and ECommerce web design and development. If you are interested to engage RobustTechHouse for your projects, you can contact us here. If you like our articles, you can follow us on our Facebook.
How to Setup Cloudant Backend For ACRA (Application Crash Reports for Android) was originally published on RobustTechHouse - Mobile App Development Singapore
0 notes
Photo
API Gateway 実行ログのCloudWatch出力設定 https://ift.tt/35yD0yO
API Gatewayの実行ログをCloudWatchに記録したい
1. つまずきポイント
2. 実行ログとアクセスログ
3. 実行ログ設定方法 — 3.1. API Gateway用のロール準備 — 3.2. API Gatewayにロールを設定 — 3.3. APIのステージに実行ログ出力を有効化
4. 実行ログサンプル — 4.1. ログレベル=INFO + リクエスト/レスポンスをすべてログ: 無効 — 4.2. ログレベル=INFO + リクエスト/レスポンスをすべてログ: 有効
つまずきポイント
API Gatewayのログは、デフォルトではCloudWatch Logsには記録されません。そして、API Gatewayの設定にログのロールを設定できますが、実はこのロールを設定しただけではCloudWatch Logsにはログは残りません。
実行ログとアクセスログ
API Gatewayのログには、実行ログとアクセスログがあります。以下ドキュメントからの引用です。
今回は、実行ログを設定したいと思います。
CloudWatch での API ログ作成には実行ログ作成とアクセスログ作成の 2 つのタイプがあります。実行ログ作成では、API Gateway は CloudWatch Logs を管理します。このプロセスには、ロググループとログストリームの作成、および呼び出し元のリクエストとレスポンスのログストリームへのレポートが含まれます。記録されたデータには、エラーまたは実行の追跡 (リクエストまたはレスポンスパラメータ値またはペイロードなど)、Lambda オーソライザー (以前のカスタムオーソライザー) が使用するデータ、API キーが必要かどうか、使用量プランが有効かどうかなどの情報が含まれます。
アクセスログの作成では、API 開発者として、API にアクセスしたユーザーと、呼び出し元が API にアクセスした方法を記録します。独自のロググループを作成したり、既存のロググループを選択したりすることができます。これらは、API Gateway で管理することができます。アクセスの詳細を指定するには、$context 変数を選択し、選択した形式で表示し、ロググループを宛先として選択します。各ログの一意性を維持するために、アクセスログ形式に$context.requestIdを含める必要があります。
アクセスログの取得方法は、下記記事を参照ください。アクセスログに送信元IPを記録する方法を紹介しています。
API Gatewayの送信元IPをCloudWatchに記録したいやりたいことAPI Gatewayのログは、デフォルトではCloudWatch Logsには記録されません。そして、API Gatewayの設定にログのロールを設定できますが、実はこのロールを設定しただけではCloudWatch Logsにはログは残りま... API Gateway アクセスログ設定 | Oji-Cloud - Oji-Cloud
実行ログ設定方法
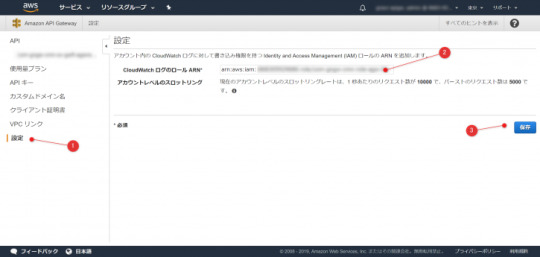
API Gateway用のロール準備
IAMにて、API Gateway用のロールを準備します。このロールにはCloudWatch Logsにログを記録するためのポリシー(AmazonAPIGatewayPushToCloudWatchLogs)を割り当てます。このポリシーが割り当てられていないとログは何も記録されません。
上記で作成したロールのARN を忘れずにコピーします。
API Gatewayにロールを設定
API Gatewayの設定に、先ほどコピーしたロールのARN を貼り付け保存します。この設定はリージョン内のAPI Gateway全体に適用されます。
APIのステージに実行ログ出力を有効化
各APIのステージにて、ログ出力を有効化します。設定のポイントは下記の通り。今回はリクエスト、レスポンスの内容を把握したかったため、「リクエスト/レスポンスをすべてログ」も有効としました。
CloudWatch ログを有効化 ⇒ 必須
ログレベル ⇒ ERROR or INFOを選択
リクエスト/レスポンスをすべてログ ⇒ 必要に応じて有効

実行ログサンプル
ログレベル=INFO + リクエスト/レスポンスをすべてログ: 無効
実行ログ(ログレベル=INFO + リクエスト/レスポンスをすべてログ: 無効)のサンプルです。
2019-07-12T07:07:00.604Z (xxxxxxxx-xxxx-xxxx-xxxx-xxxxxxxxxxxx) Extended Request Id: aaaaaaaaaaaaaaa= 2019-07-12T07:07:00.604Z (xxxxxxxx-xxxx-xxxx-xxxx-xxxxxxxxxxxx) Verifying Usage Plan for request: xxxxxxxx-xxxx-xxxx-xxxx-xxxxxxxxxxxx. API Key: **********************************apiKey API Stage: abcdefghij/prod 2019-07-12T07:07:00.608Z (xxxxxxxx-xxxx-xxxx-xxxx-xxxxxxxxxxxx) Usage Plan check succeeded for API Key **********************************apiKey and API Stage abcdefghij/prod 2019-07-12T07:07:00.609Z (xxxxxxxx-xxxx-xxxx-xxxx-xxxxxxxxxxxx) Starting execution for request: xxxxxxxx-xxxx-xxxx-xxxx-xxxxxxxxxxxx 2019-07-12T07:07:00.609Z (xxxxxxxx-xxxx-xxxx-xxxx-xxxxxxxxxxxx) HTTP Method: POST, Resource Path: /test 2019-07-12T07:07:00.609Z (xxxxxxxx-xxxx-xxxx-xxxx-xxxxxxxxxxxx) API Key: **********************************apiKey 2019-07-12T07:07:00.609Z (xxxxxxxx-xxxx-xxxx-xxxx-xxxxxxxxxxxx) API Key ID: zzzzzzzzzz 2019-07-12T07:07:00.997Z (xxxxxxxx-xxxx-xxxx-xxxx-xxxxxxxxxxxx) Successfully completed execution 2019-07-12T07:07:00.997Z (xxxxxxxx-xxxx-xxxx-xxxx-xxxxxxxxxxxx) Method completed with status: 200 2019-07-12T07:07:00.997Z (xxxxxxxx-xxxx-xxxx-xxxx-xxxxxxxxxxxx) AWS Integration Endpoint RequestId : 99999999-9999-9999-9999-999999999999 2019-07-12T07:07:00.997Z (xxxxxxxx-xxxx-xxxx-xxxx-xxxxxxxxxxxx) X-ray Tracing ID : 1-1a111111-222222222222222222222222
ログレベル=INFO + リクエスト/レスポンスをすべてログ: 有効
実行ログ(ログレベル=INFO + リクエスト/レスポンスをすべてログ: 有効)のサンプルです。
2019-07-12T07:22:42.612Z (yyyyyyyy-yyyy-yyyy-yyyy-yyyyyyyyyyyy) Extended Request Id: bbbbbbbbbbbbbbb= 2019-07-12T07:22:42.613Z (yyyyyyyy-yyyy-yyyy-yyyy-yyyyyyyyyyyy) Verifying Usage Plan for request: yyyyyyyy-yyyy-yyyy-yyyy-yyyyyyyyyyyy. API Key: **********************************apiKey API Stage: abcdefghij/prod 2019-07-12T07:22:42.615Z (yyyyyyyy-yyyy-yyyy-yyyy-yyyyyyyyyyyy) Usage Plan check succeeded for API Key **********************************apiKey and API Stage abcdefghij/prod 2019-07-12T07:22:42.615Z (yyyyyyyy-yyyy-yyyy-yyyy-yyyyyyyyyyyy) Starting execution for request: yyyyyyyy-yyyy-yyyy-yyyy-yyyyyyyyyyyy 2019-07-12T07:22:42.615Z (yyyyyyyy-yyyy-yyyy-yyyy-yyyyyyyyyyyy) HTTP Method: POST, Resource Path: /test 2019-07-12T07:22:42.615Z (yyyyyyyy-yyyy-yyyy-yyyy-yyyyyyyyyyyy) API Key: **********************************apiKey 2019-07-12T07:22:42.615Z (yyyyyyyy-yyyy-yyyy-yyyy-yyyyyyyyyyyy) API Key ID: zzzzzzzzzz 2019-07-12T07:22:42.615Z (yyyyyyyy-yyyy-yyyy-yyyy-yyyyyyyyyyyy) Method request path: {} 2019-07-12T07:22:42.615Z (yyyyyyyy-yyyy-yyyy-yyyy-yyyyyyyyyyyy) Method request query string: {var=test} 2019-07-12T07:22:42.615Z (yyyyyyyy-yyyy-yyyy-yyyy-yyyyyyyyyyyy) Method request headers: {CloudFront-Viewer-Country=JP, CloudFront-Forwarded-Proto=https, CloudFront-Is-Tablet-Viewer=false, User-Agent=PostmanRuntime/7.15.2, Accept-Encoding=gzip, True-Client-IP=xxx.xxx.xxx.xxx, Content-Encoding=gzip, X-Amz-Cf-Id=gggggggggggggggggggggggggggggggggggggggggggggggggggggg==, Postman-Token=eeeeeeee-eeee-eeee-eeee-eeeeeeeeeeee, CloudFront-Is-Desktop-Viewer=true, Content-Type=text/xml, Akamai-Origin-Hop=2, Accept=*/*, X-Session-Id=33333333333333333333333333333333, CloudFront-Is-Mobile-Viewer=false, X-Forwarded-Proto=https, CloudFront-Is-SmartTV-Viewer=false, Host=testdomain.com, Pragma=no-cache, X-Forwarded-Port=443, X-Amzn-Trace-Id=Root=1-1b111111-222222222222222222222222, Via=1.1 v1-akamaitech.net(ghost) (AkamaiGHost), 1.1 akamai.net(ghost) (AkamaiGHost), 1.1 hhhhhhhhhhhhhhhhhhhhhhhhhhhhhhhh.cloudfront.net (CloudFront), X-Akamai-CONFIG-LOG-DETAIL=true, Cache-Control=no-cache, max-age=0, X-Forwarded-For=xxx.xxx.xxx.xxx, xxx.xxx.xxx.xxx, xxx.xxx.xxx.xxx, xxx.xxx.xxx.xxx, [TRUNCATED] 2019-07-12T07:22:42.615Z (yyyyyyyy-yyyy-yyyy-yyyy-yyyyyyyyyyyy) Method request body before transformations: [Binary Data] 2019-07-12T07:22:42.615Z (yyyyyyyy-yyyy-yyyy-yyyy-yyyyyyyyyyyy) Endpoint request URI: https://lambda.ap-northeast-1.amazonaws.com/2015-03-31/functions/arn:aws:lambda:ap-northeast-1:111111111111:function:niikawa-test-lmd001/invocations 2019-07-12T07:22:42.615Z (yyyyyyyy-yyyy-yyyy-yyyy-yyyyyyyyyyyy) Endpoint request headers: {x-amzn-lambda-integration-tag=yyyyyyyy-yyyy-yyyy-yyyy-yyyyyyyyyyyy, Authorization=*****************************************************************************************************************************************************************************************************************************************************************************************************************************227fcf, X-Amz-Date=20190712T072242Z, x-amzn-apigateway-api-id=abcdefghij, X-Amz-Source-Arn=arn:aws:execute-api:ap-northeast-1:111111111111:abcdefghij/prod/POST/test, Accept=text/xml, User-Agent=AmazonAPIGateway_abcdefghij, X-Amz-Security-Token=KKKKKKKKKKKKKKKKKKKKKKKKKKKKKKKKKKKKKKKKKKKKKKKKKKKKKKKKKKKK/b [TRUNCATED] 2019-07-12T07:22:42.615Z (yyyyyyyy-yyyy-yyyy-yyyy-yyyyyyyyyyyy) Endpoint request body after transformations: {"resource":"/test1","path":"/test1/","httpMethod":"POST","headers":{"Accept":"*/*","Accept-Encoding":"gzip","Akamai-Origin-Hop":"2","Cache-Control":"no-cache, max-age=0","CloudFront-Forwarded-Proto":"https","CloudFront-Is-Desktop-Viewer":"true","CloudFront-Is-Mobile-Viewer":"false","CloudFront-Is-SmartTV-Viewer":"false","CloudFront-Is-Tablet-Viewer":"false","CloudFront-Viewer-Country":"JP","Content-Encoding":"gzip","Content-Type":"text/xml","Host":"testdomain.com","Postman-Token":"eeeeeeee-eeee-eeee-eeee-eeeeeeeeeeee","Pragma":"no-cache","True-Client-IP":"xxx.xxx.xxx.xxx","User-Agent":"PostmanRuntime/7.15.2","Via":"1.1 v1-akamaitech.net(ghost) (AkamaiGHost), 1.1 akamai.net(ghost) (AkamaiGHost), 1.1 hhhhhhhhhhhhhhhhhhhhhhhhhhhhhhhh.cloudfront.net (CloudFront)","X-Akamai-CONFIG-LOG-DETAIL":"true","X-Amz-Cf-Id":"gggggggggggggggggggggggggggggggggggggggggggggggggggggg==","X-Amzn-Trace-Id":"Root=1-1b111111-222222222222222222222222","X-A [TRUNCATED] 2019-07-12T07:22:42.615Z (yyyyyyyy-yyyy-yyyy-yyyy-yyyyyyyyyyyy) Sending request to https://lambda.ap-northeast-1.amazonaws.com/2015-03-31/functions/arn:aws:lambda:ap-northeast-1:111111111111:function:niikawa-test-lmd001/invocations 2019-07-12T07:22:42.673Z (yyyyyyyy-yyyy-yyyy-yyyy-yyyyyyyyyyyy) Received response. Status: 200, Integration latency: 58 ms 2019-07-12T07:22:42.673Z (yyyyyyyy-yyyy-yyyy-yyyy-yyyyyyyyyyyy) Endpoint response headers: {Date=Fri, 12 Jul 2019 07:22:42 GMT, Content-Type=application/json, Content-Length=334, Connection=keep-alive, x-amzn-RequestId=ffffffff-ffff-ffff-ffff-ffffffffffff, x-amzn-Remapped-Content-Length=0, X-Amz-Executed-Version=$LATEST, X-Amzn-Trace-Id=root=1-1b111111-222222222222222222222222;sampled=0} 2019-07-12T07:22:42.673Z (yyyyyyyy-yyyy-yyyy-yyyy-yyyyyyyyyyyy) Endpoint response body before transformations: [Binary Data] 2019-07-12T07:22:42.673Z (yyyyyyyy-yyyy-yyyy-yyyy-yyyyyyyyyyyy) Method response body after transformations: [Binary Data] 2019-07-12T07:22:42.673Z (yyyyyyyy-yyyy-yyyy-yyyy-yyyyyyyyyyyy) Method response headers: {Content-Encoding=gzip, Content-Type=text/plain, X-Amzn-Trace-Id=Root=1-1b111111-222222222222222222222222;Sampled=0} 2019-07-12T07:22:42.673Z (yyyyyyyy-yyyy-yyyy-yyyy-yyyyyyyyyyyy) Successfully completed execution 2019-07-12T07:22:42.673Z (yyyyyyyy-yyyy-yyyy-yyyy-yyyyyyyyyyyy) Method completed with status: 200 2019-07-12T07:22:42.673Z (yyyyyyyy-yyyy-yyyy-yyyy-yyyyyyyyyyyy) AWS Integration Endpoint RequestId : 99999999-9999-9999-9999-999999999999 2019-07-12T07:22:42.673Z (yyyyyyyy-yyyy-yyyy-yyyy-yyyyyyyyyyyy) X-ray Tracing ID : 1-1b111111-222222222222222222222222
元記事はこちら
「API Gateway 実行ログのCloudWatch出力設定」
December 18, 2019 at 02:00PM
0 notes
Text
Hacking Cheat Sheets Part 1: Nmap
Here’s a cheat sheet I made for some common nmap commands, the formatting was a bit off so if you see a bullet point that starts with an f, its supposed to be an @ symbol.
nmap:
* The following command checks the state of the most popular ports on the host scanme.nmap.org by launching a TCP port scan:$ nmap scanme.nmap.org
* Nmap begins by converting the hostname to an IPv4 address using DNS. If you wish to use a different DNS server, use --dns-servers <serv1[,serv2],...>, or use -n if you wish to skip this step, as follows:$ nmap --dns-servers 8.8.8.8,8.8.4.4 scanme.nmap.org
* Afterwards, it pings the target address to check if the host is alive. To skip this step use –PN as follows:$ nmap -PN scanme.nmap.org
* Nmap then converts the IPv4 address back to a hostname by using a reverse DNS call. Use -n to skip this step as follows:$ nmap -n scanme.nmap.org
* Finally, it launches a TCP port scan. To specify a different port range, use -p[1-65535], or -p- for all possible TCP ports, as shown in the following command:$ nmap -p1-30 scanme.nmap.org
* Nmap categorizes ports into the following states: 1. Open: This indicates that an application is listening for connections on this port 2. Closed: This indicates that the probes were received but there is no application listening on this port 3. Filtered: This indicates that the probes were not received and the state could not be established. It also indicates that the probes are being dropped by some kind of filtering 4. Unfiltered: This indicates that the probes were received but a state could not be established 5. Open/Filtered: This indicates that the port was filtered or open but Nmap couldn't establish the state 6. Closed/Filtered: This indicates that the port was filtered or closed but Nmap couldn't establish the state.
* Version detection is one of the most popular features of Nmap. Knowing the exact version of a service is highly valuable for penetration testers who use this service to look for security vulnerabilities, and for system administrators who wish to monitor their networks for any unauthorized changes. Fingerprinting a service may also reveal additional information about a target, such as available modules and specific protocol information.
* $ nmap -sV scanme.nmap.org
* This feature basically works by sending different probes from nmap-service-probes to the list of suspected open ports. The probes are selected based on how likely it is that they can be used to identify a service.There is very detailed documentation on how the service detection mode works, and the file formats used, at http://nmap.org/book/vscan.html
* Nmap has a special flag to activate aggressive detection, namely -A. Aggressive mode enables OS detection (-O), version detection (-sV), script scanning (-sC), and traceroute (--traceroute). Needless to say this mode sends a lot more probes and it is more likely to be detected, but provides a lot of valuable host information. You can see this by using one of the following commands:# nmap -A <target>
* Finding live hosts in a network is often used by penetration testers to enumerate active targets, and by system administrators to count or monitor the number of active hosts. Thi sis a ping scan: $ nmap -sP 192.168.1.1/24
* ARP requests are used when scanning a local Ethernet network as a privileged user, but you can override this behavior by including the flag --send-ip.# nmap -sP --send-ip 192.168.1.1/24
* Ping scanning does not perform port scanning or service detection, but the Nmap Scripting Engine can be enabled for scripts depending on host rules, such as the cases of sniffer-detectand dns-brute.# nmap -sP --script discovery 192.168.1.1/24
* There are situations when a system administrator is looking for infected machines that use a specific port to communicate, or when users are only looking for a specific service or open port and don't really care about the rest. Narrowing down the port ranges used also optimizes performance, which is very important when scanning multiple targets.# nmap -p80 192.168.1.1/24
* There are several accepted formats for the argument -p: f Port list: # nmap -p80,443 localhost f Port range: # nmap -p1-100 localhost f All ports: # nmap -p- localhost f Specific ports by protocols: # nmap -pT:25,U:53 <target> f Service name: # nmap -p smtp <target> f Service name wildcards: # nmap -p smtp* <target> f Only ports registered in Nmap services: # nmap -p[1-65535] <target>
* The argument --scriptsets which NSE scripts should be run with the scan. In this case, when the service scan detects the web server, a parallel thread is initialized for the selected NSE script
* There are more than 230 scripts available, which perform a wide variety of tasks. The NSE script http-title returns the title of the root document if a web server is detected.
* You can run multiple scripts at once: $ nmap --script http-headers,http-title scanme.nmap.org
* f Run all the scripts in the vulncategory: $ nmap -sV --script vuln <target> f Run the scripts in the categories versionor discovery: $ nmap -sV --script="version,discovery" <target> f Run all the scripts except for the ones in the exploitcategory: $ nmap -sV --script "not exploit" <target> f Run all HTTP scripts except http-bruteand http-slowloris: $ nmap -sV --script "(http-*) and not(http-slowloris or httpbrute)" <target>
* To test new scripts, you simply need to copy them to your /scriptsdirectory and run the following command to update the script database:# nmap --script-update-db
* NSE script categories f auth: This category is for scripts related to user authentication. f broadcast: This is a very interesting category of scripts that use broadcast petitions to gather information. f brute: This category is for scripts that help conduct brute-force password auditing. f default: This category is for scripts that are executed when a script scan is executed (-sC). f discovery: This category is for scripts related to host and service discovery. f dos: This category is for scripts related to denial of service attacks. f exploit: This category is for scripts that exploit security vulnerabilities. f external: This category is for scripts that depend on a third-party service. f fuzzer: This category is for NSE scripts that are focused on fuzzing. f intrusive: This category is for scripts that might crash something or generate a lot of network noise. Scripts that system administrators may consider intrusive belong to this category. f malware: This category is for scripts related to malware detection. f safe: This category is for scripts that are considered safe in all situations. f version: This category is for scripts that are used for advanced versioning. f vuln: This category is for scripts related to security vulnerabilities
* how to force Nmap to scan using a specified network interface: $ nmap -e <INTERFACE> scanme.nmap.org
* Scanning profilesare a combination of Nmap arguments that can be used to save time and the need to remember argument names when launching an Nmap scan.This recipe is about adding, editing, and deleting a scanning profile in Zenmap. Let's add a new profile for scanning web servers: 1. Launch Zenmap. 2. Click on Profile on the main toolbar. 3. Click on New Profile or Command(Ctrl+ P). The Profile Editor will be launched. 4. Enter a profile name and a description on the Profile tab. 5. Enable Version detection and disable reverse DNS resolution on the Scan tab. 6. Enable the following scripts on the Scripting tab: ? hostmap ? http-default-accounts ? http-enum ? http-favicon ? http-headers ? http-methods ? http-trace ? http-php-version ? http-robots.txt ? http-title 7. Next, go to the Target tab and click on Ports to scan and enter 80, 443. 8. Save your changes by clicking on Save Changes.
After using the editor to create our profile, we are left with the following Nmap command: $ nmap -sV -p 80,443 -T4 -n --script http-default-accounts,httpmethods,http-php-version,http-robots.txt,http-title,http-trace,httpuserdir-enum <target> Using the Profilewizard, we have enabled service scanning (-sV), set the scanning ports to 80and 443, set the Timing template to 4, and selected a bunch of HTTP-related scripts to gather as much information as possible from this web server. And we now have this profile saved for some quick scanning without having to type all these flags and options again. ------------------------------------------------------------------------------------ * nmap workshop on webpownized notes: with this I have metasploitable2 up and running. you can either run netdiscover or -sn switch for nmap to do a host discover and see what you have up and running
1. tcpdump -i eth0 -nn host 10.0.0.100 && host 10.0.0.115 2. this says use interface eth0 with no dns resolve or friendly names (like http instead of port 80) and to specifically monitor these 2 hosts 3. first lets start with a syn scan. You have to be running as root to do this one 4. nmap -p 80 -sS 10.0.0.115 5. note the flags of syn from us and syn/ack from them, then we sent an R rst 6. lets change the -sS to -sT, this is full connect and its what it switches to if your not root 7. note the syn, syn/ack, ack, then reset 8. now if we stuck with these scans they are tcp scans we would be missing out on the goods on udp 9. adding a -sU to the mix will do a udp scan, but this takes a long time. 10. you can decrease the time with -p 1-200 11. also test the firewall state with an ack scan 12. nmap -p 1-200 -sA 10.0.0.115 13. looking at tcpdump we see there was a large amount of ports that responded back with an rst, so we know its listening and responding 14. you can also use the --scanflags <flags> that lets you specify what flag you want set 15. lets do a protocol scan 16. nmap -sO 10.0.0.115 17. this is checking the ip protocol ids to see what the victim supports 18. takes a while so go ahead and ctrl+c it 19. keep in mind you can hit v on your keyboard during the scan to set verbosity limits. D as well for debug info. shift+v and shift+d dials it back down 20. you could have also done it in the command -vvv (the number of v's is the number of verbosity) and -ddd as well 21. so lets just run a basic nmap on metasploitable2 22. nmap 10.0.0.115 23. this shows whats open and what service is running based on the port number. This can be misleading because admins may move services to different ports 24. if you go to /usr/share/nmap/ cat nmap-services | more you will see what nmap notes as services 25. so lets go deeper with one in particular port 3306. It states its mysql, so lets find out 26. nmap -sV -p 3306 10.0.0.115 27. this gives the whole version number, this is what you would compare online to see if theres a vulnerability for that specific version 28. lets see how these are found out 29. cd /usr/share/nmap and cat nmap-service-probes | more 30. these will list differnt probes that have data that can be used to compare with the response nmap gets back from a service. Theres a ton of probes here ranging from null scans, bitcoin, antiviruses 31. lets see if we can find the mysql probes (q to quit) 32. cat nmap-service-probes | grep mysql 33. you can also scan the top 1000 services based off of this services text file 34. by adding -F it will scan the top 100 and quick 35. nmap -F 10.0.0.115 36. you can also use --top-ports<number of ports> 37. nmap --top-ports 500 10.0.0.115 38. you can skip port ranges with a comma 39. nmap -p 21-25,27,29 10.0.0.115 40. you can also specify udp or tcp 41. nmap -sS -sU -p U:53,111,137,T:21-25,80 10.0.0.115 42. now try it without the -sU and you will see that although you specified the udp ports, it still doesnt scan them without that -sU switch 43. same thing applies if you just did the -sU and omitted the -sS you will only get the udp ports 44. so run both types of scans if you are going to be specifying udp and tcp ports 45. you can add a -r to have the ports scanned in order not random 46. the file to see how nmap detrmines OS version is /usr/share/nmap/nmap-os-db 47. these are basically patterns, and if the nmap response matches one of these patterns it can determine with good certainty that particular OS 48. so do nmap -O 10.0.0.115 to do the OS scan 49. you tweak these scans as well. Like the --osscan-limit which basically says if you cant detrmine what it is, dont bother. nmap -O --osscan-limit 10.0.0.115 50. --osscan-guess is a more aggressive probe. nmap -O --osscan-guess 10.0.0.115 51. http://nmap.org/book/osdetect-methods.html 52. now lets try to mess with timing 53. you can use --min-hostgroup if you want to specify a number of host groups to scan at a time, theres also --max-hostgroup 54. --max-retries caps number of port scan probe retransmissions 55. --host-timeout<time> give up on target after this long 56. --scan-delay adjust when i want to send probes 57. there are templates that use these parameters when using the T options
-T<0-5>: Set timing template (higher is faster)
Speed: T1 --------------- Timing report --------------- hostgroups: min 1, max 100000 rtt-timeouts: init 15000, min 100, max 15000(round trip times) max-scan-delay: TCP 1000, UDP 1000, SCTP 1000 parallelism: min 0, max 1 max-retries: 10, host-timeout: 0 min-rate: 0, max-rate: 0 ---------------------------------------------
Speed: T2 --------------- Timing report --------------- hostgroups: min 1, max 100000 rtt-timeouts: init 1000, min 100, max 10000 max-scan-delay: TCP 1000, UDP 1000, SCTP 1000 parallelism: min 0, max 1 max-retries: 10, host-timeout: 0 min-rate: 0, max-rate: 0 ---------------------------------------------
Speed: T3
--------------- Timing report --------------- hostgroups: min 1, max 100000 rtt-timeouts: init 1000, min 100, max 10000 max-scan-delay: TCP 1000, UDP 1000, SCTP 1000 parallelism: min 0, max 0 max-retries: 10, host-timeout: 0 min-rate: 0, max-rate: 0 ---------------------------------------------
Speed: T4
--------------- Timing report --------------- hostgroups: min 1, max 100000 rtt-timeouts: init 500, min 100, max 1250 max-scan-delay: TCP 10, UDP 1000, SCTP 10 parallelism: min 0, max 0 max-retries: 6, host-timeout: 0 min-rate: 0, max-rate: 0 ---------------------------------------------
Speed: T5
--------------- Timing report --------------- hostgroups: min 1, max 100000 rtt-timeouts: init 250, min 50, max 300 max-scan-delay: TCP 5, UDP 1000, SCTP 5 parallelism: min 0, max 0 max-retries: 2, host-timeout: 900000 min-rate: 0, max-rate: 0 ---------------------------------------------
58. T3 is a good balance 59. T1 is good when i dont want to be found by ids, because it takes so much time in between packets 60. nmap -T1 -vvv -dd 10.0.0.115 61. this will take forever so just show students the verbose output of what its doing 62. do the same with the other ones 63. reporting options are many 64. -oN/-oX/-oS/-oG <file> normal,xml,script kiddie, and grepable format in that order. with these ones you need to add the extension to the end of the filename 65. -oA outputs in all major formats simultaneously 66. nmap -oA rays-scan 10.0.0.115 67. make sure you copy over the stylesheet with cp /usr/share/nmap/nmap.xsl /root 68. also give the xml version a minute or so to finish then do firefox rays-scan.xml & 69. you would need to send this xls file along with the xml file if you send it elsewhere 70. --resume will resume an aborted scan if you were outputting this to file at the time
nmap scripting * its based on lua * you can do network discovery, more sophistictaed version detection, vulnerability detection, backdoor detection, some exploitation
* script categories: auth - credentials on a target system broadcast - discovery of hosts not listed on the command line by broadcasting on the local network default - if you write a script for this category it gets run when you do the -A option discovery - discover more info (directory services, snmp, public registries, etc) dos - crash a service exploit - exploit a vulnearbility fuzzer - send server software unexpected input intrusive - high risk, things that can crash services safe - wont crash service version - version detection
The NMAP Scanning Engine (NSE)
1. How to specify which scripts to run. 2. How to use wildcards 3. How scripts work 4. Overview of the scripts available 5. Demonstration of select scripts 6. Discuss some scripts helpful in your job
-sC: equivalent to --script=default --script=<Lua scripts>: <Lua scripts> is a comma separated list of directories, script-files or script-categories --script-args=<n1=v1,[n2=v2,...]>: provide arguments to scripts --script-args-file=filename: provide NSE script args in a file --script-trace: Show all data sent and received --script-updatedb: Update the script database. --script-help=<Lua scripts>: Show help about scripts. <Lua scripts> is a comma separated list of script-files or script-categories. * a good methodology when you start pentesting a network is: PLUG INTO THE NETWORK AND CREATE A SUBNET LIST 1. ifconfig 2. /etc/resolv.conf this is where their dns servers are listed and a lot of companies tend to put their dns servers in the same subnet as their domain controllers 3. netdiscover 4. wireshark 5. dig PING SCAN TO CREATE LIST OF LIVE IPS 1. nmap -sP -PL SYN SCAN USING TIMING AND OTHER EVASION TECHNIQUES ONE PORT AT A TIME 1. cat hostlist.txt | sort -R | nmap -sS -p 389 -oG myscan -iL- (sort is so it will go at random so ids wont pick up sequential scans USE NMAP SCRIPTS AGAINST THE HOSTS ONE BY ONE IN EACH PORT.TXT FILE 1. nmap -Pn -n --open -p21 --script ftp-anon,ftp-bounce,ftp-libopie -iL 21.txt
* dont throw a script at a network until you know what it does. find it on nmap.org/nsedoc/scripts/ * help files would be nmap --script-help "ftp-*" * lets do some examples: 1. nmap --scan-delay 5s -g 53 -Pn -n -sS --open -p21 --script=banner,ftp-anon,ftp-bounce 10.0.0.115 2. scan delay is delay between each packet, -g spoof the source port (most 53 ports will be let through a firewall), no dns or arp 3. nmap --script-help "ssh-*" also do it without the - to get more scripts 4. nmap --scan-delay 5s -g 53 -Pn -n -sS --open -p22 --script=sshv1,ssh2-enum-algos 5. nmap --script-help "smtp-*" 6. nmap --scan-delay 5s -g 53 -Pn -n -sS --open -p25 --script=smtp-brute,smtp-enum-users 10.0.0.115 7. nmap --script-help "dns-*" 8. nmap --scan-delay 5s -g 53 -Pn -n -sS --open -p53 --script=dns-cache-snoop,dns-service-discovery,dns-update,dns-zone-transfer,dns-recursion 10.0.0.115 9. the dns cache thing is somethinig most dont realize. dns servers love to cache domains, the dns-cache script has about 100 domains like facebook, wikipedia,etc. so modifying the nse for that with other domains 10. cd /usr/share/nmap/scripts ls -lah | grep dhcp 11. nmap --script=broadcast-dhcp-discover.nse -p67 --open 10.0.0.0/24 12. this one can show me an ip address that can be used by me 13. nmap --script-help "ms-sql-*" 14. nmap --scan-delay 5s -g 53 -Pn -n -sS --open -p T:1433,U:1434 --script=ms-sql-info,ms-sql-empty-password 10.0.0.115 can also replace this with mysql to be used against metasploitable 15. nmap --script-help "nfs-*" 16. nmap --scan-delay 5s -g 53 -Pn -n -sS --open -p111 --script=rpcinfo,nfs-ls,nfs-showmount,nfs-statfs 10.0.0.115 note the export / to root. so show the students how this is dangerous by.. 17. mkdir /mnt/raystemp 18. mount -t nfs 10.0.0.115:// /mnt/raystemp/ -o nolock 19. cd /mnt/raystemp/ 20. ls and look at all the access you have because some let you mount to root 21. the company may have their golden images for their image deployment stored here and you can download it, install it and rip the admin hashes 22. nmap --script-help "smb-*" 23. nmap --scan-delay 5s -g 53 -Pn -n -sS --open -p139,445 --script="smb-enum*",smb-os-discovery,smb-security-mode,smb-check-vulns --script-args safe=1 10.0.0.115 24. nmap --script-help "http-*" 25. nmap --scan-delay 5s -g 53 -Pn -n -sS --open -p80,443,8000,8080,8443 --script=http-date,http-enum,http-favicon,http-headers,http-open-proxy,http-php-version,http-robots.txt,http-title,http-trace,http-vhosts,http-vmware-path-vuln,citrix-enum-apps-xml,citrix-enum-servers-xml --stats-every 30s 10.0.0.115 26. nmap --script-help "ldap-*" 27. nmap --scan-delay 5s -g 53 -Pn -n -sS --open -p389 --script=ldap-rootdse 10.0.0.115 28. nmap --script-help "ssl-*" 29. nmap --scan-delay 5s -g 53 -Pn -n -sS --open -p443 --script=banner,ssl-cert,ssl-enum-ciphers,sslv2,ssl-heartbleed 10.0.0.115 30. by the way the reason for all these scans, is because a lot of the vulnerability scanners out there produce false positives, so by doing these scans its a great secondary scan 31. ip geo location stuff as well can be done from nmap 32. nmap -Pn -p80 --script ip-geolocation-* irongeek.com 33. github has a lot of custom scripts 34. so to install an nse script you download one like https://github.com/SpiderLabs/Nmap-Tools/blob/master/NSE/http-screenshot.nse and then copy it over to /usr/local/share/nmap/scripts/ then after thats done you run nmap --script-updatedb 35. git clone git://github.com/SpiderLabs/Nmap-Tools.git 36. cd Nmap-Tools/NSE/ 37. cp htp-screenshot.nse /usr/share/nmap/scripts 38. nmap --script-updatedb
metasploit and nmap * some of the common database commands are: 1. creds - list all the credentials in the database 2. db_connect - connect to an existing database 3. db_disconnect 4. db_export - export a file containing the contents of the database 5. db_import - import a scan result file 6. db_nmap - executes nmap and records the output automatically 7. db_rebuild_cache rebuilds the database stored module cache 8. db_status 9. hosts - lists all hosts in the database 10. loot - lists all teh loot in the database 11. notes - lists all notes in the database 12. services - lists all the servvices in the db 13. vulns - lists all the vulns 14. workspace - switch between database workspaces
* so you can scan directly into the database when you do nmap by doing : 1. db_nmap -n -A 10.0.0.115 2. now you can type hosts and see what you have for hosts 3. hosts -u this will tell you hosts that responded 4. if you want to only get the info about a certain port it would be services -p 80 -u 5. and when i do metasploit exploit module, i can say services -p 21 -R this automatically sets all the rhosts to this ip. Keep in mind this is only for rhosts not rhost. 6. so do services -p 21 -R 7. then search port scanner and grab the ftpbounce scanner and use the module 8. show options and it should already have the rhosts option set (unset unsets it) 9. workspace -h 10. all the commands for database have help files so hosts -h, services -h, etc. 11. you can also query the database for the differnt columns and such like: 12. hosts -c address,os_flavor 13. hosts -c address,os_flavor -S Linux 14. services -c name,info 10.0.0.115 15. services -S Unr 16. services -c port,proto,state -p 80-82 17. services -s http -c port 10.0.0.115 18. now for exporting: 19. services -s http -c port 10.0.0.115 -o /root/rays.csv 20. hosts -S Linux -o /root/rayshosts.csv
Evasion techniques 1. syn scan is still the best stealthy scan always do one 2. source port manipulation, dns tcp 53, ftp tcp 20, kerberos tcp or udp 88 and dhcp udp 67. the syntax would be --source-port<port number> or -g <port number> 3. this doesnt work with tcp connect scan , dns requests, os version scanning or script scanning 4. fragmentation: -f (fragment packets or --mtu(using the specified mtu). split up the tcp header over several packets to make it harder for packet filters. you can specify this option once and split the packets into eight bytes or less after the ip header. You can specify the -f again to use 16 bytes per fragment. Generally not supported for connect scans, ftp bounce, version detection and scripting engine 5. scan delay: --scan-delay<time> or --max-scan-delay<time>. Wait at least the given amount of time between each probe. Evade threshold based IDS and ips. Nmap tries to detect rate limiting and adjust the scan delay accordingly. A low --max-scan-delay can speed up nmap, most pentesters go with 3 sec 6. decoy scanning: -D <decoy1>,<decoy2> basically your cloaking a scan with decoys. makes it appear to the remote host that the hosts you specify as decoys are scanning the target network too. Thi smakes the scan less obvious to various network monitoring systems. Hosts you use as decoys should be up, and use ip addresses instead of names. Can be defeated through router tracing, response dropping and other active mechanisms. they work with initial ping scan(using icmp,syn,ack), actual port scanning phase and remote OS detection. They do not work with version detection scans or tcp connect scans. 7. data length: --data-length<number> (append random data to sent packets). one way that ids finds that its nmap in play is its default data length signature, thats where this comes into play. tcp packets are generally 40 bytes and icmp echo requests are just 28. Append the given number of random bytes to most of the packets it sends and not to use any protocol-specific payloads. Adds extra padding to the packet making it look less like a scan packet and more like a legit packet 8. another evasion technique is to do several scans of teh target, break your scans up into chunks of "ports of interest" 9. most ids/ips alert on scans of more than 5 ports 10. layer your source-obfuscation techniques(decoys,timing,fragmentation,data length,etc) 11. keep your scan time to a minimum by breaking scans into multiple jobs
1 note
·
View note
Link
Hi all,
In my previous blogs on APIGEE we:
Went through the basic introduction of Apigee.
Went through the main policies and how to apply them on our proxies.
Saw how to extract out a header, extract a list of values out of a header.
If you like you can go through those once again here:
Basics of Apigee. click here
Playing with Policies. click here
Extract the content of the header. click here
In this blog, we will dive into the concept of Fault-Handling through Apigee.
Prerequisites:
1. Knowledge of basics of Apigee. 2. Knowledge of creating a proxy over Apigee. 3. Knowledge of applying policies in Apigee. 4. Assign Message Policy Overview.
As you all know that Apigee acts as a gateway between your App-Client and the backend, all the requests are made by the client to the Apigee proxies and then they are mapped back to the backend source. All is well till now, but just for 1 second, think if something broke at your backend or if the connection to the backend is lost or you passed some unprocessable entity with your request to the backend? In such scenarios, the response coming from the backend may not be in a well-managed form and might not be very informative to a person who’s going to debug the issue later.
To manage such scenarios Apigee provides us with a Fault-Handling capability so that we can pass on our custom messages to the client that will also help the developer/debugger to debug into the issue promptly and effectively.
If we don’t provide any fault handling mechanism at Apigee level, we will get a default fault response from APIGEE whenever an unwanted situation like one of those mentioned above arise. For example, let’s try to hit my API proxy with an invalid AppKey(what’s an AppKey?), we will see the default fault response sent by Apigee here:
By Default Apigee responds back with a fault object containing a fault string and an error code section where the fault string would contain a message that would in a way try to give you an overview of why you are seeing a fault and then the error code would represent the Error flow that got hit with your wrong/bad request at Apigee. This, as you can see, is not very much informative, to make it more appealing and informative we use fault handling in Apigee.
Let’s first see how an informative and appealing Fault response is represented at Apigee, in the screenshot below you can see how I made the Apigee fault response more specific when I again hit the proxy endpoint with the wrong AppKey value:
Compare this screenshot with the previous one, this is the minimal change that I have made to make the fault response more informative, you can add more information as per your organization need. On comparing the two, you can see that in the second screenshot I have:
Set my Custom Status as 401 Unprocessable Entity(422 is the actual code for that but the aim here is to know that we can set it as per our organization business rules) which was previously 401 Unauthorised.
The response body now doesn’t contain any default fault string or error code object but it now contains a totally different JSON body defining the Error, HttpMethod Error Code, and the ErrorTitle as well. You can add more fields to this we will see how to do that later in the blog .
By now you might be getting curious, how did I change that Messaging in the response? So let me answer that for you.
So the first thing you would need when creating a custom Fault handler in Apigee is an AssignMessage policy that would be responsible for creating your payload containing the custom JSON body in which you can pass all the valuable information for the developer or debugger who would be debugging into the issue later on.
You must come up with a particular condition as well because you would want to return a particular fault message only when a particular type of error has occurred, and not for every other fault that might occur during the flow. So deciding a condition is the second big thing.
Once you have taken care of the above two steps you would need to add a FaultRules section in your proxy endpoint. A FaultRules section is the place where your flow would reach immediately if in case there occurs some error during the request/response transfer.
Here’s the link for the XML configuration of my AssignMessage policy that I have used here to create my custom informative JSON payload, you can go through the contents here:
AssignMessageForFaultHandling
And here is the link to the proxy endpoint on which I have applied my fault handling
ProxyEndpointForFaultHandling
Please try to implement this at your Apigee-edge accounts and if you face any problem you can always reach out to me or comment your problem in the comments section below.
For your convenience, I have setup my proxy bundle here
FaultRulesHandlingApigee
you can always download it and use it in your accounts but I would like you to give it a try by yourself first and take my bundle as a reference if required.
I’ll be back with details on other exciting features from Apigee in my next blog, stay tuned for richer API management content.
Happy Blogging and Happy reading.
0 notes
Text
Going Serverless
Just tried out a Lambda a few weeks ago. It’s part of the evolution of software architecture. We are going from patching the same servers for years to using Kubernetes to spin up a whole new server for any code change. The latter is the concept of “immutable infrastructure.” And now, for some apps, we're going “serverless,” which really just means letting AWS handle the server scaling, upgrades, and security.
It was super fast to get the app deployed. We used Node.js and Serverless, a library that simplifies deploying to AWS Lambda. “Serverless” is both a concept and a specific free and open source framework.
A few tips:
Pryjs
My favorite Ruby debugging tool has a javascript version which works great in Serverless. Make a breakpoint with: eval(pry.it)
Make, or invoke a request, with specific parameters
serverless invoke local --stage dev -f experiment -d '{ "httpMethod": "GET", "path": "/search.json", "queryStringParameters": { "plate": "1883NZB", "site": "example-site", "device": "cheesefries", "signature": "262e8a26829bd54789f38" }, "headers": { "Accept": "application/json" } }'
"experiment" is the name of the function we're calling. "stage" refers to what we usually call the environment.
Tail the logs:
serverless logs -f experiment --stage dev
0 notes
Text
#codeonedigest#httpmethods#httpverbs#httpresponsecodes#springboot#springframework#intellij#postman#java
0 notes
Photo

API Gateway から Lambda にパラメータを渡す https://ift.tt/2Woi0XS
10月で入社して半年が経ちました、streampackチームのminsuです。 いきなり寒くなってきて秋を感じますね、春に東京に引っ越してきた私はまだ冬服を揃えてないのでもう少し緩やかに気温が変化して欲しかったです。
今回の記事は先日API Gateway + Lambdaを触ることがあったため、自分用にまとめたものです。 /{foo}/{bar}のようなパスパラメータやGET,POSTパラメータを渡そうとしたところ、 マッピングテンプレートを設定する方法もありますがLambdaプロキシ統合を使うとよしなに設定してくれて楽でした。
Lambda 関数の作成
Lambda関数を作成します。 関数名はparams-testとしました。 アクセス権限は用途に沿って設定してください。
API Gateway 作成
APIの作成から API を作成します、API名はURLに反映されません。

リソース作成
パスパラメータを設定するにはリソースの作成するときにリソースパスを{}で括ります。

メソッド作成
メソッドの作成>GETを選択し、メソッドのセットアップを行います。 Lambda関数に先ほど作成した params-testを入力します。 前述のLambda プロキシ統合の使用に チェックを入れることでリクエスト情報が Lambda の handler関数の event で参照できるようになります。

メソッド作成後も統合リクエストから編集可能です。
API のデプロイ
アクションからAPIのデプロイを行います。 ここのステージ名はURLに反映されます。 https://xxx.execute-api.ap-northeast-1.amazonaws.com/ステージ名

Lambda でテストをしたい場合は イベントテンプレート Amazon API Gateway AWS Proxyを選択してpathParametersを編集するといいです。
Lambdaへリクエストデータの引き渡し
API Gateway へパラメータを付けてGETリクエストを行うと Lambda の event は以下のフォーマットで情報を受け取ります。
$ curl https://xxx.execute-api.ap-northeast-1.amazonaws.com/dev/xxx/foofoo/barbar?hoge=hogege&fuga=fugaga
{ "resource": "/xxx/{foo}/{bar}", "path": "/xxx/foofoo/barbar", "httpMethod": "GET", "headers": {...}, "multiValueHeaders": {...}, "queryStringParameters": { "fuga": "fugaga", "hoge": "hogege" }, "multiValueQueryStringParameters": {...}, "pathParameters": { "bar": "barbar", "foo": "foofoo" }, "stageVariables": null, "requestContext": {...}, "body": null, "isBase64Encoded": false }
pathParametersにパスパラメータが、 queryStringParametersにGETパラメータが含まれて Lambda に渡されています。 これがPOSTリクエストの場合はbodyにPOSTパラメーターが渡されます。
Lambda関数の言語に沿って node.js ではevent.pathParameters.foo; python では event['pathParameters']['foo'] ruby では event['pathParameters']['foo'] のようにパラメータを取得できます。
Lambda側でテストを行う場合はイベントテンプレートAmazon API Gateway AWS Proxyを使用すると一通りフォーマットが揃っています。 API Gateway側でテストを行う場合はメソッドの実行画面からテストが行えます。
Lambda への入力フォーマット https://docs.aws.amazon.com/ja_jp/apigateway/latest/developerguide/set-up-lambda-proxy-integrations.html#api-gateway-simple-proxy-for-lambda-input-format
API Gatewayへのレスポンスデータ
Lambda プロキシ統合を設定すると Lambda から API Gateway へのレスポンスデータも以下のフォーマットに沿って渡されます。
{ "isBase64Encoded": true|false, "statusCode": httpStatusCode, "headers": { "headerName": "headerValue", ... }, "multiValueHeaders": { "headerName": ["headerValue", "headerValue2", ...], ... }, "body": "..." }
以下のように headers Access-Control-Allow-Originを追加することでCORSを有効にできるなど工夫が必要なようです。
exports.handler = async (event) => { const hoge = event.queryStringParameters.hoge; const body = { "hoge": hoge, }; const response = { statusCode: 200, headers: { "Access-Control-Allow-Origin": "*" }, body: JSON.stringify(body), }; return response; };
API Gateway へのレスポンスフォーマット https://docs.aws.amazon.com/ja_jp/apigateway/latest/developerguide/set-up-lambda-proxy-integrations.html#api-gateway-simple-proxy-for-lambda-output-format
感想
API Gateway と Lambdaをチェックボックス一つで連携できるのは便利でした。 決まったフォーマットがあるのは覚えておかなければですね。 「API Gateway から Lambda にパラメータを渡す」というテーマでしたが、実際に利用する場合はLambdaからのレスポンスも理解が必要ですね、今後の課題です。
参考
Lambdaプロキシ統合 https://docs.aws.amazon.com/ja_jp/apigateway/latest/developerguide/set-up-lambda-proxy-integrations.html マッピングテンプレート https://docs.aws.amazon.com/ja_jp/apigateway/latest/developerguide/apigateway-getting-started-with-rest-apis.html
元記事はこちら
「API Gateway から Lambda にパラメータを渡す」
October 29, 2019 at 02:00PM
0 notes
Photo

AWS LambdaとHyperledger Fabric SDK for Node.jsを利用してAmazon Managed Blockchainのブロックチェーンネットワークにアクセスする http://bit.ly/2WH8ORP
Amazon Managed BlockchainのブロックチェーンネットワークはVPC内に構築されるため、VPC外からブロックチェーンネットワークへアクセスするにはクライアントとなるアプリなりサービスを開発して経由する必要があります。 AWS LambdaでVPC内に関数を配置するとアクセス可能になるはずなので試してみました。
Amazon VPC 内のリソースにアクセスできるように Lambda 関数を構成する – AWS Lambda https://docs.aws.amazon.com/ja_jp/lambda/latest/dg/vpc.html
前提
Dockerを利用して開発環境を構築します。
AWS Lambdaへのデプロイにはserverlessを利用します。
Serverless – The Serverless Application Framework powered by AWS Lambda, API Gateway, and more https://serverless.com/
AWS Lambdaを利用するのでAWSアカウントや権限も必要となります。
> docker --version Docker version 18.09.2, build 6247962 > docker-compose --version docker-compose version 1.23.2, build 1110ad01 > sls --version 1.43.0
Amazon Managed Blockchainでブロックチェーンネットワークが構築済み
下記の2記事の手順でブロックチェーンネットワークが構築済みでfabcarのサンプルが動作する環境がある前提です。
Amazon Managed BlockchainでHyperledger Fabricのブロックチェーンネットワークを構築してみた – Qiita https://cloudpack.media/46963
Amazon Managed Blockchainで作成したブロックチェーンネットワークにHyperledger Fabric SDK for Node.jsでアクセスしてみる – Qiita https://cloudpack.media/47382
開発環境を構築する
Hyperledger FabricのSDKをAWS Lambda上で利用するにはLinuxでnpm installする必要があったのでDockerを利用して開発環境を構築します。
Dockerコンテナの立ち上げ
> mkdir 任意のディレクトリ > cd 任意のディレクトリ > touch Dockerfile > touch docker-compose.yml
AWS Lambdaで利用できるNode.jsのバージョンは8.10 と10.xとなります。 Hyperledger Fabric SDK for Node.jsは8.x系で動作するのでDockerにも8.xをインストールします。
AWS Lambda ランタイム – AWS Lambda https://docs.aws.amazon.com/ja_jp/lambda/latest/dg/lambda-runtimes.html
Dockerfile
FROM amazonlinux RUN yum update && \ curl -sL https://rpm.nodesource.com/setup_8.x | bash - && \ yum install -y gcc-c++ make nodejs && \ npm i -g serverless
docker-compose.yml
version: '3' services: app: build: . volumes: - ./:/src working_dir: /src tty: true
> docker-compose build > docker-compose run app bash
Node.jsのプロジェクト作成
コンテナが立ち上がったらserverlessでNode.jsのテンプレートでプロジェクトを作成します。
コンテナ内
$ sls create \ --template aws-nodejs \ --path fablic-app $ cd fablic-app $ npm init
Hyperledger Fabric SDK for Node.jsが利用できるようにpackage.jsonを編集してnpm installを実行します。
package.json
{ "name": "fabcar", "version": "1.0.0", "description": "Hyperledger Fabric Car Sample Application", "main": "fabcar.js", "scripts": { "test": "echo \"Error: no test specified\" && exit 1" }, "dependencies": { "fabric-ca-client": "~1.2.0", "fabric-client": "~1.2.0", "fs-extra": "^8.0.1", "grpc": "^1.6.0" }, "author": "", "license": "Apache-2.0", "keywords": [ ] }
コンテナ内
$ npm install
証明書の用意
Hyperledger Fabric SDK for Node.jsでブロックチェーンネットワークへアクセスするのに各種証明書が必要となるためプロジェクトに含めます。こちらはDockerコンテナ外で行います。
コンテナ外
> cd fablic-app > aws s3 cp s3://us-east-1.managedblockchain-preview/etc/managedblockchain-tls-chain.pem ./managedblockchain-tls-chain.pem # EC2インスタンスからhfc-key-storeフォルダを取得 > scp -r -i [EC2インスタンス用のpemファイルパス] [email protected]:/home/ec2-user/fabric-samples/fabcar/hfc-key-store ./hfc-key-store
実装
今回はブロックチェーンネットワークのステートDBから情報を取得する実装を行います。 下記記事でも利用しているquery.jsをAWS Lambdaで実行できるように編集しました。
Amazon Managed Blockchainで作成したブロックチェーンネットワークにHyperledger Fabric SDK for Node.jsでアクセスしてみる – Qiita https://cloudpack.media/47382
handler.jsはquery.jsのメソッドを呼び出し結果を返す実装にしました。
> cd fabric-app > tree -F -L 1 . . ├── handler.js ├── hfc-key-store/ ├── managedblockchain-tls-chain.pem ├── node_modules/ ├── package-lock.json ├── package.json ├── query.js └── serverless.yml
handler.js
var query = require('./query'); module.exports.hello = async (event) => { var result = await query.run(); return { statusCode: 200, body: JSON.stringify({ message: JSON.parse(result), input: event, }, null, 2), }; };
実装のポイントは下記となります。
証明書フォルダhfc-key-store を/tmp にコピーして利用
module.exports.run = async () => {} でhandler.jsから呼び出し可能にする
async/await で同期的に実行する
query.js
'use strict'; /* * Copyright IBM Corp All Rights Reserved * * SPDX-License-Identifier: Apache-2.0 */ /* * Chaincode query */ var Fabric_Client = require('fabric-client'); var path = require('path'); var util = require('util'); var os = require('os'); var fs = require('fs-extra'); // var fabric_client = new Fabric_Client(); // setup the fabric network var channel = fabric_client.newChannel('mychannel'); var peer = fabric_client.newPeer('grpcs://nd-xxxxxxxxxxxxxxxxxxxxxxxxxx.m-xxxxxxxxxxxxxxxxxxxxxxxxxx.n-xxxxxxxxxxxxxxxxxxxxxxxxxx.managedblockchain.us-east-1.amazonaws.com:30003', { pem: fs.readFileSync('./managedblockchain-tls-chain.pem').toString(), 'ssl-target-name-override': null}); channel.addPeer(peer); // var member_user = null; var store_base_path = path.join(__dirname, 'hfc-key-store'); var store_path = path.join('/tmp', 'hfc-key-store'); console.log('Store path:'+store_path); var tx_id = null; // create the key value store as defined in the fabric-client/config/default.json 'key-value-store' setting module.exports.run = async () => { // 証明書ファイルを/tmp ディレクトリにコピーして利用する fs.copySync(store_base_path, store_path); console.log('Store copied!'); return await Fabric_Client.newDefaultKeyValueStore({ path: store_path }).then((state_store) => { // assign the store to the fabric client fabric_client.setStateStore(state_store); var crypto_suite = Fabric_Client.newCryptoSuite(); // use the same location for the state store (where the users' certificate are kept) // and the crypto store (where the users' keys are kept) var crypto_store = Fabric_Client.newCryptoKeyStore({path: store_path}); crypto_suite.setCryptoKeyStore(crypto_store); fabric_client.setCryptoSuite(crypto_suite); // get the enrolled user from persistence, this user will sign all requests return fabric_client.getUserContext('user1', true); }).then((user_from_store) => { if (user_from_store && user_from_store.isEnrolled()) { console.log('Successfully loaded user1 from persistence'); member_user = user_from_store; } else { throw new Error('Failed to get user1.... run registerUser.js'); } // queryCar chaincode function - requires 1 argument, ex: args: ['CAR4'], // queryAllCars chaincode function - requires no arguments , ex: args: [''], const request = { //targets : --- letting this default to the peers assigned to the channel chaincodeId: 'fabcar', fcn: 'queryAllCars', args: [''] }; // send the query proposal to the peer return channel.queryByChaincode(request); }).then((query_responses) => { console.log("Query has completed, checking results"); // query_responses could have more than one results if there multiple peers were used as targets if (query_responses && query_responses.length == 1) { if (query_responses[0] instanceof Error) { console.error("error from query = ", query_responses[0]); } else { console.log("Response is ", query_responses[0].toString()); return query_responses[0].toString(); } } else { console.log("No payloads were returned from query"); } }).catch((err) => { console.error('Failed to query successfully :: ' + err); }); };
serverlessの設定
AWS LambdaでVPC内配置されるようにserverless.yml を編集します。 vpc やiamRoleStatements の定義については下記が参考になりました。 セキュリティグループとサブネットはAmazon Managed Blockchainで構築したブロックチェーンネットワークと同じものを指定します。
ServerlessでLambdaをVPC内にデプロイする – Qiita https://qiita.com/70_10/items/ae22a7a9bca62c273495
serverless.yml
service: fabric-app provider: name: aws runtime: nodejs8.10 iamRoleStatements: - Effect: "Allow" Action: - "ec2:CreateNetworkInterface" - "ec2:DescribeNetworkInterfaces" - "ec2:DeleteNetworkInterface" Resource: - "*" vpc: securityGroupIds: - sg-xxxxxxxxxxxxxxxxx subnetIds: - subnet-xxxxxxxx - subnet-yyyyyyyy functions: hello: handler: handler.hello events: - http: path: hello method: get
AWS Lambdaにデプロイする
> sls deploy Serverless: Packaging service... Serverless: Excluding development dependencies... Serverless: Uploading CloudFormation file to S3... Serverless: Uploading artifacts... Serverless: Uploading service fabric-app.zip file to S3 (40.12 MB)... Serverless: Validating template... Serverless: Updating Stack... Serverless: Checking Stack update progress... .............. Serverless: Stack update finished... Service Information service: fabric-app stage: dev region: us-east-1 stack: fabric-app-dev resources: 10 api keys: None endpoints: GET - https://xxxxxxxxxx.execute-api.us-east-1.amazonaws.com/dev/hello functions: hello: fabric-app-dev-hello layers: None Serverless: Removing old service artifacts from S3...
デプロイができたらエンドポイントにアクセスしてみます。
> curl https://xxxxxxxxxx.execute-api.us-east-1.amazonaws.com/dev/hello { "message": [ { "Key": "CAR0", "Record": { "make": "Toyota", "model": "Prius", "colour": "blue", "owner": "Tomoko" } }, { "Key": "CAR1", "Record": { "make": "Ford", "model": "Mustang", "colour": "red", "owner": "Brad" } }, (略) ], "input": { "resource": "/hello", "path": "/hello", "httpMethod": "GET", (略) } }
はい。 無事にAWS Lambda関数からHyperledger Fabric SDK for Node.jsを利用してブロックチェーンネットワークにアクセスすることができました。
VPC内にLamnbda関数を配置する必要があるため、ENI(仮想ネットワークインターフェース)の利用に伴う制限や起動速度に課題が発生するかもしれませんので、実際に利用する際には負荷検証などしっかりと行う必要がありそうです。
AWS LambdaをVPC内に配置する際の注意点 | そるでぶろぐ https://devlog.arksystems.co.jp/2018/04/04/4807/
参考
Amazon VPC 内のリソースにアクセスできるように Lambda 関数を構成する – AWS Lambda https://docs.aws.amazon.com/ja_jp/lambda/latest/dg/vpc.html
Serverless – The Serverless Application Framework powered by AWS Lambda, API Gateway, and more https://serverless.com/
Amazon Managed BlockchainでHyperledger Fabricのブロックチェーンネットワークを構築してみた – Qiita https://cloudpack.media/46963
Amazon Managed Blockchainで作成したブロックチェーンネットワークにHyperledger Fabric SDK for Node.jsでアクセスしてみる – Qiita https://cloudpack.media/47382
AWS Lambda ランタイム – AWS Lambda https://docs.aws.amazon.com/ja_jp/lambda/latest/dg/lambda-runtimes.html
ServerlessでLambdaをVPC内にデプロイする – Qiita https://qiita.com/70_10/items/ae22a7a9bca62c273495
AWS LambdaをVPC内に配置する際の注意点 | そるでぶろぐ https://devlog.arksystems.co.jp/2018/04/04/4807/
元記事はこちら
「AWS LambdaとHyperledger Fabric SDK for Node.jsを利用してAmazon Managed Blockchainのブロックチェーンネットワークにアクセスする」
June 11, 2019 at 02:00PM
0 notes