#laboratory BOD Meter
Text
BOD Meter
The BOD Metre is a tabletop unit that measures B.O.D. (biological oxygen demand) from 0 to 4000 mg/L. To prevent mercury column leakage poisoning, a simple and safe mercury pressure difference measuring method is adopted. Equipped with a high-end brand tiny thermal printer, it swiftly produces measurement process data and outcome data. When there is a power outage, the test data is automatically saved and the experimental procedure is started.
0 notes
Text
Medical Lab Equipment, Laboratory Equipments Repairing Services, Mumbai, India
Laboratory Equipments, Dehumidifiers, Weighing Scales, Low Temperature Bath, Hot Air Oven, Laboratory Autoclave, Humidity Control Oven, Stainless Steel Autoclave, Hot Air Oven, Tray Dryers, Bod Incubator, Bacteriological Incubator, Stability Chamber, Humidity Oven, Laminar Air Flow, Biosafety Cabinet, Muffle Furnace, Orbital Shaker Incubator, Rotary Shaker, Deep Freezer, Fume Chamber, Autoclave, High Temperature Industrial Furnace, Viscometer Water Bath, Vacuum Oven, Clean Room Equipment, Blood Bank Refrigerator, Spectrophotometer, Ultrasonic Cleaners, Uv Cabinet, Dry Bath, Uv Inspection Cabinet, Vacuum Pumps, Colony Counter, Ph Meter, Conductivity Meter, Probe Type Ultrasonic Cleaner, Mumbai, India.
Aditi Associate : Supplier of Medical Lab Equipment, Laboratory Equipments Repairing Services, Mumbai, India.
0 notes
Text
Bod-Refrigerators-Incubator
The BOD incubator is designed to determine the biological oxygen demand and incubate the samples at a temperature of 20 degrees Celsius. The BOD incubator device is used to place the BOD meter device inside it and measure the amount of BOD. In the BOD incubator, controlled temperature conditions can be provided to accelerate tests and experiments.It should be explained that measuring the amount of BOD is an experimental test in which standard laboratory methods are used to check the biochemical oxygen requirement of microbes in wastewater and polluted water. Simply put, this test is a chemical process that determines how quickly biological organisms use the oxygen in the water. On the other hand, it measures the oxygen needed for the biochemical decomposition of organic materials (carbon) and the oxygen used for the oxidation of minerals such as sulfides and iron compounds at a pH of 6.5 to 7.5.
FALC Italy company has designed and produced its BOD incubator in two models, FTF 180 and FTF 220, in different sizes. From the specifications of FALC Italy BOD incubators, we can mention temperature control through PID microprocessor and PT100 temperature sensor. The outer body of the device is a steel sheet covered with proxy powder. Applications of the BOD incubator of FALC Italy:
To measure the volume of waste dumped into the environment and evaluate the efficiency of BOD removal by treatment systems. It measures the amount of molecular oxygen used during a specific incubation period for the biochemical degradation of organic matter (carbon) and the oxygen used for the oxidation of minerals such as sulfate and iron and carbonaceous compounds. It measures the oxygen used for the oxidation of nitrogen forms, unless their oxidation is inhibited by an inhibitor.
0 notes
Text
The Ultimate Asbestos Removal Planning Guide
Today, people are learning about asbestos and how it can affect their health. However, back in the 1950s and 60s, Asbestos was widely used as a building material. Because of this, many homes had asbestos roofing material that leaked asbestos into the soil below. This chemical mixture eventually took root in the ground and formed coal tar known as Asbestosis. This article explains everything you need to know about Asbestos and its effects on your health. We’ll answer common questions like “What is Asbestos Removal?”, “Where does it come from?” and “Is it dangerous?” You can also find out the types of home remedies that work against Asbestos. For example, you might want to call a friend or family member who lives near where you live for a second opinion about whether or not an area of your home is safe to take off your shoes when you enter it for the first time after an exorcism ritual.
What is Asbestos?
Asbestos is a mineral known to form fibrous materials that are harmful to human health if overexposure. The main source of asbestos is mined, but other types of rock also contain small amounts of asbestos. It is found in many different types of rock, including limestone, granite, dolomite (another type of carbonate rock), sandstone, and shale. It is naturally occurring in some types of sedimentary rock, like sand and gravel. Asbestos is a type of polymeric mineral that can be crystalline, amorphous or mixed with other minerals. It can also be found in a variety of different forms and combinations, including fiber, rock, and soil.
Where does Asbestos Come From?
Asbestos is not created in the laboratory. It is found in nature and is the result of natural processes. The most common place where Asbestos comes from is mines. Some of the mines where Asbestos is found are in the Czech Republic, Poland, and the United States. There are many different types of mines where Asbestos is found. Some mines produce only ore that is then processed into galena (lead ore), while others produce ores that contain both lead and asbestos. Some mines produce both asbestos and gold, while others only produce lead. Grossly speaking, the asbestos component of a mine’s mine tailings can be found in three different zones. The topmost tailings zone is the immediate mine surface and contains the most asbestos, while the middle zone is several meters below the surface and contains the majority of the asbestos. The lowest tailings zone is located several kilometers away and contains only trace amounts of the mineral.
Is Asbestos Dangerous?
Asbestos is a mined mineral that contains dangerous amounts of stay. When inhaled or ingested, the mineral reacts with super heated air to form Asbestin trioxide, a white crystalline substance that is highly toxic. Unfortunately, Asbestin trioxide is a known human carcinogen and can cause Asbestosis, a condition characterized by fibrosis and inflammation of the lungs. The condition can also be accompanied by an increase in your blood pressure, alveolar hemorrhage (a condition in which your lungs rupture and bleeding occurs inside the walls of your alveoli), and even death. Symptoms of Asbestosis include an abnormal breathing sound called wheezing, chest tightness, and an increase in your blood pressure. These symptoms can be pretty scary so it’s a good idea to get a second opinion if you think you have Asbestosis.
How Asbestos Can Impact Your Health
Asbestos can cause a number of health problems, some of which you may be experiencing right now. The main concerns with Asbestos are its effects on the nervous system and the endocrine system. With the possible exception of certain types of cancer, an effects-of-asbestos-in-our-health-system article would have to be written for each type of cancer that is associated with asbestos. The best we can do is list a few of the most common symptoms and effects of asbestos in humans. When the body’s immune system is activated against a foreign object such as a bacteria or a virus, the body’s inflammatory cells produce antibodies that attack normal cells in the body. These abnormal cells are called “self-harming” cells. Asbestos is a type of mineral that is the by-product of certain minerals’ transformation from lava rock to the solid state. Asbestos happens to be a type of volcanic rock. Thus, when lava rock cools, it turns to rockcrete, which is packed with minerals. The most common of these minerals is asbestos.
How to Achieve the Best Results When Exorcising an Area Containing Asbestos
If you know you have an area of your home or building that contains asbestos, the first step is to know what to expect. In some cases, all you need to do is wear a mask and gloves when you enter the room or area and you will get the results you are looking for. However, most cases require a little more effort. Here are a few steps you can take to ensure a successful exorcism. Identify the Asbestos When an area of your home or building contains asbestos, the first step is to know what type of asbestos it is. The American Occupational Safety and Health Administration (OSHA) has a list of 86 different types of asbestos. Although most types of asbestos are not toxic to humans, you should always take extra caution when handling them. You should never dust, brush, sweep, or sweep away minerals that look like asbestos. Instead, wear gloves and a mask when you handle these materials. Remove and Dispose of Any Contained Mines Once you know what type of asbestos is present in an area, the next step is to remove it and dispose of it properly. If the mineral is loose in soil or rock, you can either dig it up and remove it or use a device called a wire-meshingagger to remove it from the ground. If the mineral is embedded in concrete, you will likely have to remove the concrete and any encasements made of concrete. You can either remove the asbestos and the concrete or leave it in place and remove the asbestos later on. If you choose to remove the concrete, you should never mix soil or rock with it, as this will cause an increase in the amount of asbestos in the soil and groundwater. You should also never place any equipment or machinery that you do not intend to use in an area where asbestos is present.
Should You Remove as much Asphere as Possible Before Removing the Roof Over It?
Some roofers remove the entire roof over an area that contains asbestos. This removal is sometimes referred to as “asbestos removal.” The decision to remove the roof over an area that contains asbestos is a very personal matter. There are no set rules when it comes to deciding whether or not to remove a roof. The only rule of thumb is that the roof should be removed as much as possible before removing the structure itself. However, there are a few things you should keep in mind before removing the roof. First, once you remove a roof, you will probably have to replace it. This process can be very expensive and time-consuming. The second reason to remove the roof over an area that contains asbestos is to protect your health. The fumes from a roofing material can remain in the air for years after the roof is removed. Depending on the degree of insulation in your home or the climate where you live, these fumes could reach levels that cause health problems.
Conclusion
Asbestos is a naturally occurring mineral that can be found in many different types of rock. It is a known human carcinogen and can cause Asbestosis, a condition characterized by fibrosis and inflammation of the lungs. It can also cause an increase in your blood pressure, alveolar hemorrhage (a condition in which your lungs rupture and bleeding occurs inside the walls of your alveoli), and even death. Keep in mind that every time you hire a roofer, contractor, or mason, you are taking a risk. Make sure they are properly licensed and used proper safety equipment when performing work on your home. If in doubt, always ask a friend or family member who lives near where you live for a second opinion about whether or not an area of your home is safe to take off your shoes when you enter it for the first time after an exorcism ritual.
0 notes
Text
Application of Moving Bed Biofilm Reactor (MBBR)
This review paper present the MBBR and IFAS technology for urban river water purification including both conventional methods and new emerging technologies. The aim of this paper is to present the MBBR and IFAS technology as an alternative and successful method for treating different kinds of effluents under different condition. There are still current treatment technologies being researched and the outcomes maybe available in a while. The review also includes many relevant researches carried out at the laboratory and pilot scales. This review covers the important processes on MBBR and IFAS basic treatment process, affecting of carrier type and influent types. However, the research concluded so far are compiled herein and reported for the first time to acquire a better perspective and insight on the subject with a view of meeting the news approach. The research concluded so far are compiled herein and reported for the first time to acquire a better perspective and insight on the subject with a view of meeting the news approach. To this end, the most feasible technology could be the combination of advanced biological process (bioreactor systems) including MBBR and IFAS system.
The BioCellTM media are suitable for a moving bed biofilm reactor (MBBR) system to provide a self-shedding, self-regulating growth biofilm treatment process. The media can be used for MBBR treatment alone or as an integrated fixed membrane activated sludge (IFAS) process to enhance the effective capacity of existing activated sludge systems.
The BioCellTM medium used in MBBR media or IFAs is a continuous motion caused by air injection and agitator. Specific density of the media can be adjusted between 0.95-1.05 g/cm3 according to customer requirements. However, it should be considered that with the formation of biofilm on the surface of the medium, the actual density of the carrying media will increase.
The main characteristic of Moving Bed Biological Reactor (MBBR) configurations is that there is no sludge recycle from a secondary clarifier. MBBR is essentially a simple, once-through process, where all of the biological activity takes place on the biomass carriers. MBBR is usually followed by a solids separation system such as a secondary clarifier or DAF, in order to separate bio-solids produced in the process from the final effluent. The main advantage of MBBR is robust and simple reduction of soluble pollutants (soluble BOD or COD, NH4 +, etc.), with minimal process complexity, utilizing a significantly smaller footprint when compared to conventional aerobic treatment methods. MBBR is typically used for either high load industrial applications or for robust simple-to-operate municipal facilities.
The Integrated Fixed-film Activated Sludge (IFAS) process combines the advantages of conventional activated sludge with those of biofilm systems by combining the two technologies in a single reactor. Typically, an IFAS configuration will be similar to an activated sludge plant (utilizing all of the different process configurations such as MLE, UCT, Bardenpho, etc.), with biomass carriers introduced into carefully selected zones within the activated sludge process. This allows two distinct biological populations to act synergistically, with the MLSS degrading most of the organic load (BOD), and the biofilm creating a strongly nitrifying population for oxidation of the nitrogenous load (NH4+). IFAS is typically used to upgrade existing plants in order to enable extensive Nitrogen removal, or in designing new plants with significantly smaller footprints for extensive BOD and Nitrogen removal.
The diffuser is the special design for MBBR bio carrier media aeration system. The coarse-bubble design is employed to mix the suspended media evenly throughout the reactor while providing the mixing energy required to slough old biofilm from the internal surface area of the media and maintain the dissolved oxygen required to support the biological treatment process.
Coarse bubble diffuser is made of stainless steel (SUS304 or SUS316L is optional).The coarse bubble diffuser provides maximum aeration and mixing efficiency.The standard length of diffuser is 600 mm. A 600mm long diffuser can achieve a 1250mm air release circumference.It has a service life of over 15 years.
The dissolved air flotation(DAF) system is designed to remove suspended solids(TSS), biochemical oxygen demand (BOD5), and oils and greases (O&G) from wastewater. Contaminants are removed by using a dissolved aqueous solution of water produced by injecting air into the recirculating stream of clear DAF effluent under pressure. The recycle stream is then mixed with the upcoming wasterwater in the internal contact chamber. Air bubbles and contaminants rise to the surface and form a floating bed material that is removed by a surface skimmer into the internal hopper for further processing.
The initial section of dewatering drum is the Thickening Zone, where the solid-liquid separating process takes place and where the filtrate will also be discharged. The pitch of the screw and the gaps between the rings decrease at the end of dewatering drum, hence increasing its internal pressure. At the end, the End Plate further increases the pressure, so as to discharge dry sludge cake.
Albe Advance Group is the leading industrial water treatment solution provider in Malaysia with decades of experience in providing quality water treatment solutions. We prioritise in providing our clients with a one-stop water treatment centre for industrial water treatment project and services. Having doubts on industrial water treatment qualities? Contact us and let our skilled professionals provide you with a consultation in water treatment program.
In traditional activated sludge plants, biomass form flocks are kept suspended in wastewater and then separated from treated water in a settler; most biomass is re-circulated to the biological tanks, the excess is extracted and sent to sludge treatment.
Luigi Falletti, University of Padova
This technique is the most widespread and well known in the world to treat biodegradable municipal and industrial wastewater (including paper mill wastewater); but it has also disadvantages: it requires large tanks, and pollutant removal efficiency is strongly affected by sludge settleability.
In moving bed biofilm reactors (MBBR) biomass grows as biofilm on plastic carriers that move freely into wastewater; tanks are similar to activated sludge reactors, and they have screens or sieves to avoid carriers’ loss; aerated reactors are mixed by aeration itself, while anoxic and anaerobic reactors are mixed mechanically. MBBR can be classified into two categories:
pure biofilm reactors: biomass grows only on carriers without suspended sludge and without sludge recirculation;
hybrid reactors: in the same tank biomass grows both as biofilm on carriers and as suspended sludge; part of sludge is re-circulated.
MBBR have several advantages if compared to traditional activated sludge tanks and to fixed biofilm reactors (trickling filters, submerged biofilters):
-biofilm has high specific activity, therefore high pollutant removal efficiencies can be achieved with smaller tanks than the ones required by activated sludge;
-in plants with a series of MBBR a specialized biomass grows in each tank;
–risk of clogging with MBBR is much lower than with fixed biofilm reactors, no backwashing is required since biofilm in excess is detached from carriers by reactor turbulence itself, and can be separated from treated water by settling or flotation;
-this technology is very flexible in plant conduction: in pure biofilm reactors, the filling degree can be varied according to process requirements, in hybrid reactors also sludge recirculation rate can be varied.
Several kinds of carriers are used in MBBR: they can be classified according to material, shape, porosity, dimensions, specific surface. Among these characteristics, specific surface is particularly important: it represents the surface which is available for biofilm growth pr. cubic meter carriers. For each kind of carrier, part of specific surface is protected and the remaining part is external; biofilm grows almost only on protected surface, because external surface is exposed to collisions among carriers and against reactor walls; so the effective specific surface is only a protected one. First biofilm growth on carriers requires some weeks; bacteria produce surfactant substances, so some scum can be observed during the first days in plant starting [1, 2, 3, 4].
Carriers can be introduced in MBBR in variable amounts: filling degree is the ratio between the carriers’ apparent volume and the tank volume, and it can vary from zero to a maximum value that depends on the carriers’ characteristics. With higher filling degree, total biofilm surface and pollutant removal efficiency increase, but higher mixing energy is required. The most widespread carriers are made of polyethylene or polypropylene, their density is about 0.95, and usual filling degrees’ range is 30–60%; the characteristics of some kinds of carriers produced by AnoxKaldnesTM Company are listed in table 1.
Possible configurations
Mbbr sewage treatment can be applied for wastewater treatment in several plant configurations:
1. pure MBBR biofilm before an activated sludge plant: this solution is common for concentrated wastewater treatment;
2.upgrading of overloaded activated sludge plants by conversion into hybrid MBBR;
3.tertiary biological treatment by pure biofilm MBBR after an activated sludge plant;
4.complete biological treatment by series of MBBR: pre-denitrification, oxidation, nitrification, post-denitrification.
MBBR have been and are applied to treat municipal wastewater [5, 6, 7, 8, 9] and industrial wastewater including paper mills [10, 11, 12], winery [13] and dairy [14]. This paper deals with the results of some European full-scale plants with MBBR for paper mill wastewater treatment.
Industry nr. 1 produces about 18.000 m3d-1 wastewater with 2.500–3.500 mg/L COD. The wastewater treatment plant (picture 1) is made of a coarse screen, a primary settler, a fine screen, a cooling system, dosage of nutrients (nitrogen and phosphorus salts), a biological section and a final clarifloculation. The biological section has a first aerated pure biofilm MBBR filter media with 2.500 m3 volume filled with 40% NatrixTM – O carriers, an activated sludge oxidation tank with 7.500 m3 volume and sludge concentration 4-6 kgSSTm-3, and a secondary settler. The plant must remove at least 90% of COD, 99% of BOD5; maximum pollutant concentrations in final effluent are: TSS < 50 mg/L, tot-N < 4.7 mg/L, P < 0.3 mg/L.
On average basis, the plant has treated an effective organic load of 59.000 kgCODd-1, the first MBBR has removed 51% of COD and the following activated sludge oxidation tank has removed 75% of remaining COD; the whole plant has removed 90% COD and has always respected emission limits.
Industry nr. 2 produces about 18.000 m3d-1 wastewater with 2.000-2.500 mg/L COD. The wastewater treatment plant (picture 2) is made of a cooling system, dosage of nutrients (nitrogen and phosphorus salts), pH correction and a biological section. The biological section is made of two serial aerated pure biofilm MBBR with 1.900 m3 volume each filled with 20% NatrixTM – O carriers, an activated sludge oxidation tank with 10.000 m3 volume and sludge concentration 2-5 kgSSTm-3, and a final settler. The plant must remove at least 70% COD, 50% total nitrogen and 50% total phosphorus; moreover, maximum TSS concentration in final effluent is 30 mg/L.
On average basis, the plant has treated an effective organic load of 38.000 kgCODd-1, the two MBBR have removed 35% COD, the whole plant has removed 70% COD and has always respected emission limits.
Industry nr. 3 produces 2.800 m3d-1 wastewater 800-1.300 mg/L COD. The wastewater treatment plant (picture 3) is made of an equalization tank with 600 m3 volume, a primary settler (with fiber recovery), dosage of nutrients (nitrogen and phosphorus salts) and a biological section. The biological section is made of a pure biofilm aerated MBBR with 500 m3 volume filled with 68% AnoxKaldnesTM – K1 carriers, and a secondary settler with polyelectrolyte dosage. Maximum pollutant concentrations in final effluent are: TSS < 35 mg/L, COD < 160 mg/L, BOD5< 40 mg/L.
On average basis, the biological section has treated an effective organic load of 2.660 kgCODd-1, and has removed 90% COD; the final effluent has always respected emission limits.
0 notes
Text
Juniper Publishers- Open Access Journal of Environmental Sciences & Natural Resources
Evaluation and Characterization of Tannery Waste Water in Each Process at Batu and Modjo Tannery, Ethiopia
Authored by Abdrie Seid Hassen
Abstract
The leather industry is suffering from the negative impact generated by the pollution it causes to the environment. Nearly 70% of the pollution loads of BOD, COD, and Total Dissolved Solids (TDS) are generated from soaking, liming, deliming, pickling and tanning and retanning processes. There is an enormous pressure from the various pollution control bodies to regulate and minimize the amount of pollution generated from the leather processing. The need for use of alternative to chemical methods to combat pollution problem have become necessary to protect the industry and to comply with the environmental norms. In the present study, effluent samples were collected from Batu and Modjoa tannery in Ethiopia. The effluent samples were collected from all stages of processing viz., soaking, liming, deliming, pickling, Chrome tanning and Retaining. The physicochemical parameters of the tannery effluent viz. pH, alkalinity, acidity, biochemical oxygen demand (BOD5), chemical oxygen demand (COD), total solids (TS), total dissolved solids (TDS), suspended solids (SS), chlorides and sulfides were determined. All the parameters included in this study are found to be higher than the prescribed discharge limits for tannery industries. The investigation of the tannery wastewater from different tanning processes gave a number of conclusions. The results indicate that the wastewaters from the tanneries do not satisfy the legal ranges of selected parameters discharge to inland water and to sewer.
Keywords: Alkalinity; Acidity; COD; BOD; Tannery Waste Water; Sulfides; Chlorides
Abbreviations: COD: Chemical Oxygen Demand; TS: Total Solids; TDS: Total Dissolved Solids; SS: Suspended Solids; BOD: Biochemical Oxygen Demand
Introduction
The tanning process aims to transform skins in stable and imputrescible products namely leather. There are four major groups of sub-processes required to make finished leather: beam house operation, tanyard processes, retanning and finishing [1-3]. However for each end product, the tanning process is different and the kind and amount of waste produced may vary in a wide range [2,4]. Traditionally most of tannery industries process all kind of leathers, thus starting from dehairing to retanning processes. However, in some cases only pre-pickled leather is processed with a retanning process. Acids, alkalis, chromium salts, tannins, solvents, sulfides, dyes, auxiliaries, and many others compounds which are used in the transformation of raw or semi-pickled skins into commercial goods, are not completely fixed by skins and remain in the effluent. For instance, the present commercial chrome tanning method gives rise to only about 50-70% chromium uptake [5]. During retanning procedures, synthetic tannins (Syntan), oilsand resins are added to form softer leather at varying doses [6]. One of the refractory groups of chemicals in tannery effluents derives mainly from tannins [7]. Syntans are characterized by complex chemical structures, because they are composed of an extended set of chemical such as phenol, naphthalene formaldehyde and melamine-based Syntans, and acrylic resins [8-10].
Among Syntans, the ones based on sulfonatednaphthalene's and their formaldehyde condensates play a primary role, for volumes and quantity used in leather tanning industry. The oils cover the greater COD equivalents compared to the resins and syntans. The BOD5/COD ratio of syntans was also lower than other compounds. A brief description about the wastes generated from a tannery and their impact on the environment would be appropriate to understand the problem associated with it. The beam house operations soaking, liming and deliming lead to discharge of high amount of sulfides, lime, and ammonium m salts, chlorides, sulphate, and protein in the effluent. Consequently, the wastewater is characterized with high amount of BOD and COD. Soak liquor contains, suspended solids, dirt, dung, blood adhering to hides and skins, and chloride etc. lime liquors are highly alkaline. This stream contains suspended solids, dissolved lime, sodium sulfide, high ammonia cal nitrogen and organic matter. Unhearing and fleshing effluent contains fatty fleshing matter in suspension. The spent deliming liquors carry significant BOD load. The spent bate liquors on account of presence of soluble skin proteins and ammonium salts containing high organic matter. Pickle liquors are acidic and contain high amount of salt.
The spent chrome liquors contain high concentration of chrome compounds and neutral salts. The wastewater from neutralization, retanning, dyeing and fat liquoring sections contribute little pollution load [11]. Solvents and this leads to the emission of volatile organic compounds (VOC) [12]. An average of 30-35m3 of wastewater is produced per ton of raw hide. However, wastewater production varies in wide range (10-100 m3 per ton hide) depending on the raw material, the finishing product and the production processes [2]. Organic pollutants (proteic and lipidic components) are originated from skins (it is calculated that the raw skin has 30% loss of organic material during the working cycle) or they are introduced during processes. The objectives of this study to evaluate thephysico-chemical properties of polluted water discharged from tannery, viz., pH, chloride, sulfide BOD5, COD, alka linity, T.S.S, TDS and evaluate of tannery wastewater in the different tanning processes viz. soaking, liming and unhairing, deliming and bating, pickling, tanning and retanning processes [13,14].
Materials and Methods
Materials
For the present study effluent samples were collected from tanneries in Batu and Modjo, Ethiopia. The effluent samples were collected from all stages of tanning processing viz., soaking, liming, deliming, pickling, Chrome tanning and Retanning. The effluent was collected in polythene containers of two litres capacity and were brought to the laboratory with due care and was stored at 4oC for further analysis. Chemicals used for the analysis of spent liquor were analytical grade reagents. The physical and chemical characteristics of tannery effluents parameters viz. pH, total alkalinity, COD, BOD5, total solids (TS), total dissolved (TDS); total suspended solids (TSS), chlorides, sulfide sand chromium were analyzed as per standard procedures [15].
Methods
Determination of pH: The pH is determined by measurement of the electro motive force (emf) of a cell comprising of an indicator electrode (an electrode responsive to hydrogen ions such as glass electrode) immersed in the test solution and a reference electrode (usually a calomel electrode). Contact is achieved by means of a liquid junction, which forms a part of the reference electrode. The emf of this cell is measured with pH meter.
Determination of total alkalinity: The alkalinity of sample can be determined by titrating the sample with sulphuric acid or hydrochloric acid of known value of pH, volume and concentrations. Based on stoichiometry of the reaction and number of moles of sulphuric acid or hydrochloric acid needed to reach the end point, the concentration of alkalinity in sample is calculated. A known volume of the sample (50 ml) is taken in a beaker and a pH probe was immersed in the sample. HCl or H2SO4 acid (0.1NHCl in 1000 ml distilled water) added drop by drop until the pH of the sample reached 3.7. The volume of the acid added was noted [15].
Calculation: Alkalinity as mg/l of CaCO3= (50000x N of HClx ml acid titrated value) /volume of sample taken.
Determination of chemical oxygen demand (COD): The chemical oxygen demand of an effluent means the quantity of oxygen, in milligram, required to oxidize or stabilize the oxidizable chemicals present in one litre of effluent under specific condition. 2.5 ml of the sample was taken in tube, 1.5 ml of 0.25 NK2Cr2O7(potassium dichromate), spatula of mercuric sulphate HgSO4 and 3.5 ml of COD acid were added and kept in COD reactor for 2hrs at 150oC. After cooling the sample titrated against FAS (standard ferrous ammonium sulfate 0.1N) and used ferrion as indicator. The end point is reddish brown color. In the blank tube 2.5 ml of distilled water was taken and then follow the same procedure in the sample [15].
Calculation: COD (mg/l) = (blank value-titrated value) xN of FASx8000/ volume of sample
8000 ill equivalent wt of O2x1000ml
Determination of biochemical oxygen demand (BOD): Biochemical oxygen demand (BOD) of an effluent is the milligram of oxygen required to biologically stabilize one litre of that effluent (by bio-degradation of organic compounds with the help of micro-organisms) in 5 days at 4oC.If the BOD value of an effluent is high, is high, then that effluent contains too much of bio-degradable organic compounds and so will pollute the receiving water highly.
A. Procedure
a) Take 5 litres of distilled water, aerated for 3.5 hours, added nutrients 1 ml nutrient for 1 litre aerated distilled water (FeCl, CaCl2, PO4, MgSO4, domestic water), aeration for 30 minutes.
b) BOD bottle (300 ml), add sample, fill the bottle with aerated water, put the lid (avoid air bubbles), keeping BOD incubator at 20oC for 5 days, after 5 days take the bottle and add 2 ml MnSO4, 2 ml alkaliazide iodide and 2 ml conc. H2SO4. Shake the bottle well (yellow colour) take 200 ml sample add starch solution as indicator (purple colour) titrated with 0.025 N sodium thiosulphateend point colour change from purple to colorless. In blank filled the bottle with aerated water without the sample and follow the procedure [15].
c) Calculation
BOD5= (blankvaluetitratedvalue) x300/volume of sample
Determination of Total solid: The term solid refers to the matter either filtrable or non-filtrable that remains as residue upon evaporation and subsequent drying at a defined temperature. Residue left after the evaporation and subsequent drying in oven at specific temperature 103-105°C o f a known volume of sample are total solids. Total solids include Total suspected solids (TSS) and Total dissolved solids (TDS).
A. Procedure
Dry weight of empty dish or crucible (initial weight), add 50 ml sample, keep it in water bath until dry, keep it in oven (103 to 105oC) for at least 1 hour, desiccators, and take final weight of dish [15].
a) Calculation
Total solid (mg/l) = (final weight-initial weight) x1000x1000 / volume of sample
Determination of total dissolved solid
A. Procedure
Dry weight of empty dish or crucible (initial weight) take sample and filter with What man No.1, add 50 ml filtrate sample, keep it in water bath until dry, keep it in oven (103 to 105oC) for at least 1 hour, desiccators, take final weight of dish [15].
a) Calculation
Total dissolved solid (mg/l) = (final weight-initial weight) x1000x1000 / volume of sample
Determination of total suspended solid: The difference between the total solids and total dissolved solids are suspended solids.
TSS = TS-TDS
Determination of chloride: Chloride is determined in a natural or slightly alkaline solution by titration with standard silver nitrate, using potassium chromate as an indicator. Silver chloride is quantitatively precipitated before red silver chromate is formed.
A. Procedure: Take sample (10 ml to 50 ml), add 2 ml of hydrogen peroxide (H2O2), add 2 ml K2CrO4 (potassium chromate indicator), titrate with silver nitrate (0.0141 N), end point formation of reddish yellow colour (yellow to orange). In blank trial take distilled water instead of sample and follow the same procedure above [15].
a) Calculation
Chloride (mg/l) = (A-B)xN. of silver nitratex35.45x1000/ volume of sample
A = ml titration for sample
B = ml titration for blank
N = normality of AgNO3
Determination of sulfide: The sulfides in the solution are oxidized with an excess of a standard iodine solution and the excess back titrated with a standard thiosulfate solution.
A. Procedure: Take sample (10ml) in conical flask, add 5 ml zinc acetate (5%), filter through filter paper, take the filter paper and put it in the same conical flask, add 100 ml distilled water. then add 20 ml, iodine solution and 4 ml 6N HCl, add 2 drops of starch as indicator (purple colour will form), titrate against sodium thiosulphate (0.025N), end point the colour change from blue colour to colorless. In the blank test take 100 ml distilled water instead of sample and follow the same procedure above for the sample [15].
a) Calculation:
Sulfide (mg/l) =(BV-TV) x N. thiox400/Volume of sample xN. Ioden
BV= blank value
TV= titrated value
Results and Discussion
Characteristics of tannery waste water
Wastewater of each tannery process consists of pollution of varying pH values. Similarly, a large variation exists in every parameter BOD, COD, Chloride, Sulphate, etc. Discharge of these chemicals into wastewater is hazardous for the environment. Analysis of physical and chemical characteristics of the tannery wastewater collected from different tanning processes viz. soaking, liming and unhairing, deliming and bating pickling, chrome tanning and retaining are listed in (Tables 1 & 2) respectively.
Determination of pH
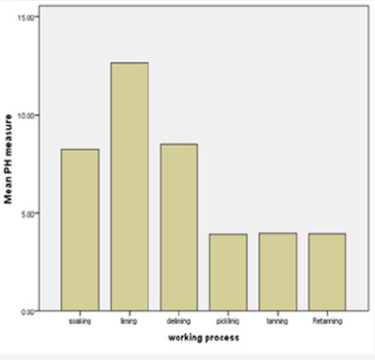
The pH values of both tanneries are in the range 3.2512.64. Which was very higher value compare to limit set by EPA (6.0-9)? The extreme pH of wastewater is generally not acceptable, as lower pH cause problems to survival of aquatic life. It also interferes with the optimum operation of wastewater treatment facilities. Water with high or low pH is not suitable for irrigation. At low pH most of the metals become soluble in water and therefore could be hazardous in the environment. At high pH most of the metals become insoluble and accumulate in the sludge and sediments. The toxicity of heavy metals also gets enhanced at particular pH [6].
Determination of Biochemical Oxygen
a) Demand (BOD): BOD is measure of the content of organic substances in the waste water which are biologically degradable with consumption of oxygen. Usually indicated as 5-day Biochemical oxygen demand (BOD). This is the amount of oxygen in milligrams per litre (O2) (mg/l) that consumed by microorganisms in5 days at 20oC for oxidation of the biologically degradable substances contained in the water. The results of present study revealed that BOD level from different tanning processes viz. soaking, liming and unhairing, deliming and bating pickling, chrome tanning and retanning is given in (Figures 1-4) indicating high organic load surpassed legal limit set by EPA (200 mg/l). The presence of organic matter will promote anaerobic action leading to the accumulation of toxic compounds in the water bodies.
Determination of Chemical Oxygen Demand (COD)
Chemical oxygen demand (COD) is quantity of oxygen expressed in milligram consumed by the oxidisable matter contained in one litre of the sample. The test is performed by vigorous oxidation with chemicals and back-titrating the chemical consumed for oxidation. COD is system of measuring the content of organic impurities with oxidizing agents. The results of present study revealed that COD level from different tanning processes viz. soaking, liming and unhairing, deliming and bating pickling, chrome tanning and retanning is given in (Figures 5 & 6) exceeds the permissible COD level EPA (500mg/l).This indicates that the effluent is unsuitable for the existence of the aquatic organisms, due to the reduction in the dissolved
Determination of Total Solids (TS)
The results of present study revealed that TS level from different tanning processes viz. soaking, liming and unhairing,deliming and bating pickling, chrome tanning and retanning is given in (Figures 7 & 8) exceeds the permissible TS level of 110 mg/L. These solid impurities cause turbidity in the receiving streams. The composition of solids present in tannery effluent mainly depends upon the nature and quality of hides and skins processed in the tannery.
Determination of Total Suspended Solids (TSS)
The results of present study revealed that TSS level from different tanning processes viz. soaking, liming and unhairing, deliming and bating pickling, chrome tanning and retanning is given in (Figure 6) and it exceed the permissible TSS level of (20200) mg/ L. These suspended impurities cause turbidity in the receiving streams. The composition of solids present in tannery effluent mainly depends upon the nature and quality of hides and skins processed in the tannery. High level of total suspended solids present in the tannery effluent could be attributed to their accumulation during the processing of finished leather. Presence of total suspended solids in water leads to turbidity resulting in poor photosynthetic activity in the aquatic system [16-18] and clogging of gills and respiratory surfaces of fishes [19].
Determination of Chloride
The results of present study revealed that chloride level from soaking and pickling, are 19250 mg/ l, 23500 mg/l respectively (Table 2) and the levels exceed the permissible chloride level of 1000 mg/L of effluent discharge into inland surface waters. High levels of chlorides in the tannery effluent could be attributed to the soaking and pickling processes. The chloride content in water sample gives an idea of the salinity of water sample.
Determination of Sulfide
Sulfides are particularly objectionable because hydrogen sulfide will be liberated if they are exposed to a low pH environmental, and if they are discharged into stream containing iron, black precipitates will be formed. Sulfides may be toxic to stream organisms or to organisms employed in biological treatment systems. The results of present study revealed that sulfide level from liming and unhairing process is given in Table 2 and it exceed the permissible sulfide level of 2 mg/ L. of effluent discharge into inland surface waters [13].
Determination of Total Alkalinity
Alkalinity of water is its acid neutralizing capacity. It is the sum of all the bases. The alkalinity of natural water is due to the salt of carbonates, bicarbonates, borates silicates and phosphates along with hydroxyl ions indeliming & bating process is given in (Tables 1 & 2). The Free State. However the major portion the alkalinity is due to hydroxides, carbonates and bicarbonates. The results of present study revealed that alkalinity level from soaking, liming and unhairing, and deliming process are given in (Figures 9-16).
Determination of hexavalent chromium
Cr is one of the most important pollutants released from the tanning industries in the effluent. According to Saritha and Meikandaan (2013) chrome tanning processes originates toxic metals and regular treatment systems are not eligible for the elimination of it. The wastewater generated by tanneries is the major source of Chromium pollution. The chromium (Cr) is well-known to be toxic to living organisms due to their bioaccumulation and non-biodegradable properties. In Tables 1 & 2 Maximum Cr concentrations was show at both tanneriesrespectively.This indicates that the concentration is above permissible limit of EPA (0.1mg/l).
All value except pH are stated Mg/l
Conclusion
The processing of hides and skins into leather is carried out in an aqueous medium m and hence the discharged water from pits, drums or paddles containing several soluble and insoluble constitutes the effluents from the tannery. In the present study, investigation of the tannery wastewater from different tanning processes gave a number of conclusions. Results of the analysis showed that the tannery wastewater from different tanning processes viz., soaking, liming and unhairing, declaiming and bating, pickling, chrome tanning and retanning is highly With a disagreeable pH, alkalinity, acidity, total solids, total dissolved solids, suspended solid, chemical oxygen demand, biochemical oxygen demand, chlorides and sulfides. The results of the analysis indicate that the wastewaters from different units of the tannery do not satisfy the legal ranges of selected parameters.
For more articles in Juniper Publishers | Open Access Journal of Environmental Sciences & Natural Resources please click on: https://juniperpublishers.com/ijesnr/index.php
#Juniper Publishers#Juniper Publishers PubMed Indexed Journals#Hydrology#Molecular Ecology#Environmental Chemistry#Ecological psychology
0 notes
Text
Quality of Cultured Shrimp from World Heritage Site of Indian Sundarbans in Context to Microbial Load- Juniper publishers
Abstract
Fecal coliform and Total coliform count were done in cultured Penaeusmonodon collected from two different islands of Indian Sundarbans namely Bali and Chotomollakhali during 2016. The count was higher in the shrimp sample, water and sediment collected from Chotomollakhali Island where the shrimps were not fed with feed containing additives (garlic extract). In Bali Island, the cultured shrimps were fed with feed containing additives (garlic extract) and seaweed based protein. This formulated natural feed not only boosted up the shrimp growth but also arrested the microbial load to a considerable level.
Go to
Introduction
The high population densities and activities often common in the coastal areas result in pollution and release of contaminated wastewater. Pathogenic microorganisms such as bacteria and viruses, abundant in human wastes [1] are often discharged into natural waters with little or no treatment [2]. Survival of microbes in waters depends on many parameters such as biological (interaction with other bacteria) and physical factors (temperature). Numerous studies have been carried out in coastal areas over long periods of time, demonstrating the various abiotic environmental conditions (fluxes, currents, presence of mud and silt etc.) due to which the distribution of microbes is affected. The under treated effluents from the coastal population and discharges from mismanaged aquaculture farms often pose an adverse impact on marine and estuarine species. Microorganisms discharged in coastal areas are accumulated in shellfish because of their filter feeding activity. The members like Salmonella sp., E.coli, Fecal coliform can multiply and survive in the estuarine environment for weeks [3]. Jimenze et al. [4] presented similar results on survival in tropical fresh water environments. The enterobacteriacea (Salmonella, Shigella, E. coli etc) are all occurring in the fish products as a result of contamination from the animal or human origin. This contamination has been normally associated with fecal contamination or pollution of natural waters or water environments, where these organisms survive for a long time (months) or through direct contamination of products during processing. Contamination of shellfish with Salmonella, E. coli, and Fecal coliform due to growth in polluted waters has been a problem in every parts of the world. In a recent review by Reily et al. [5], evidence is presented that farmed tropical shrimps frequently contain Salmonella. The case study of Bay of Bengal and its adjacent estuaries is no exception to this adverse process. In the entire Gangetic Plain, it is the river Hugli that is subject to heavy pollution load from the industrialized and highly urbanized cities of the Kolkata and Howrah. The discharges from the port-cum-industrial complex of Haldia have aggravated the magnitude of pollution [6]. The marine ecosystem nearest to the city of Kolkata is the Indian Sundarbans, which is the most biologically productive, taxonomically diverse and aesthetically celebrated ecotone in the Indian subcontinent [7]. Aquaculture in the form of shrimp culture by traditional method is presently practiced in this zone as the primary livelihood scheme. However the condition of the cultured shrimp ponds is not very healthy from the environmental point of view. The untreated and the under treated sewage of the city of Kolkata and Howrah is responsible for the microbial load in these cultured shrimp ponds, which enters the farms through the inlet canals. Among microbial flora, the presence of pathogens such as Salmonella, Hepatitis A virus and Calcivirus has been determined [8]. These microorganisms are demonstrated to be responsible for some gastroenteritis cases due to shellfish consumption. Reports of the presence of Salmonella in the harvested shrimp sample were given by several workers [9]. Antibiotics like oxytetracycline are often used to get rid of the microbial contamination in the present study area [10]. These antibiotics not only cause the potential dangers like allergies, toxic effects, modifications in the bacterial flora of the human intestine, production of medicine resistance with disease causing bacteria in the human body [11], but also affect the environment like formation of the resistance bacteria trunks, the damage of organisms etc. With this background, the present programme was taken in some ponds of Indian Sundarbans, where the shrimp were fed with feed mixed with botanical extracts with the aim to boost up their growth and keep the ambient environment healthy. Microbial load in the cultured shrimp was also monitored from the viewpoint of quality control.
Go to
Materials and Methods
The present investigation was carried out during the month of May 2016 at two islands namely Chotomollakhali and Bali in the central sector of Indian Sundarbans. Water samples were collected using water sampler and the sediment samples were collected with the help of the Peterson grab. The water and sediment samples for microbial analysis were immediately transferred in to the sterile bottles and central portions of the sediment samples were aseptically taken and put into sterile Results and Discussion polythene bags and transported to the laboratory under ice for bacteriological examinations. Prawn samples were collected from the ponds of both islands (coded as C1 for Chotomollakhali island and B1 for Bali island) for carrying out microbial load analysis in terms of Total coliform and Fecal coliform. A Celsius thermometer recorded the surface water temperature of the selected ponds C1 and B1. The surface water salinity was recorded in the field by means of a refractometer, which was cross-checked in the laboratory by argentometric method. The DO was measured by a pocket DO meter in the field and subsequently cross-checked by taking sample water from ponds into 300ml BOD bottles without agitation and fixed with manganous sulphate and alkaline potassium iodide immediately after collection and sent to the laboratory for iodometric titration. The pH of the surface water was measured by a portable pH meter (sensitivity±0.02) which was calibrated by standard buffers before every use and transparency was measured by a Secchi disc. Surface water for nutrient analysis was collected from cultured ponds C1 and B1 in clean TARSON bottles and transported to the laboratory in ice freezed condition. For bacterial analysis, the prawn samples of C1 and B1 ponds were accurately weighed and blended with 0.1% peptone buffer and 3% NaCl diluent for 1 minute and finally inoculated taking different dilutions. The incubation was done at 37 °C for 24hrs and the result was expressed from MPN index per gram basis. For bacteriological analysis of water and sediment samples the standard method as stated in APHA 20th Edition, 2001 was followed. The nutrient load with respect to nitrate, phosphate and silicate of the pond surface water were determined following the method as stated in APHA 20th Edition, 2001.
Go to
Results and Discussion
Aquaculture in India plays an important role in nutrition, income employment and foreign exchange earnings. Maintenance of its food value thus is very much essential. For this purpose the microbial status of Penaeus monodon, a major exportable item has been studied under various circumstances by using natural feed. Microorganism's growth and survival are functions of the physico-chemical factors such as dilution factor, temperature, sunlight radiation, salinity, and predation etc. Bacterial metabolism can also be dramatically affected by hostile environmental conditions [12]. The microbial load in the present study was highest in the ambient media of the cultured shrimp pond C1 at Chotomollakhali. This has also been reflected in the prawn sample. The prawn sample collected from the pond of Bali Island is relatively less contaminated and pond health was also superior to Chotomollakhali with respected to selected variables. The high microbial load in the ambient media (water and sediment) and prawn sample of Chotomollakhali may be attributed to the proximity of the station to the highly urbanized city of Kolkata. The DWF and SWF canals act as the conveyor belt to release the untreated waste from the city into the Bidyadhari River from where the waste finally are drained to Matla estuary. Bali being located at a much greater distance from Kolkata experiences relatively uncontaminated water, which is reflected through lower microbial load in the shrimp sample collected from this island (Table 1).
The results obtained for microbial load from these two islands are far less than that recorded by earlier workers (Table 2). This may be attributed to the use of natural additives (garlic extract) and seaweed based protein in the feed, which not only controls water health, but also boost up shrimp growth, and lowers the FCR value of the culturable species [13] (Table 3).
To Know More About Journal of Oceanography Please Click on: https://juniperpublishers.com/ofoaj/index.php
#Juniper Publishers#Open Access Publisher#Juniper Publishers Address#juniper publishers contact info
0 notes
Text
Water Quality Analyzer Market : Future Growth and Challenges Analyzed
Water is an important resource for human beings, as it is used in exhaustive applications such as drinking, food, manufacturing, cooling systems, steam generation, chemicals, research, and agriculture. All these applications require water with specific prerequisite properties and purity.
Read report Overview-
https://www.transparencymarketresearch.com/water-quality-analyzer-market.html
Water has various physical and chemical qualities such as pH, purity, metal and salt content, dissolved gas content, and microbe presence. These qualities vary for different applications. Water quality analyzers determine the fitness of water for usage in a specific application. Several types of water quality analyzers such as TOC analyzers, BOD analyzers, oil in water analyzers, sulfide analyzers, turbidity analyzers, pH meters, spectrophotometers, and multiparameter colorimeters are available in the market.
Request Brochure@
https://www.transparencymarketresearch.com/sample/sample.php?flag=B&rep_id=19940
The water quality analyzer market is largely propelled by the rising awareness and improvements in quality of water required for specific applications across all end-user industries. Advancements in technology are improving the understanding of effects of water quality on various applications, thereby leading to higher demand for water quality analyzers. Furthermore, implementation of stringent government regulations in most developed countries with regard to better quality of drinking water and rise in concerns over water pollution and wastewater management are some of the major factors propelling the water quality analyzer market across the globe. Industrial waste water causes severe damage to the environment, including local water bodies.
REQUEST FOR COVID19 IMPACT ANALYSIS –
https://www.transparencymarketresearch.com/sample/sample.php?flag=covid19&rep_id=19940
Governments and environment protection organizations are therefore compelling industries to pretreat and analyze the water which is discarded. This is boosting the water quality analyzer market. However, the costs associated with testing and analyzing wastewater are usually high. Companies in the developing economies are largely ignorant about water analysis. This is restraining the water quality analyzer market in developing regions.
More Trending Reports by Transparency Market Research –
https://www.nsenergybusiness.com/pressreleases/companies/transparency-market-research/stakeholders-in-plastic-recycling-market-actively-looking-for-improve-recycling-rates-of-discarded-plastics-packaging-across-economies-tmr/
The water quality analyzer market, in terms of type has been segmented into TOC analyzer, pH meter, multiparameter colorimeter, turbidity meter, dissolved gas (oxygen) meter, and others. Among the products, pH meters and TOC analyzers accounted for significant share of the water quality analyzer market across the globe. The criticality of pH levels, i.e. acidity or alkalinity of water, in several applications makes pH analyzers significantly important. These products or analyzers can be either portable or bench mounted depending upon the location of water and functionality. Based on application, the water quality analyzer market has been classified into industrial, environmental, laboratory, sanitation and sewage treatment, and others. Industrial and laboratory applications accounted for the large share of the water quality analyzer market in 2015, as they need close monitoring of water quality for efficient functioning of equipment & machinery and accurate results in case of laboratory applications.
Based on geography, the water analyzer market has been divided into Asia Pacific, Europe, North America, Latin America, and Middle East & Africa. Developed regions such as Europe and North America collectively accounted for more than 60% share of the global water analyzer market. Implementation of stringent government regulations on environmental protection and curbing of water pollution is the primary factor driving the demand of water quality analyzers in these regions. Europe and North America also lead in research and development in all fields, resulting in high demand for water quality analyzers for laboratory and research segment. Asia Pacific is also a major market for water quality analyzers due to the rising industrialization and urbanization in China and India. The population explosion in these countries is also anticipated to propel the demand for water quality analyzers in sewer & sanitation and water distribution applications.
Key players manufacturing water quality analyzers include General Electric Company, Thermo Fisher Scientific, Inc., Forbes Marshall, Emerson Electric Co., Honeywell International Inc., and Thermo Fisher Scientific, Inc.
0 notes
Text
GLOBAL Water Quality Monitoring Equipment MARKET 2020-2026 | INDUSTRY APPLICATIONS, PRODUCTS AND KEY PLAYERS – Danaher Corporation (US), Evoqua Water Technologies (US), Suez S.A. (France), and more.

The current report on the Water Quality Monitoring Equipment Market provides a comprehensive assessment of the business vertical and offers a comprehensive overview of the industry along with its key segments. The study includes an accurate estimate of the current industry scenario along with the market size, market volume, and revenue garnered by the industry. The report delivers radical data about the competitive landscape of the Water Quality Monitoring Equipment industry and a thorough bifurcation of the regions where the Water Quality Monitoring Equipment market has established a significant footing. The report further estimates the market scenario in context with the COVID-19 pandemic. The report analyses the current market scenario along with the effects of the COVID-19 on the present and future scenario. The report also focuses on the key changes, progress, or hurdles due to the COVID-19 pandemic.
Get a sample of the report @ https://www.reportsanddata.com/sample-enquiry-form/1789
Key Summary of Regional Analysis and Competitive Landscape:
The report offers a comprehensive overview of the competitive landscape of the Water Quality Monitoring Equipment industry. The competitive landscape includes extensive profiling and overview of prominent players of the Water Quality Monitoring Equipment industry. The report studies the following companies in detail: Danaher Corporation (US), Evoqua Water Technologies (US), Suez S.A. (France), Horiba Ltd. (Japan), Shimadzu Corporation (Japan), Pentair Plc (UK), Thermo Fisher Scientific, Inc. (US), Xylem (US), ELTRA GmbH (Germany), Lar Process Analyzers AG (Germany), Analytical Technology Inc. (US), Real Tech, Inc. (Canada) and Aquaread Ltd. (UK).
Radical Highlights of the Water Quality Monitoring Equipment Market Report:
The research report provides an accurate analysis of the product range, application spectrum, regional analysis, and competitive landscape of the Water Quality Monitoring Equipment industry.
Equipment Type (Revenue, USD Million; 2016–2026)
On-Line
Laboratory
Portable
Parameter Tested (Revenue, USD Million; 2016–2026)
DO
BOD & COD
TOC
TON
TSA
Others
Applications (Revenue, USD Million; 2016–2026)
Municipal
Industrial Process Water
Others
The report further provides key insights into the market share held by each product and application in the Water Quality Monitoring Equipment market. Moreover, it also offers radical information about growth prospects and patterns. It also provides extensive coverage of the product consumption of each application and product. The report also provides a pricing analysis and growth trends for the key segments of the market.
Request a discount on the report @ https://www.reportsanddata.com/discount-enquiry-form/1789
Along with the basic information, the report also offers insights into marketing strategies readily adopted by the key manufacturers for the endorsement of their products. The report offers significant data pertaining to development trends and market position to offer deeper insights into targeted clients, brand promotions, and pricing analysis. The report also sheds light on the supply chains and the changes in the trends of the upstream raw materials and downstream distributors.
The report explains the market share and sales volume of each company, along with the key details of the operations of these companies. The report further offers extensive coverage of their product portfolio, business expansion plans, gross profit margins, revenue contribution, investment plans, and financial standings. The report also covers the strategic alliances observed within these key companies such as mergers and acquisitions, joint ventures, corporate and government deals, partnerships and agreements, and brand promotions and product launches.
To know more about the report, click @ https://www.reportsanddata.com/report-detail/water-quality-monitoring-equipment-market
Furthermore, the research study gives additional insights into the companies’ regional presence through extensive regional analysis. The regional analysis covers the key geographical regions such as North America, Latin America, Europe, Asia-Pacific, and the Middle East & Africa. The regional analysis segment covers details about the market share held by each region along with the prospective growth opportunities and revenue generation. The report also offers a projection of the growth rate for each region in the entirety of the forecast timeline. It also offers a country-wise analysis to impart a better understanding of the industry.
Browse Related Reports –
Smart Water Meter Market Future Growth with Technology and Outlook 2020 to 2027 – https://www.reportsanddata.com/report-detail/smart-water-meters-market
Flash Point Tester Market 2027: Regional Trend & Growth Projections – https://www.reportsanddata.com/report-detail/global-flash-point-tester-market-by-manufacturers-countries-type-and-application-forecast-to-2022
Thank you for reading our report. For further inquiries and information about the customization of this report, please get in touch with us. Our team will ensure you get the report well-suited for your needs.
About Us:
Reports and Data is a market research and consulting company that provides syndicated research reports, customized research reports, and consulting services. Our solutions purely focus on your purpose to locate, target and analyze consumer behavior shifts across demographics, across industries and help client’s make a smarter business decision. We offer market intelligence studies ensuring relevant and fact-based research across a multiple industries including Healthcare, Technology, Chemicals, Power and Energy. We consistently update our research offerings to ensure our clients are aware about the latest trends existent in the market.
Contact Us:
John W.
Head of Business Development
Direct Line: +1-212-710-1370
E-mail: [email protected]
Reports and Data | Web: www.reportsanddata.com
0 notes
Text
Low Temperature Bath, Hot Air Oven, Humidity Control Oven, India
Aditi Associate : Manufacturer and Exporter of Low Temperature Bath, Hot Air Oven, Humidity Control Oven, Laboratory Autoclave, Mumbai, India.
Laboratory Equipments, Dehumidifiers, Weighing Scales, Low Temperature Bath, Hot Air Oven, Laboratory Autoclave, Humidity Control Oven, Stainless Steel Autoclave, Hot Air Oven, Tray Dryers, Bod Incubator, Bacteriological Incubator, Stability Chamber, Humidity Oven, Laminar Air Flow, Biosafety Cabinet, Muffle Furnace, Orbital Shaker Incubator, Rotary Shaker, Deep Freezer, Fume Chamber, Autoclave, High Temperature Industrial Furnace, Viscometer Water Bath, Vacuum Oven, Clean Room Equipment, Blood Bank Refrigerator, Spectrophotometer, Ultrasonic Cleaners, Uv Cabinet, Dry Bath, Uv Inspection Cabinet, Vacuum Pumps, Colony Counter, Ph Meter, Conductivity Meter, Probe Type Ultrasonic Cleaner, Mumbai, India
www.aditiassociate.in
0 notes
Text
Water Quality Monitoring Equipment Market Insights Report By Top Key Vendors 2019 – 2026

Increasing prevalence of waterborne diseases, the surge in government obligations, and the rise in water pollution levels due to industrialization globally have led to the growth of the Water Quality Monitoring Equipment market. However, high cost of the equipment coupled with inadequate skilled manpower to handle the equipment will hamper the growth of the market over the forecasted period.
Market Size – USD 3.2 Billion in 2018, Market Growth - CAGR of 6.1%, Market Trends – Increasing water pollution levels globally coupled with rising rules and regulations being laid down by the governments globally is leading to the growth of water quality monitoring equipment market.
Get Free PDF Sample: https://www.reportsanddata.com/sample-enquiry-form/1789
According to the current analysis of Reports and Data, the global Water Quality Monitoring Equipment market was USD 3.2 Billion in 2018 and is projected to register a CAGR of 6.1% from 2019 to 2026. The major driving factors that drive the global Water Quality Monitoring Equipment market are the increase in water pollution levels due to industrialization globally, increase in prevalence of waterborne diseases and the surge in government obligations regarding water quality. The major restraining factor that restricts the growth of the Water Quality Monitoring equipment market is the high cost of the equipment.
The market is segmented based on Equipment type, Parameter tested and Application. By region, the market is segmented into North America, Europe, Asia-Pacific, and Rest of the World. North America and Europe were the largest revenue generating markets for the review period. Asia-Pacific region is projected to grow at the fastest rate during the forecast period.
The water conditions of the municipal corporations, industry, utility, and product sectors far exceed current supply. However, water exists in abundance; it's unreliable, and declining quality is a significant issue. Harnessing water suitable for the needs of different industries such as petrochemicals, oil and gas, mining, steel industry, power generation, municipal supply, and chemical and consumer goods requires an infrastructure that promises a steady supply, efficient equipment, and the reuse of resources. Water purity is critical for a number of industries such as pharmaceutical, semiconductor manufacturing, power generation, and food & beverage, among others.
Rapid industrialization and urbanization have driven the increasing demand for water treatment. Increasing population and application of pure water for daily consumption, which is an essential factor for public health have raised the need for better agricultural productivity where the significant utilization of water is observed. The increasing demand for water has put pressure on the regulatory bodies and government of different countries to formulate regulations related to water quality monitoring. Devices and methodologies used in water quality monitoring can range from simple and inexpensive devices to capital-intensive and sophisticated equipment. Field measurements reduce the time between sampling and measuring, thereby allowing for real- or near-real-time analyses. Simple field measured variables include thermometers and thermistors, DO meters or optodes, portable pH and conductivity meters, and optical turbidity meters, among others. Factors such as streamflow, dissolved oxygen, and biochemical oxygen demand, temperature, pH, and turbidity are the foundation of almost any water quality monitoring program. With universal applications ranging from consumption to industrial processes, the worldwide total water quality monitoring equipment market is expected to grow significantly during the forecast period.
To identify the key trends in the industry, click on the link below: https://www.reportsanddata.com/report-detail/water-quality-monitoring-equipment-market
Further key findings from the report suggest
Importance of sustainability and the need to mitigate climate changes, issues related to water, rapid urbanization coupled with growing population have gained significance in recent years.
Equipment to monitor parameters like TOC and TS are one of the fastest growing segments in the water quality monitoring equipment market with CAGR of 6.1% and 6.35 respectively.
The European region is forecasted to grow at a rate of 5.8% CAGR over the forecasted period.
Water quality monitoring equipment in the Asia Pacific region is expected to witness significant growth in the coming years, due to an increase in water pollution in various countries like India and China.
Laboratory-based analyzers segment is forecasted to dominate the Water quality monitoring equipment market over the forecasted period with a market share of over 45% in 2019.
Average high –income nations treat about 70% of the wastewater that they generate, while the remaining 38% of wastewater is only managed in upper-middle income countries and 28% in lower-middle income countries.
There is a rise in the consumer`s awareness regarding the depletion of natural resources, scarcity of freshwater in developed nations as well as the increase in the demand for freshwater in various industries. All these factors are leading to the growth of the market.
Leading players in the market are focused on investing and improving their R&D capabilities in order to offer the latest technologies to gain competitive advantage.
Key participants include Danaher Corporation (US), Evoqua Water Technologies (US), Suez S.A. (France), Horiba Ltd. (Japan), Shimadzu Corporation (Japan), Pentair Plc (UK), Thermo Fisher Scientific, Inc. (US), Xylem (US), ELTRA GmbH (Germany), Lar Process Analyzers AG (Germany), Analytical Technology Inc. (US), Real Tech, Inc. (Canada) and Aquaread Ltd. (UK).
Ask For Discount: https://www.reportsanddata.com/discount-enquiry-form/1789
For the purpose of this report, Reports and Data has segmented the the Global Water Quality Monitoring Equipment market on the basis of equipment type, parameter tested, application, and region.
Equipment Type (Revenue, USD Million; 2016–2026)
On-Line
Laboratory
Portable
Parameter Tested (Revenue, USD Million; 2016–2026)
DO
BOD & COD
TOC
TON
TSA
Others
Applications (Revenue, USD Million; 2016–2026)
Municipal
Industrial Process Water
Others
Regional Outlook (Revenue in USD Million; 2016–2026)
Regional Outlook (Revenue in USD Million; 2016–2026)
• North America
o U.S.
o Canada
• Europe
o U.K.
o Germany
o France
o Spain
o Rest of Europe
• Asia Pacific
o China
o India
o Japan
o Australia
o Rest of Asia-Pacific
• Rest of the World
• Middle East & Africa
o South America
Table Of Content:
Chapter 1. Market Synopsis
1.1. Market Definition
1.2. Research Scope & Premise
1.3. Methodology
1.4. Market Estimation Technique
Chapter 2. Executive Summary
2.1. Introduction
2.2. Summary Snapshot, 2016 – 2026
2.3. Assumptions
2.4. Limitations
Chapter 3. Indicative Metrics
Chapter 4. Global Water Quality Monitoring Equipment Market Segmentation & Impact Analysis
4.1. Global Water Quality Monitoring Equipment Segmentation Analysis
4.2. Industrial Outlook
4.2.1. Market Indicators Analysis
4.2.2. Market Drivers Analysis
4.2.2.1. Consumption side factors
4.2.2.2. Increasing demand for water monitoring equipment from industrial sector
4.2.2.3. Stringent regulations for water monitoring and treatment
4.2.2.4. Rising demand for water and wastewater treatments
4.2.3. Market Restraints Analysis
4.2.3.1. Limitations associated with traditional monitoring equipment
4.2.3.2. High cost of equipment
4.3. Regulatory Framework
4.4. Porter's Five Forces Analysis
Continue…
#Water Quality Monitoring Equipment Market#Water Quality Monitoring Equipment Market Trends#Water Quality Monitoring Equipment Market Application#Water Quality Monitoring Equipment Market Size
0 notes
Text
Water Analysis Instruments Market – Global Industry Analysis, Size, Share, Growth, Trends and Forecast 2017 – 2025
Water analysis instruments are used to analyze water to detect the presence of hazardous chemicals and biological agents. Rising population and significant increase in rate of industrialization has increased water pollution notably which is affecting aquatic ecosystems at a global level. Ever increasing demand for safe, clean, and quality water has forced government organizations to undertake major steps against growing issues of water pollution. Water analysis instruments are used to determine the physical, chemical, and biological properties and contaminants in water. Drinking water analysis is a mandatory process as many disease causing micro-organisms and contaminants can pose significant health risks. Chemical disinfectants and their by-products act as a potential source of health risk; therefore, regulatory bodies have enacted stringent regulations related to water quality requirements on the discharge of treated water from industries.
The water analysis instruments market is driven by rising demand for safe and high quality water, increasing investment in refining and petrochemical sectors, and stringent water quality control regulations across the globe. Government initiatives and awareness campaigns due to rising environment concerns, growing population creating huge demand for safe drinking water, and establishment of quality control and safety regulations from government sectors is likely to boost the growth of the water analysis instruments market. Technological advancement in instruments development (from laboratory based to portable and digital based models), and technological shift towards design of multi-parameter instruments is likely to provide growth opportunity to key players. Economic instability, and lack of skilled technicians are the major restraining factors for the growth of the global water analysis instruments market.
The global water analysis instruments market has been segmented based on instrument type, method of analysis, end-user, and region. In terms of instrument type, the market can be segmented into turbidometer, Floc tester, BOD system, colorimeter, spectrophotometer, electrochemistry instruments, chromatography and others. The turbidometer segment is further classified into portable turbidometer and laboratory turbidometer. Electrochemistry instruments are further segmented on the basis of parameter of analysis into pH meters, ORP meters, conductivity meters, dissolved oxygen meters, and others.
PDF Brochure For More Information: https://www.transparencymarketresearch.com/sample/sample.php?flag=B&rep_id=37193
Chromatography instruments segment is further classified into gas chromatography and ion chromatography. Based on method of analysis, the global water analysis instruments market is segmented into colorimetric method, titration method, turbidimetric method, electrochemical methods, and respirometric method. Based on application, the market is segmented into drinking water, industrial process water, wastewater management, and others. In terms of end-user, the water analysis instruments market has been segmented into pharmaceutical and oil industries, laboratories, academic and research institutes and others. The pharmaceutical industries segment is likely to dominate the market during the forecast period.
0 notes
Text
Simple ways to test Water Quality
With the help of modern chemistry we can detect thousands of chemicals in water even at extremely low concentrations. The ever-growing list of tests that are available can feel overwhelming and the vast majority of methods require state-of-the art lab facilities. Fortunately, we don’t need to test for everything! A much smaller and more practical set of tests can provide a good sense of Chemical Water Quality for monitoring purposes. The good news is that there are low-tech versions of these tests for situations when budgets are limited.
Test formats
Typical low-tech, portable, field test methods for chemical water quality monitoring fall into three categories:
Test strips – These are small, single-use strips that change colour to indicate the concentration of a specific chemical. Depending on the particular test, the user “activates” the paper or plastic strip by dipping it into the water sample and swishing it around, or by holding the strip in a stream of water. After waiting for a short time, the user compares the test strip colour with a color chart to read the concentration of the chemical. These Water Sample Test Kits are extremely simple, but they are less accurate than other methods, especially if users don’t follow the instructions.
Colour disk kits – Colour Disk Test Kits are available for a wide range of chemical tests. In a typical set-up, the user adds a powder packet or a few drops of a liquid reagent to a water sample in a reusable plastic tube. The user then places the sample tube in a small plastic viewing box. This viewing box contains a plastic disk with a colour gradient printed on it. The user rotates the colour disk to find the part that best matches the colour of the sample, and then reads the concentration of the chemical from the disk. Colour disk kits typically have multiple steps and often include prescribed wait times, so they’re a little more complicated and costly, but generally more accurate.
Hand-held digital instruments – Lightweight and portable Digital Meters, Colorimeters and Photometers are available for water testing. They provide the most accurate results of these three testing methods, but they are also more expensive and delicate than the previous options. These instruments require batteries and calibration. While Digital Instruments are helpful to field technicians and are an essential part of any continuous or remote monitoring network, they are unlikely to be suitable for “citizen science” or crowd sourced water quality testing.
Chemical Water Quality Parameters:
Having identified various test formats, the next question is: What do we test for? UNICEF recommends prioritizing fluoride, arsenic and nitrate for chemical monitoring. In areas where the earth is naturally rich in minerals that contain fluorine and arsenic levels in well water can be high enough that chronic exposure is dangerous to human health.
How can we test for these elements?
Fluoride: At least one colour disk test kit is available for fluoride. However, Portable Digital Colorimeters are often preferred because of concerns over accuracy.
Arsenic: Portable field testing options for arsenic are limited; this contaminant is best measured in a laboratory. Commercially available test kits do exist, but they are relatively complex and require several steps. Although the arsenic concentrations “measured” with these test kits may be inaccurate, the kits do detect arsenic in nearly all samples greater than 100 micrograms per litre (μg/L), as well as in most samples in the 50-99 μg /L range. UNICEF has therefore recommended reporting arsenic monitoring results from these portable tests as “present” or “absent” using a reference concentration of 50 μg /L—the drinking water standard in many countries that are affected by natural arsenic contamination.
Nitrate: Both test strips and colour disk test kits are available for Nitrate Testing. Nitrate can also be measured with a digital meter. High levels of nutrients are associated with agricultural pollution from fertilizers (nitrogen and phosphorous) and animal waste (nitrogen). Latrines, sewage, landfills and industrial pollution can also contribute nitrogen. Monitoring for nitrate is a simple way to assess the impacts of agricultural and human waste on water quality.
Resources permitting, UNICEF suggests adding three more chemical parameters to monitoring programs: the naturally-occurring metals iron and manganese, and the overall total dissolved solids (TDS). All three can cause taste and odour problems that might motivate consumers to seek out more appealing – and potentially unsafe – water sources.
Iron and Manganese: Both test strips and colour disk tests are available for these two metals which may also be measured using portable, digital instruments. Field testing with digital equipment is considered reliable for iron and manganese.
TDS: TDS includes a mixture of inorganic salts, mostly sodium, chloride, potassium, calcium, and magnesium. Rather than testing the particular components, TDS is monitored by measuring the conductivity of the water with a digital meter known as TDS Meter. There is no test strip or colour disk kit that can be used here, although at least one conductivity meter interfaces with a smartphone.
In chlorinated distribution systems, it is important to monitor two more chemical parameters: pH and chlorine residual.
pH: pH test strips and colour disk tests are widely available. More expensive, higher-tech options include electrode-based pH meters. pH is a measure of hydrogen ion activity, which means that it tells us how acidic or basic the water is. pH is not a pollutant, but it is a chemical master variable. It affects the behaviour of other chemical constituents, including the effectiveness of residual chlorine against microbial contamination. Sudden changes in pH can also reveal treatment plant failures or pollution events in natural water bodies (for example, illegal industrial discharge).
Chlorine: There are many easy ways to test residual chlorine including test strips, colour disks and even kits designed for testing swimming pools. Portable digital meters also exist that can provide reliable & quantitative measurements.
Depending on local conditions and on the focus of a water quality monitoring project, more chemical tests can be added. One might test for alkalinity or hardness (including calcium, magnesium, etc.; field kits are available), chloride (an indicator of road salt or seawater intrusion; test kits exist), dissolved oxygen,[2] organic carbon levels (BOD, COD, TOC), agrochemicals (specific pesticides or fertilizers), or mining/industrial contaminants (e.g., polychlorinated biphenyls, cyanide). Finally, heavy metals like lead, mercury, copper, chromium, etc. are often of local interest.
However, the vast majority of these additional tests are best performed in a laboratory given current technologies. Hydromo being one of such expertise in conducting the Water Tests, it also provides the entire Water Solutions for Homes and Businesses.
0 notes
Text
Juniper Publishers-Open Access Journal of Environmental Sciences & Natural Resources

Comparative Assessment of Physicochemical Parameters of Udaipur City, (Raj.) India
Authored by Chandra Shekar Kapoor
Abstract
Urbanization and Industrial activities lead the water contamination. It’s a serious problem now a day. Analysis of the water quality is essential to take a safety measures to protect & preserve the natural ecosystem. As a part of this study, Assessment of the water quality was carried out for different lakes in the City of Udaipur. The present analysis is aimed to assess the physicochemical parameters of water in Udaipur City. For determining the present water quality status by statistical evaluation 35 different parameters have been considered Viz. pH, color, total dissolved solids, electrical conductivity, total alkalinity, total hardness, chromium, zinc, manganese, nickel, BOD, COD, fluoride, zinc etc. The study of physicochemical and biological characteristics of this water sample suggests the evaluation of water quality. The indices had been computed from Jan 2013 to Dec. 2015.
Keywords: Physicochemical Parameters; B.O.D; C.O.D; Drinking Water Standard; Water Quality; Coliform
Introduction
Water is the most crucial factor in shaping the land and regulating the climate. It is one of the most important compounds that profoundly influence life. Wetlands are probably the earth’s foremost freshwater resources that provide food and habitat for numerous aquatic life including threatened and endangered species. Therefore conservation of wetlands is pretty essential as wetlands are one of the most threatened habitats in the world. The most important step for conservation of wetlands is to maintain a proper water quality. The water quality is directly related to the health of the water body hence proper management of water quality of the aquatic environment is very much crucial. Analysis of the British Columbia water quality index for watershed managers: a case study of two small watersheds [1]. The application of water quality indices and dissolved oxygen as indicators for river water classification and urban impact assessment [2]. Some of the most recent work on water quality of various aquatic environments. Assessment of bacterial indicators and physicochemical parameters to investigate pollution status of Gangetic river system of Uttarakhand, India [3]. DO-BOD modeling of River Yamuna for the national capital territory of India using stream II, a 2D water quality model [4]. Comparative analysis of regional water quality in Canada using the water quality index [5]. Physicochemical and microbiological study of Tehri dam reservoir, Garhwal Himalaya [6]. Water quality analysis of River Yamuna using water quality index in the national capital territory, India [7]. The impact of pharmaceutical industry treated effluents on the water quality of river Uppanar, south-east coast of India: A case study [8]. Seasonal variations in Physico-chemical characteristics of Rudra sagar wetland- a Ramsar site, Tripura, India [9].
Material and Methods
Study area
The city of Udaipur (state Rajasthan, India) known as ‘city of lakes’ is situated about 600 m above the mean sea level and is located among the lush green hills of Aravali range between 24°35’ N latitude and 73°42’ E longitude. There are three major lakes around Udaipur and within, e.g., Fateh Sagar, Udai Sagar and Pichhola. The city population is around 0.65 million and It has a distinctly tropical climate with marked monsoonal effect. The climate of Udaipur can be divided into three distinct seasons, i.e., summer (Mar-Jun), rain (Jul-Oct) and winter (Nov-Feb). The average temperature ranges from 5°C in winter to maximum of 41°C in summers. The annual average rainfall ranges from 62.5 cm to 125 cm during normal monsoon regime. The climate is divided into three seasons, Summer(Apr-Jun), Rainy (Jul-Oct) and Winter (Jan-Feb). The present study was conducted on the Physico-chemical parameters of the Fateh Sagar, Udai Sagar and Pichhola lakes.MethodologyThe physicochemical parameter, water temperature was measured in situ by using hand mercury thermometer, pH was estimated by Digital pH –meter (Elico-120).Turbidity was measured by Water Analyzer, EM-61, Electrical conductivity was measured by conductivity meter. (Tanco EE-014 Series Digital Conductivity Meter), TDS was measured with the help of Digital TDS meter. Other parameters, i.e. Total Alkalinity, Dissolved Oxygen, Biological Oxygen Demand(BOD) and Chemical Oxygen Demand (COD), Chloride, Sulphate, Sodium, Calcium, Magnesium, Total Hardness, Phenolphthalein Alkalinity, Phosphate, Nitrite, Fluoride, Ammonical Nitrogen, Boron Dissolved, Potassium, Cyanide, Cadmium, Lead, Chromium, Zinc,Iron, Copper, Nickel,Total Kjeldahl Nitrogen. The analysis of Total Suspended solids, Total Dissolved Solids, Fixed Dissolved Solids, Fecal Coliform and Total Coliform of water performed as per the standard methods [10-12] in the laboratory.
Results
The results of investigations of various parameters of Pichola lake water quality were recorded for two years (Jan 2013 to Dec 2014). During this period (Tables 1 & 2), analysis of various physicochemical parameters of different physical sites of Udaipur city was performed and it was revealed that the range of temperature in different sampling sites was 18 degrees centigrade (minimum) to 25-degree centigrade (maximum). The pH was found 7.70 (minimum) in the month of Jan-Feb, 2013) and 8.60 (maximum) in the month of May-Jun, 2014. The amount of Conductivity in the different samples were minimum at 558 (Jul- Aug, 2014) and maximum 732 (Jul-Aug, 2013). The amount of Total Alkalinity recorded minimum at 5.50 mg/l and maximum 152 mg/l. The amount of Dissolved Oxygen recorded minimum as 0.9 mg/l in Jul-Aug, 2013 and maximum 6.45 mg/l in May- Jun, 2014. In the case of B.O.D. lowest value was recorded in the month Jan-Feb, 2013 at 0.081mg/l and highest in the month of Sep-Oct, 2013 at 1.85 mg/l. C.O.D. content in the water samples was recorded highest during Sep-Oct, 2013 (25 mg/l) and lowest during May-Jun, 2013 (5.69 mg/l). Similarly in the samples of Chloride, Sulphate recorded highest in the months of Jul-Aug, 2014 (114 mg/l) and in Mar-Apr, (65 mg/l), and minimum in the samples of Sep-Oct, 2013 (49 mg/l) and of Jul-Aug, 2013 (31.0 mg/l ). Sodium content was observed maximum in the months of Jan-Feb, 2014 (94 mg/l) and minimum in those of during Sep- Oct, 2013 (32 mg/l). ). The amount of Calcium and Magnesium was recorded higher in the months of and Mar-Apr, 2014 (49.5 mg/l; 19.51 mg/l) and lower in Jul-Aug, 2013 & Nov-Dec, 2014 (26.1 and 1.80 mg/l) in the sample of Pichola Lake respectively. Fecal Coliform content recorded maximum and minimum in the months of Nov-Dec, 2014, (7 MPN /100ml); Jan-Feb, 2013 (4 MPN /100ml). The amount Phenolphthalein Alkalinity as recorded of the different samples as maximum 8 mg/l Jul-Aug, 2014. The amount of Turbidity ranged between 0.39 and 9.3 NTU. Similarly, the amount of Total Kjeldahl Nitrogen was minimum at Nov-Dec, 2014, 0.80 mg/l and Jul-Aug, 2014 maximum 2.24 mg/l. The Total Hardness content was recorded highest during Mar- Apr, 2014 (186 mg/l) and lowest value (89 mg/l during Jul-Aug, 2014). Total Coliform content was higher during Mar-Apr,2013 (19 MPN/100ml), lower value 3 MPN/100ml Nov-Dec, 2014. Total Dissolved and Fixed Dissolved Solids recorded highest in the months of Jun-Feb, 2014 (389 mg/l & (219 mg/l), and minimum in the samples of Sep-Oct, 2013 (270 mg/l) and Mar- Apr, 2013 (139 mg/l). The lowest values of Ammonical Nitrogen were recorded during (Jan-Feb, 2013, 0.03 mg/l)and the highest values in Nov-Dec, 2014 (0.81mg/l).The amount of Boron Dissolved were recorded highest during Nov-Dec, 2013as 0.79 mg/l and lowest 0.001mg/l in Jan-Feb, 2014.The highest amount of Phosphate was recorded during the Sep-Oct, 2013 (0.03 mg/l) lowest 0.0 mg/l Nitrate was recorded highest during Mar-Apr, 2014 (0.07mg/l) and lowest during Jul-Aug, 2013(520). It was observed that the amount of Potassium in the water sample of Pichola lake was high in Jun-Feb, 2013 (0.69mg/l) and lower in Jul-Aug, 2013 (0.4 mg/l).Total Suspended solids were found high during Mar-Apr, 2013 in the sample water of lakes (33 mg/l) and minimum value in Jan-Feb,2013 (1.8 mg/l). Highest Fluoride content was recorded in (0.99 mg/l during Jul-Aug, 2014) and lowest in the sample of industrial area (0.06 mg/l during Jan- Feb, 2013). Pichola Lake and Fateh Sagar area were computed (Tables 3-8).During two years of study of water sample of Fateh Sagar (Tables 3 & 4) very low temperature was recorded in Jan-Feb, 2014 (20-degree centigrade) whereas the high temperature was recorded during Mar-Apr, 2013 (24.6-degree centigrade).The pH content was higher during Jan-Feb, 2013 (8.7), lower in Jul-Aug, 2013(7.84). Conductivity was recorded highest during Jul-Aug, 2013 (1281) and lowest during Jul-Aug, 2014 (520). The amount of total Alkalinity was recorded higher during Sep-Oct, 2014 (150mg/l;) and lowest during Mar-Apr, 2013 (115mg/l) at lake sites. Higher values of Dissolved Oxygen were estimated during Jul-Aug, 2013 (6.74mg/l) and lower values estimated in Sep- Oct, 2013 (4.16mg/l) in Fateh Sagar’s water sample. The B.O.D. content was recorded higher during Jan-Feb, 2013 (3.40 mg/l) and lower during Jul-Aug, 2014(3.30 mg/l). The C.O.D. recorded highest during Nov.-Dec 2013 (63.1 mg/l) and the lower amount was recorded in the samples of industrial area’s water during May-Jun, 2013 (7.2 mg/l). The Chloride content was recorded highest during Mar-Apr, 2013 (122 mg/l) and lowest during Jul-Aug, 2013 (12.1mg/l). The lowest values of Sulphate were recorded during Jan-Feb, 2013, (29mg/l) and highest values in Jul-Aug, 2014 (68 mg/l). Sodium was found to be highest in the water samples of the lakes with its highest value recorded during Nov-Dec 2014 (81mg/l) and lowest value in Jul-Aug, 2013 (28 mg/l). The amount of Magnesium was recorded higher during Mar-Apr, 2013 (23.40 mg/l) and lowest in Jan-Feb, 2014 (2.80 mg/l). The Fecal Coliform content was recorded lowest during Jan-Feb, 2013 (3 MPN/100ml) and during Jul-Aug, 2014(7 MPN/100ml).Water samples Phenolphthalein Alkalinity lower values were estimated as zero and highest values in Mar-Apr, 2013 (27 mg/l). In Fateh Sagar’s water, Turbidity was highest during Mar-Apr, 2013(4NTU) and lower May June 13 0.27 NTU, respectively. In the samples of Total Kjeldahl Nitrogen were recorded maximum during Mar-Apr, 2013(1.93 mg/l) and minimum in Jan-Feb, 2013 (0.56 mg/l). In the case of Total Hardness, the lowest value was recorded in the months of Jul- Aug, 2013, at 99 mg/l and highest in the month of May-Jun, 2014 at 180 mg/l. Total Coliform lowest concentration was observed in the month of Mar-Apr, 2013 at 7 MPN/100ml and highest in the month of May-Jun, 2014 at 22 MPN/100ml. In comparison, the lowest concentration of Total Dissolved Solids was recorded in the month of May-Jun, 2013 at 226 mg/l and highest in the month of Nov-Dec, 2014 at 318 mg/l. In the case of Fixed Dissolved Solids lowest value was recorded in the month of Mar- Apr, 2013 at 84 mg/l and highest in the month of Mar-Apr, 2014 at 200 mg/l. While the highest value of Phosphate was recorded in the month of Jul-Aug, at 0.001 mg/l. Lowest concentration of Ammonical Nitrogen was observed at 0.07 mg/l in the month of Jan-Feb, 2013 and it was highest in the month of Mar-Apr, 2014 at 1.4 mg/l. During study period Boron Dissolved was highest in the month of Nov-Dec, 2014 at 0.23 mg/l. Higher values of Nitrate were estimated during Jan-Feb, 2014 (0.82mg/l) and the lowest Nov-Dec, 2014 (0.07mg/l). The lowest values of Potassium were recorded during Jan-Feb, 20130.4 mg/l and the highest value 2.7 mg/l in the month of Mar-Apr, 2014. The total Suspended solids content were recorded highest during Mar- Apr, 2014 (50 mg/l) and lowest Jul-Aug, 2014 (3.5 mg/l). The Lowest concentration of Fluoride was observed at 0.03 mg/l in the month of Jan-Feb, 2014 and it was highest in the month of Jul-Aug, 2014 at 0.70 mg/l. In present study the various kinds of pollutants in the water quality of the study sites and activity has been represented (Figures 1-4) of Pichola lake and Fateh Sagar.
Discussion
The use of water quality indices to verify the impact of Cordoba City (Argentina) on Suquia River [13]. water quality evaluation and trend analysis in selected watersheds of the Atlantic region of Canada [14]. An innovative index for evaluating water quality in streams [15]. Change (2005) reported spatial and temporal variations of water quality in the river and its tributaries in Seoul, South Korea, 1993–2002 [16]. The development of chemical index as a measure of instream water quality in response to land-use and land-cover changes [17]. That application of CCME Water Quality Index to monitor water quality: a case of the Mackenzie River Basin Canada [18]. Long-term water quality monitoring of the Sejnane reservoir in northeast Tunisia [19]. Assessed that application of two water quality indices as monitoring and management tools of rivers Case study: the Imera Meridiopnale river Italy [20]. Contributed application of physicochemical data for waterquality assessment of watercourses in the Gdansk municipality (South Baltic coast) [21]. Analysis of Ground Water Quality Parameters: A Review due to human and industrial activities, the ground water is contaminated [22]. This is the serious a problem at present. Thus the analysis of the water quality is very important to preserve and protect the natural eco system. The study of Physico-chemical and biological characteristics of this ground water sample suggests that the evaluation of water quality parameters as well as water quality management practices should be carried out periodically to protect the water resources.
Conclusion
The appraisal of lakes water in Udaipur’s lakes with respect to bacteriological and physicochemical pollution is of immense significance for improving the living standard and quality of life in this region. Therefore, monitoring of microbial contamination and pathogenic bacteria genera on a periodic basis is important and useful to arrive at measures that can act as indicators of water quality and pollution.
For more Open Access Journals in Juniper Publishers please click on: https://juniperpublishers.com/journals.php
For more articles in Open Access Journal of Environmental Sciences & Natural Resources please click on: https://juniperpublishers.com/ijesnr/
To know more about Journal of Environmental Sciences & Natural Resources
To read more…Fulltext please click on: https://juniperpublishers.com/ijesnr/IJESNR.MS.ID.555560.php
#juniper publishers publons#Juniper Publishers group#juniper publishers journals#Juniper Publishers Review#Ecological psychology#Limnology#Geography#Geo Morphology#Environmental Chemistry#Climatology
0 notes
Text
Water Quality Analyzer Market Repository of Analysis and Information for Every Facet of 2026
Water is an important resource for human beings, as it is used in exhaustive applications such as drinking, food, manufacturing, cooling systems, steam generation, chemicals, research, and agriculture. All these applications require water with specific prerequisite properties and purity. Water has various physical and chemical qualities such as pH, purity, metal and salt content, dissolved gas content, and microbe presence. These qualities vary for different applications. Water quality analyzers determine the fitness of water for usage in a specific application. Several types of water quality analyzers such as TOC analyzers, BOD analyzers, oil in water analyzers, sulfide analyzers, turbidity analyzers, pH meters, spectrophotometers, and multiparameter colorimeters are available in the market.
The water quality analyzer market is largely propelled by the rising awareness and improvements in quality of water required for specific applications across all end-user industries. Advancements in technology are improving the understanding of effects of water quality on various applications, thereby leading to higher demand for water quality analyzers. Furthermore, implementation of stringent government regulations in most developed countries with regard to better quality of drinking water and rise in concerns over water pollution and wastewater management are some of the major factors propelling the water quality analyzer market across the globe. Industrial waste water causes severe damage to the environment, including local water bodies. Governments and environment protection organizations are therefore compelling industries to pretreat and analyze the water which is discarded. This is boosting the water quality analyzer market. However, the costs associated with testing and analyzing wastewater are usually high. Companies in the developing economies are largely ignorant about water analysis. This is restraining the water quality analyzer market in developing regions.
The water quality analyzer market, in terms of type has been segmented into TOC analyzer, pH meter, multiparameter colorimeter, turbidity meter, dissolved gas (oxygen) meter, and others. Among the products, pH meters and TOC analyzers accounted for significant share of the water quality analyzer market across the globe. The criticality of pH levels, i.e. acidity or alkalinity of water, in several applications makes pH analyzers significantly important. These products or analyzers can be either portable or bench mounted depending upon the location of water and functionality. Based on application, the water quality analyzer market has been classified into industrial, environmental, laboratory, sanitation and sewage treatment, and others. Industrial and laboratory applications accounted for the large share of the water quality analyzer market in 2015, as they need close monitoring of water quality for efficient functioning of equipment & machinery and accurate results in case of laboratory applications.
Request to view Sample Report:
https://www.transparencymarketresearch.com/sample/sample.php?flag=B&rep_id=19940
Based on geography, the water analyzer market has been divided into Asia Pacific, Europe, North America, Latin America, and Middle East & Africa. Developed regions such as Europe and North America collectively accounted for more than 60% share of the global water analyzer market. Implementation of stringent government regulations on environmental protection and curbing of water pollution is the primary factor driving the demand of water quality analyzers in these regions. Europe and North America also lead in research and development in all fields, resulting in high demand for water quality analyzers for laboratory and research segment. Asia Pacific is also a major market for water quality analyzers due to the rising industrialization and urbanization in China and India. The population explosion in these countries is also anticipated to propel the demand for water quality analyzers in sewer & sanitation and water distribution applications.
Key players manufacturing water quality analyzers include General Electric Company, Thermo Fisher Scientific, Inc., Forbes Marshall, Emerson Electric Co., Honeywell International Inc., and Thermo Fisher Scientific, Inc.
About Us
Transparency Market Research (TMR) is a global market intelligence company providing business information reports and services. The company’s exclusive blend of quantitative forecasting and trend analysis provides forward-looking insight for thousands of decision makers. TMR’s experienced team of analysts, researchers, and consultants use proprietary data sources and various tools and techniques to gather and analyze information.
TMR’s data repository is continuously updated and revised by a team of research experts so that it always reflects the latest trends and information. With extensive research and analysis capabilities, Transparency Market Research employs rigorous primary and secondary research techniques to develop distinctive data sets and research material for business reports.
Contact Us
Transparency Market Research
State Tower,
90 State Street,
Suite 700,
Albany NY - 12207
United States
Tel: +1-518-618-1030
USA - Canada Toll Free: 866-552-3453
Email:[email protected]
Website: http://www.transparencymarketresearch.com
0 notes
Text
Water Quality Analyzer Market – Overview on Key Innovations 2026
Water is an important resource for human beings, as it is used in exhaustive applications such as drinking, food, manufacturing, cooling systems, steam generation, chemicals, research, and agriculture. All these applications require water with specific prerequisite properties and purity.
Read report Overview-
https://www.transparencymarketresearch.com/water-quality-analyzer-market.html
Water has various physical and chemical qualities such as pH, purity, metal and salt content, dissolved gas content, and microbe presence. These qualities vary for different applications. Water quality analyzers determine the fitness of water for usage in a specific application. Several types of water quality analyzers such as TOC analyzers, BOD analyzers, oil in water analyzers, sulfide analyzers, turbidity analyzers, pH meters, spectrophotometers, and multiparameter colorimeters are available in the market.
Request Brochure@
https://www.transparencymarketresearch.com/sample/sample.php?flag=B&rep_id=19940
The water quality analyzer market is largely propelled by the rising awareness and improvements in quality of water required for specific applications across all end-user industries. Advancements in technology are improving the understanding of effects of water quality on various applications, thereby leading to higher demand for water quality analyzers. Furthermore, implementation of stringent government regulations in most developed countries with regard to better quality of drinking water and rise in concerns over water pollution and wastewater management are some of the major factors propelling the water quality analyzer market across the globe. Industrial waste water causes severe damage to the environment, including local water bodies.
REQUEST FOR COVID19 IMPACT ANALYSIS –
https://www.transparencymarketresearch.com/sample/sample.php?flag=covid19&rep_id=19940
Governments and environment protection organizations are therefore compelling industries to pretreat and analyze the water which is discarded. This is boosting the water quality analyzer market. However, the costs associated with testing and analyzing wastewater are usually high. Companies in the developing economies are largely ignorant about water analysis. This is restraining the water quality analyzer market in developing regions.
More Trending Reports by Transparency Market Research –
https://www.nsenergybusiness.com/pressreleases/companies/transparency-market-research/stakeholders-in-plastic-recycling-market-actively-looking-for-improve-recycling-rates-of-discarded-plastics-packaging-across-economies-tmr/
The water quality analyzer market, in terms of type has been segmented into TOC analyzer, pH meter, multiparameter colorimeter, turbidity meter, dissolved gas (oxygen) meter, and others. Among the products, pH meters and TOC analyzers accounted for significant share of the water quality analyzer market across the globe. The criticality of pH levels, i.e. acidity or alkalinity of water, in several applications makes pH analyzers significantly important. These products or analyzers can be either portable or bench mounted depending upon the location of water and functionality. Based on application, the water quality analyzer market has been classified into industrial, environmental, laboratory, sanitation and sewage treatment, and others. Industrial and laboratory applications accounted for the large share of the water quality analyzer market in 2015, as they need close monitoring of water quality for efficient functioning of equipment & machinery and accurate results in case of laboratory applications.
Based on geography, the water analyzer market has been divided into Asia Pacific, Europe, North America, Latin America, and Middle East & Africa. Developed regions such as Europe and North America collectively accounted for more than 60% share of the global water analyzer market. Implementation of stringent government regulations on environmental protection and curbing of water pollution is the primary factor driving the demand of water quality analyzers in these regions. Europe and North America also lead in research and development in all fields, resulting in high demand for water quality analyzers for laboratory and research segment. Asia Pacific is also a major market for water quality analyzers due to the rising industrialization and urbanization in China and India. The population explosion in these countries is also anticipated to propel the demand for water quality analyzers in sewer & sanitation and water distribution applications.
Key players manufacturing water quality analyzers include General Electric Company, Thermo Fisher Scientific, Inc., Forbes Marshall, Emerson Electric Co., Honeywell International Inc., and Thermo Fisher Scientific, Inc.
0 notes
Last Seen Blogs

lobuenoesinmortal
reír te salva

cubixyblue
CubixyBlue

golmaryam-mezon
مزون گل مریم

golmaryam-mezon
مزون گل مریم