#lidar point cloud classifications
Explore tagged Tumblr posts
Visit Tumblr Blog
Explore Tumblr blogs with no restrictions, modern design and the best experience.
Last Seen Tumblr Blogs


Fun Fact
Tumblr was created by web developers David Karp and Marco Arment.
Text
Unleashing the Potential of Lidar: Innovative Data Processing Approaches
In the ever-evolving realm of technology, Lidar (Light Detection and Ranging) has emerged as a game-changing technology with applications spanning from autonomous vehicles to environmental monitoring. However, the true power of Lidar lies in its data processing capabilities. In this blog post, we will explore innovative data processing approaches for Lidar technology and how Polosoft Technologies is at the forefront of harnessing its potential.
I. The Rise of Lidar Technology

Lidar, a remote sensing technology that uses laser pulses to measure distances and create detailed 3D maps of environments, has gained substantial traction in recent years. The applications of Lidar are vast, including autonomous driving, surveying, archaeology, and forestry management, among many others. This technology has revolutionized data collection, but the real magic happens in the data processing phase.
II. Traditional Data Processing vs. Innovative Approaches
Traditional data processing for Lidar involves basic filtering and point cloud generation. While this approach is adequate for many applications, innovative methods have the potential to take Lidar to new heights. Here's a comparison of the two:
Traditional Data Processing:
Filtering out noise and unwanted points.
Basic point cloud generation.
Limited to basic applications.
Innovative Data Processing:
Advanced noise reduction algorithms.
Enhanced point cloud processing, including feature extraction.
Expanded applicability to complex scenarios, such as urban environments and forestry.
III. Polosoft Technologies: Pioneering Innovative Lidar Data Processing
At Polosoft Technologies, we have embraced the power of Lidar and are continuously pushing the boundaries of what this technology can achieve. Our innovative data processing approaches for Lidar include:
Noise Reduction Algorithms:
We've developed cutting-edge noise reduction algorithms that significantly improve the quality of Lidar data, making it suitable for even the most demanding applications.
Feature Extraction:
Our advanced data processing techniques enable us to extract valuable features from Lidar point clouds, such as building outlines, vegetation, and road infrastructure. This opens up new possibilities for applications like urban planning and forestry management.
Object Recognition:
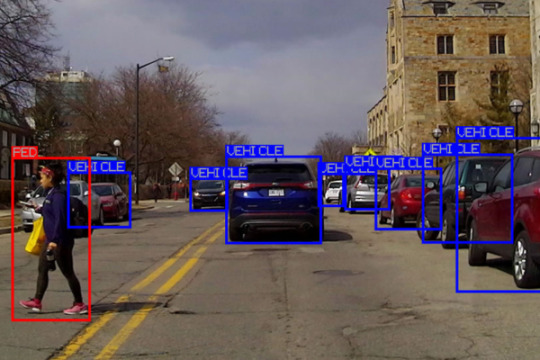
Leveraging Lidar data, we have pioneered object recognition algorithms that can identify and classify objects like vehicles, pedestrians, and road signs. This is a crucial component for autonomous driving and advanced security systems.
Integration with AI:
We've seamlessly integrated Lidar data with AI and machine learning models, enabling real-time decision-making and analysis in various industries.
IV. Real-World Applications
The innovative Lidar data processing approaches developed by Polosoft Technologies have far-reaching implications across industries. Some notable applications include:
Autonomous Vehicles:
Lidar data is instrumental in helping self-driving cars navigate and avoid obstacles. Our advanced data processing ensures the highest level of safety and reliability.
Environmental Monitoring:
Lidar-equipped drones and aircraft can monitor forests and other ecosystems with unmatched precision, aiding in conservation and resource management.
Infrastructure Planning:
Lidar data is used to assess and plan urban infrastructure, making cities more efficient and sustainable.
Disaster Management:
Rapid mapping of disaster-stricken areas using Lidar technology helps first responders and authorities to make informed decisions and save lives.
V. Conclusion
The true potential of Lidar lies in its innovative data processing approaches, and Polosoft Technologies is at the forefront of this transformation. By pushing the boundaries of Lidar technology, we are enabling a new era of applications across various industries. As Lidar continues to evolve and advance, the possibilities are limitless, and Polosoft Technologies is committed to staying at the forefront of this exciting field. Join us in embracing the power of Lidar and unlocking a world of possibilities.
#lidar services#lidar technology#lidar data processing#lidar classification#lidar point cloud classifications
0 notes
Text
IEEE Transactions on Artificial Intelligence, Volume 6, Issue 3, March 2025
1) Fair Machine Learning in Healthcare: A Survey
Author(s): Qizhang Feng, Mengnan Du, Na Zou, Xia Hu
Pages: 493 - 507
2) Regret and Belief Complexity Tradeoff in Gaussian Process Bandits via Information Thresholding
Author(s): Amrit Singh Bedi, Dheeraj Peddireddy, Vaneet Aggarwal, Brian M. Sadler, Alec Koppel
Pages: 508 - 517
3) An Evolutionary Multitasking Algorithm for Efficient Multiobjective Recommendations
Author(s): Ye Tian, Luke Ji, Yiwei Hu, Haiping Ma, Le Wu, Xingyi Zhang
Pages: 518 - 532
4) Deep-Learning-Based Uncertainty-Estimation Approach for Unknown Traffic Identification
Author(s): Siqi Le, Yingxu Lai, Yipeng Wang, Huijie He
Pages:��533 - 548
5) ReLAQA: Reinforcement Learning-Based Autonomous Quantum Agent for Quantum Applications
Author(s): Ahmad Alomari, Sathish A. P. Kumar
Pages: 549 - 558
6) Traffexplainer: A Framework Toward GNN-Based Interpretable Traffic Prediction
Author(s): Lingbai Kong, Hanchen Yang, Wengen Li, Yichao Zhang, Jihong Guan, Shuigeng Zhou
Pages: 559 - 573
7) Personalized Learning Path Problem Variations: Computational Complexity and AI Approaches
Author(s): Sean A. Mochocki, Mark G. Reith, Brett J. Borghetti, Gilbert L. Peterson, John D. Jasper, Laurence D. Merkle
Pages: 574 - 588
8) Prompt Learning for Few-Shot Question Answering via Self-Context Data Augmentation
Author(s): Jian-Qiang Qiu, Chun-Yang Zhang, C. L. Philip Chen
Pages: 589 - 603
9) MDA-GAN: Multiscale and Dual Attention Generative Adversarial Network for Bone Suppression in Chest X-Rays
Author(s): Anushikha Singh, Rukhshanda Hussain, Rajarshi Bhattacharya, Brejesh Lall, B.K. Panigrahi, Anjali Agrawal, Anurag Agrawal, Balamugesh Thangakunam, D.J. Christopher
Pages: 604 - 613
10) Image Tampering Detection With Frequency-Aware Attention and Multiview Fusion
Author(s): Xu Xu, Junxin Chen, Wenrui Lv, Wei Wang, Yushu Zhang
Pages: 614 - 625
11) NICASU: Neurotransmitter Inspired Cognitive AI Architecture for Surveillance Underwater
Author(s): Mehvish Nissar, Badri Narayan Subudhi, Amit Kumar Mishra, Vinit Jakhetiya
Pages: 626 - 638
12) Att2CPC: Attention-Guided Lossy Attribute Compression of Point Clouds
Author(s): Kai Liu, Kang You, Pan Gao, Manoranjan Paul
Pages: 639 - 650
13) Neural Network-Based Ensemble Learning Model to Identify Antigenic Fragments of SARS-CoV-2
Author(s): Syed Nisar Hussain Bukhari, Kingsley A. Ogudo
Pages: 651 - 660
14) Bridging the Climate Gap: Multimodel Framework With Explainable Decision-Making for IOD and ENSO Forecasting
Author(s): Harshit Tiwari, Prashant Kumar, Ramakant Prasad, Kamlesh Kumar Saha, Anurag Singh, Hocine Cherifi, Rajni
Pages: 661 - 675
15) Model-Heterogeneous Federated Graph Learning With Prototype Propagation
Author(s): Zhi Liu, Hanlin Zhou, Xiaohua He, Haopeng Yuan, Jiaxin Du, Mengmeng Wang, Guojiang Shen, Xiangjie Kong, Feng Xia
Pages: 676 - 689
16) Semisupervised Breast MRI Density Segmentation Integrating Fine and Rough Annotations
Author(s): Tianyu Xie, Yue Sun, Hongxu Yang, Shuo Li, Jinhong Song, Qimin Yang, Hao Chen, Mingxiang Wu, Tao Tan
Pages: 690 - 699
17) NL-CoWNet: A Deep Convolutional Encoder–Decoder Architecture for OCT Speckle Elimination Using Nonlocal and Subband Modulated DT-CWT Blocks
Author(s): P. S. Arun, Bibin Francis, Varun P. Gopi
Pages: 700 - 709
18) Multiattribute Deep CNN-Based Approach for Detecting Medicinal Plants and Their Use for Skin Diseases
Author(s): Prachi Dalvi, Dhananjay R. Kalbande, Surendra Singh Rathod, Harshal Dalvi, Amey Agarwal
Pages: 710 - 724
19) Deep Feature Unsupervised Domain Adaptation for Time-Series Classification
Author(s): Nannan Lu, Tong Yan, Song Zhu, Jiansheng Qian, Min Han
Pages: 725 - 737
20) Enhanced LiDAR-Based Localization via Multiresolution Iterative Closest Point Algorithms and Feature Extraction
Author(s): Yecheng Lyu, Xinkai Zhang, Feng Tao
Pages: 738 - 746
21) Swin-MGNet: Swin Transformer Based Multiview Grouping Network for 3-D Object Recognition
Author(s): Xin Ning, Limin Jiang, Weijun Li, Zaiyang Yu, Jinlong Xie, Lusi Li, Prayag Tiwari, Fernando Alonso-Fernandez
Pages: 747 - 758
22) A Two-Level Neural-RL-Based Approach for Hierarchical Multiplayer Systems Under Mismatched Uncertainties
Author(s): Xiangnan Zhong, Zhen Ni
Pages: 759 - 772
23) Adaptive Neural Network Finite-Time Event Triggered Intelligent Control for Stochastic Nonlinear Systems With Time-Varying Constraints
Author(s): Jia Liu, Jiapeng Liu, Qing-Guo Wang, Jinpeng Yu
Pages: 773 - 779
24) DDM-Lag: A Diffusion-Based Decision-Making Model for Autonomous Vehicles With Lagrangian Safety Enhancement
Author(s): Jiaqi Liu, Peng Hang, Xiaocong Zhao, Jianqiang Wang, Jian Sun
Pages: 780 - 791
0 notes
Text
Automotive RADAR Market Analysis Exploring Emerging Technologies
The automotive radar market analysis suggests a noteworthy growth trajectory propelled by the rising need for driverless vehicles and advanced driver assistance systems (ADAS). Radar technology is being used by automakers to improve functions like collision avoidance, adaptive cruise control, and blind-spot identification in response to growing concerns about car safety. The development of radar technology has seen significant investments as a result of this trend, which is driven by customer demands for safety and regulatory regulations. Radar system use is predicted to increase as cars become more automated and networked, which will enhance vehicle performance and safety.
Given this, a thorough examination of the automotive radar market highlights significant trends influencing the sector, such as the move to higher frequency radar systems that provide better resolution and range. The market is also distinguished by the introduction of new competitors and partnerships between technology and automotive firms, which spur innovation. The competitive environment is changing, and leading companies are concentrating on creating small and affordable radar systems. Because of this, the automotive radar market is expected to grow at a healthy rate, with a predicted rise in market share as more automakers use these systems in order to comply with legal and consumer demands.
The global automotive radar market is projected to grow from USD 6.6 billion in 2024 to USD 33.6 billion by 2030, registering a CAGR of 31.1%.
Download PDF Brochure @ https://www.marketsandmarkets.com/pdfdownloadNew.asp?id=11272971
Opportunity: 4D imaging radar
4D imaging radar is an attractive opportunity, as it can offer better safety to the vehicle by providing precise information on range, velocity, elevation, and others. This can be attributed to its ability to capture 4D data points per frame. The use of dense and high-resolution point clouds will significantly affect the development of object classification, detection, and tracking based on radar data. 4D imaging radar does not have any performance limitations based on the weather and light conditions. This is not properly addressed by normal radar, which has led to LiDAR technology occupying the market. Object detection and classification will play a crucial role in offering safety to vehicles. The application of 4D imaging radar is expected to offer better performance for the detection and classification of objects, and this is likely to create opportunities in the automotive radar market.
Europe is the largest market for automotive radar during the forecast period.
The European automotive radar market is growing due to the region's stringent safety regulations and a strong emphasis on vehicle safety standards. The European Union (EU) has implemented rigorous safety mandates that require new vehicles to be equipped with advanced driver assistance systems (ADAS), which heavily rely on radar technology. For instance, the General Safety Regulation, which came into effect in 2022, mandates the inclusion of features such as automatic emergency braking, lane keeping assistance, and advanced emergency braking systems in all new cars. These regulations are designed to reduce traffic accidents and enhance road safety, significantly driving the demand for automotive radar systems. Germany is projected to be the largest European market due to the high demand for high-end premium cars equipped with ADAS features and technologies such as adaptive cruise control, adaptive braking system, blind spot detection, forward collision system, and lane departure warning, which all depends heavily on radar system for efficient functioning. In February 2024, Audi announced that it would update its Q2 SUV model with a new infotainment system and safety features, including ADAS. The vehicle is set to launch in the mid of 2024. Thus, rising government regulation towards safety and launching new vehicles will drive the market in Europe during the forecast period.
Key Market Players:
The automotive radar market is dominated by established players such as Robert Bosch GmbH (Germany), Continental AG (Germany), Aptiv (Ireland), Denso Corporation (Japan), and NXP Semiconductors (Netherlands).
Request Free Sample Report @ https://www.marketsandmarkets.com/requestsampleNew.asp?id=75536718
0 notes
Text
Anatomy of Autonomous Vehicles
April 2, 2024
by dorleco
with no comment
Autonomous Vehicle Technology
Edit

Overview of Autonomous Vehicle
There are various ways to implement how an autonomous vehicle perceives its surroundings, makes decisions, and carries out directions. The degree of autonomy can be calculated based on all the tasks that the vehicle completes. All of these implementations, though, share basic behavior at the system level.
Due to the various methods OEMs utilize to enable self-driving technology, the extent of vehicle autonomy can be a confusing topic. The five levels of autonomy established by the Society of Automotive Engineers (SAE) are currently regarded as the industry standard. These five tiers are summed up in the figure below:
In general, Levels 1 and 2 help the driver with certain active safety features, which can come in handy in dire situations. The features only serve to improve the safety and comfort of driving—the human being is still the principal operator.
The driving becomes automatic at level 3, but under certain restricted driving circumstances, the operational design domain (ODD) is defined by these circumstances. The vehicle’s ODD increases until it reaches level 5 as the machine learning algorithms within learn how to handle edge circumstances (bad weather, unpredictable traffic, etc.).
Anatomy of a Self-Driving Car
1. Sensing system
In the architecture of autonomous vehicles, sensors are the first significant system. They observe the environment and supply the information needed to locate the car on a map. Multiple sensors are needed for any autonomous vehicle. These include cameras for computer vision-based object detection and classification, LiDARs for building 3D point clouds of the environment to identify objects precisely, radars for determining the direction and speed of other vehicles, inertial measurement units for assisting in determining the direction and speed of the vehicle, GNSS-RTK systems (such as GPS) for localizing the vehicle, ultrasonic sensors for low-range distance measurement, and many more. Positioning each sensor around the vehicle body to provide 360° sensor coverage—which aids in object detection even in the blind spot—is a crucial design factor.

The placement of several sensors to guarantee there are few blind spots is depicted in the graphic.
2. Perception
An autonomous car has a lot of sensors; therefore, to comprehend and perceive its environment, data from several sensors must be combined (a process known as sensor fusion). This requires knowing the location of the road (semantic segmentation), how things can be categorized (supervised object detection), and the position, velocity, and direction of motion of each object (car, pedestrian, etc.) (Tracking). Perception is the key to comprehending all of this.
3. Map-making and Localization
During the localization process, the car makes extremely precise three-dimensional maps of its surroundings using sensor data, and it displays the location of the vehicle on the map in real-time. Every sensor offers a different perspective on the environment, which aids in the system’s mapping of its surroundings. The host car is then located with the assistance of these maps by comparing it with the recently obtained sensor data. Depending on the sensor being used, a variety of localization techniques can be applied.
Whereas vision-based localization makes use of images, LiDAR-based localization compares its point clouds with the available 3D maps. To get high-fidelity findings, many localization algorithms additionally link Real-Time Kinematic Positioning (RTK) with a GNSS (Global Navigation Satellite System) and combine the estimates with readings from an inertial measurement unit (IMU) sensor.
4. Prediction and planning
The system must first anticipate the actions of other dynamic objects to design a route for the car to follow after localizing the vehicle. This problem can be solved by regression algorithms like decision trees, neural networks, and Bayesian regression, among others.
Subsequently, the planning block utilizes the intelligence of the vehicle to comprehend its condition in the surroundings and devise strategies to arrive at the desired location. This covers both local and global planning (e.g., the route to follow while traveling from point A to point B) and decisions on whether to halt at an intersection or plan an overtaking maneuver.
Lastly, the control block is where the actuators get the commands from the driver to carry out the plan that was decided upon in the preceding block. Typically, a feedback system works in tandem with the controller to continuously monitor how closely the car is adhering to the plan. The control mechanism can also vary depending on the type of movement to be performed and the required level of automation. Among other things, these techniques can be proportional-integral-derivative (PID), model predictive control (MPC), or linear quadratic regulators (LQR).
Dorle Controls: Development and Testing of Autonomous Systems
Our areas of expertise at Dorle Controls include functional safety, simulation, feature integration, testing, and application software development for autonomous systems. This comprises applications of data annotation services, neural networks, image processing, sensor fusion, and computer vision, along with features including AEB, ACC, LKA, LCA, FCW, park assist, road texture classification, driver monitoring, and facial landmark tracking. Write to [email protected] to learn more.
0 notes
Text
Best Converting Point Cloud to BIM and BIM Laser Scanning
Introduction:
In the ever-evolving landscape of construction and design, the integration of cutting-edge technologies has become paramount for achieving efficiency, accuracy, and precision. Among these technologies, Point Cloud to Building Information Modeling (BIM) conversion and BIM Laser Scanning stand out as game-changers in streamlining project workflows and enhancing project outcomes. In this article, we delve into the best practices and strategies for maximizing the potential of these technologies.
Understanding Point Cloud to BIM Conversion:
Point Cloud to BIM conversion involves transforming the raw data captured from 3D laser scanning technologies, such as LiDAR (Light Detection and Ranging) or photogrammetry, into intelligent BIM models. This process enables architects, engineers, and construction professionals to work with highly accurate and detailed representations of existing structures or environments. the power of Point Cloud to BIM conversion, project teams can expedite the design process, minimize errors, and improve coordination among stakeholders.
Additionally, the rich visualizations and precise measurements provided by these models facilitate effective communication and stakeholder engagement, driving consensus and alignment on project objectives. As a result, Point Cloud to BIM conversion not only enhances the efficiency of individual projects but also contributes to the advancement of the construction industry as a whole, promoting innovation and excellence in every aspect of the built environment.
To ensure the best outcomes in Point Cloud to BIM conversion, it's crucial to follow a systematic approach:
- Data Acquisition: Utilize advanced scanning technologies like the Trimble X7 or Faro Focus to capture comprehensive point cloud data with high precision and resolution.
- Data Processing: Employ specialized software such as Autodesk Recap or Leica Cyclone to register, clean, and align point cloud data, ensuring accuracy and consistency.
- Model Generation: Utilize BIM authoring software like Autodesk Revit or Bentley MicroStation to create intelligent BIM models based on the processed point cloud data. Implement best practices for modeling, including proper layering, element classification, and parameterization.
- Quality Assurance: Conduct thorough quality checks and validations to verify the accuracy and completeness of the BIM models in comparison to the original point cloud data.
2. Leveraging BIM Laser Scanning:
BIM Laser Scanning utilizes laser scanning technology to acquire accurate 3D measurements of pre-existing structures or surroundings. These measurements are subsequently amalgamated into BIM workflows to expedite design, renovation, and construction procedures.
Key strategies for maximizing the benefits of BIM Laser Scanning include:
- Detailed Site Documentation: Utilize laser scanning to create comprehensive as-built documentation of existing structures, capturing intricate details and dimensions with unparalleled accuracy.
- Clash Detection and Coordination: Integrate laser scanning data into BIM coordination workflows to identify clashes and conflicts between design elements, enabling early detection and resolution of issues.
- Progress Monitoring: Use laser scanning for ongoing monitoring of construction progress, comparing as-built conditions with design models to track deviations and ensure project alignment.
- Retrofit and Renovation: Employ laser scanning to facilitate retrofit and renovation projects by capturing precise measurements of existing conditions, enabling designers to work with accurate data and streamline renovation processes.
3. Best Practices for Integration:
To fully harness the potential of Point Cloud to BIM conversion and BIM Laser Scanning, it's essential to prioritize integration across project phases and disciplines:
- Collaboration: Foster collaboration between architects, engineers, contractors, and scanning professionals to ensure seamless data exchange and integration throughout the project lifecycle.
- Training and Education: Invest in training programs to equip team members with the skills and knowledge required to effectively utilize scanning technologies and BIM workflows.
- Standardization: Establish standardized protocols and guidelines for data capture, processing, and model generation to maintain consistency and quality across projects.
- Continuous Improvement: Embrace a culture of continuous improvement, leveraging feedback and lessons learned from each project to refine processes and optimize outcomes.
Conclusion:
In addition to streamlining project workflows and improving accuracy, the adoption of Point Cloud to BIM conversion and BIM Laser Scanning fosters innovation within the construction sector. These technologies empower teams to explore creative design solutions, optimize resource allocation, and mitigate risks effectively. Furthermore, by embracing a data-driven approach, project stakeholders can make informed decisions throughout the project lifecycle, leading to improved cost control and schedule management. Ultimately, the integration of these advanced technologies represents a significant step forward in the evolution of the construction industry, paving the way for sustainable growth, enhanced productivity, and unparalleled project success.
#scan to bim#point cloud to bim#bim services#3d laser scanning#as-built drawing#bim laser scanning#scan to revit#scan to cad#as-built drawings#point cloud to cad
0 notes
Text
It’s Time that Businesses around the world startadapting Data Annotation & Labelling into their operations
Do you know? Artificial Intelligence has the potential to deliver an additional Global Economic Activity of $13 trillion by 2030.
The foundation of AI and ML algorithms, data annotation, generates a highly accurate contextual information that has a direct impact on algorithmic performance. For AI and ML models to recognize and analyse incoming data accurately, annotated data is essential.
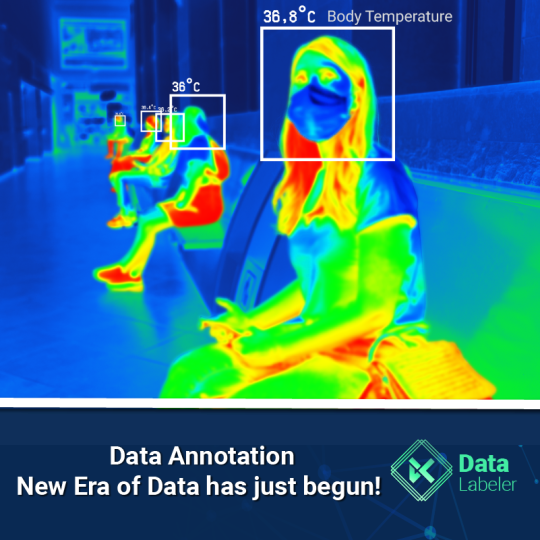
Worldwide spending on third-party data annotation solutions is anticipated to increase seven times by 2023 compared to 2018, accounting for nearly one-fourth of all spending on annotation.
Large training dataset requirements, which are frequently specific to individual enterprises and which data annotation services are addressing, are at the heart of the AI revolution.
Data Annotation: New Era of Data has just begun! All machine learning and deep learning algorithms depend on data in some way. That is what drives these smart and intricate algorithms to provide cutting-edge performances.
So, one must feed the algorithms with data which is appropriately structured and labelled if they want to create AI models that are actually accurate. And this is where the Data Annotation process makes an absolutely sense to the businesses.
Data must be annotated for machine learning algorithms to use it and to learn how to carry out specific tasks.
Data Annotation – what is it?
This simply refers to marking the region or area of interest; this kind of annotation is unique to photographs and videos. Apart from that, adding relevant information, like metadata, and categorising text data are the main components of annotation.
Data annotation typically falls under the topic of supervised learning in machine learning, where the learning algorithm links input with the relevant output and refines itself to minimise errors.
Types of Data Annotation
Image Annotation The process of labelling an image is known as image annotation. It makes sure that an annotated area in a given image is recognised by a machine learning system as a certain object or class.
Bounding box: Drawing a rectangle around a specific item in an image is known as “bounding.” Bounding boxes’ edges should contact the labelled object’s furthest pixels.
Object Detection: It can be used to annotate items that need to be grasped by a robot, such as those on flat planes that need to be navigated, like cars or planes.
Polygons: Users can make a pixel-level mask around the intended object which is why polygons are useful.
Semantic Segmentation :The process of grouping comparable parts or pixels of an object in an image is known as semantic segmentation. This method of annotating data enables the machine learning algorithm to learn and comprehend a particular feature and can aid in the classification of anomalies.
Best Use Case Scenario Data Labeling and Annotation
Rise of Virtual Assistants: Just like Alexa and Siri, developing next-generation personal assistants involves a lot of text annotation. This is necessary because there are so many subtleties in human speech that the annotators must label every piece of textual material to aid the system in understanding them.
Increasing Crop Yield: With data annotation, now farmers can find the parts of the farmland that needs more cultivation with the aid of drones that are driven by computer vision technology. For farmers to make the most of their available farmland in order to successfully yeild crops.
Robotic Process Automation: A lot of the repetitive tasks that are performed in factories, farms, warehouses, and other industries can be automated to relieve some of the workload from human employees. However, in order to see and interact with the physical environment around them, these robots depend on LiDAR and 3D Point Clouds.
Development of Autonomous Vehicles: AI vehicles are taught using a variety of image and video training sets, which call for data annotators to label different aspects of the images. Simple examples include drawing a bounding box around another object, or more complex examples include semantic segmentation, LiDAR, and 3D point cloud labelling.
Wondering how to start with Data Labeling Service?
In comparison to insourcing or in-house annotation, outsourcing data annotation has proven to be both commercially and technically superior. In fact, a report claims that considering the infrastructure, expertise, and employment costs associated with it, in-house data annotation is likely to prove four to five times more expensive than outsourcing.
Outsourcing also means a stronger professional dedication and greater scalability. Additionally, it includes a higher level of professional experience and expertise as well as significant and long-lasting cost savings from ready infrastructure without having to pay for hiring costs. Data Labeler, specializes in creating quality labeled datasets for machine learning and AI initiatives. Want to know how? Contact us!
0 notes
Text
Do you know how many types of LiDAR are there?
LiDAR has various applications in surveying, sensors, drones and laser scanning. So people are fairly acquainted with this technology, which is among the major emerging technologies driving the age of automation.
But there are many different types of LiDARs based on their functionality and inherent characteristics. Let’s have a look at the classification of LiDARs and how different types of LiDARs have different uses. For more at Topographic Lidar
Based on functionality
Airborne
As the name suggests, Airborne LiDARs are mounted on top of a helicopter or drone. The light is first emitted towards the ground and then it moves towards the sensor. Airborne LiDAR is further classified into topographic and bathymetric.
Topographic LiDAR
It is used mainly in monitoring and mapping topography of a region. So it has its applications in geomorphology, urban planning, landscape ecology, coastal engineering, survey assessment etc.
Bathymetric LiDAR
Bathymetric LiDARs are used in measuring the depth of water bodies. In a bathymetric LiDAR survey, the infrared light is reflected back to the aircraft from the land and water surface, while the additional green laser travels through the water column. Bathymetric information is crucial near coastlines, in harbors, and near shores and banks. Terrestrial LiDAR
Terrestrial LIDAR can be installed either on a tripod or on a moving vehicle. It collects data points that help in the highly-accurate identification of data. This has its application in surveying and creating 3D Modeling. Terrestrial LiDAR can be either Mobile or Static
Mobile: It is mostly used to analyze infrastructure and observe roads. Mobile LiDAR systems mostly include sensors, camera and GPS.
Static: Static LiDAR is more portable, handy to use. It collects cloud points from a fixed location and is used in mining and archaeology.
Based on other classifications
DIAL:
DIAL is an acronym of Differential Absorption LiDAR sensing of ozone. It is mostly used to measure Ozone in the lower atmosphere.
Raman LIDAR
It is used for profiling water vapor and aerosol
Wind LiDAR: Wind LIDAR is used to measure wind speed and direction with high accuracy Wind data has been conventionally gathered with great difficulty due to multiple measurement points leading to inaccuracies. Using LiDAR one can measure wind speed, direction as well as turbulence
For more at Topographic survey
Spaceborne LiDAR
The potential of LiDAR extends beyond the earth as well. Premier space agencies including NASA are using LiDAR in detection and tracking.
HSRL LiDAR
The NASA airborne High Spectral Resolution LiDAR (HSRL) is used to characterize clouds and small particles in the atmosphere, called aerosols. From an airborne platform, the HSRL scientist team analyzes aerosol size, composition, distribution and movement.
The HSRL instrument is an innovative technology that is similar to radar; however, in the case of LiDAR, radio waves are replaced with laser light.
The HSRL technique utilizes spectral distribution of the LiDAR return signal to discriminate aerosol and molecular signals and thereby measure aerosol extinction and backscatter independently.
0 notes
Text
Image Annotation For Deep Learning
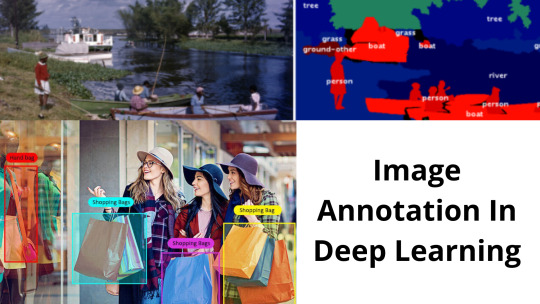
Data can take many forms. Images are widely used for the processing of visual data. Images are made from a grid of pixels, which represents our three-dimensional reality.
Machine learning is based on problems with pictures. But, a 3D array of pixels representing an entire volume is more common than when directly recording Image Dataset.
Point clouds are the simplest and most cost-effective way to obtain 3D spatial information. Surprisingly though, very little research has been done on machine learning for points clouds. This is because most people are not aware of it.
Image annotation is the art of annotating digital pictures and videos. It involves identifying, getting characterizing, and then interpreting them. It is essential for developing computer vision and image identification systems.
Computervision has been used frequently in AI applications including driverless cars. Image annotation is vital in the development and implementation of AI/ML in a variety fields.
Why Image Annotation in Deep Learning Is Crucial
Image Annotation in Deep Learning is essential for spotting such items in a range of contexts. Image annotation in deep learning has taken on an even more significant role in object detection in modern times.
1.The object for Interest Detection
Image annotation in machinelearning is essential because it makes images visible to machines. Image annotation can be used to collect large amounts of machine AI Training Dataset for robotics, cars, and drones. The boundingbox, which is one of the most common image annotation techniques, allows you to detect different objects.
2.Various Objects' Classification
An image annotation is used to identify items that are found in the environment and then detects them. There might be many different kinds of objects in an object, which makes it difficult to identify them by a machine unless the image is marked with a special image annotation approach. Image annotation in deeplearning can categorize such objects and make it easier on robots to find and classify items from different species.
3.Identifying various Objects
In today's digital world, image annotation must make items easy to recognize using computer vision. There are many kinds, so it is crucial to recognize them in order for machines to identify them. linguistic segmentation can be used to categorize items into a single type and make it easier for machines that distinguish between different types.
Use Cases of Image Notation
The use of digital photographs, videos, and deep-learning models allows computers learn to interpret and comprehend the visual environment in the exact same way as humans.
This is where photo annotation in machinelearning can be useful. These annotations can have an impact on how accurate a computer vision (CV), model is. They can be used for more than just classifying distinct objects in a picture and recognizing different classes.
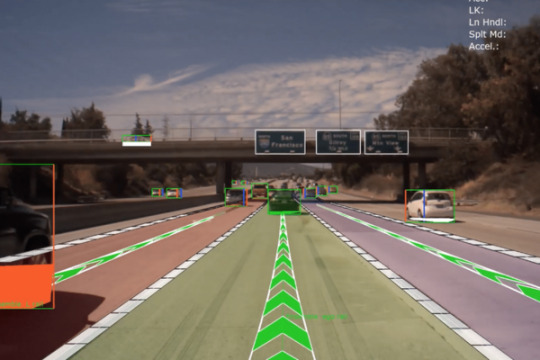
1. Autonomous Driving
Your algorithm will need to be able recognise road signs, bike lanes or traffic lights. Here are some other picture annotation methods to help autonomous vehicles.
Advanced driver-assistance technology uses in-cabin behaviors monitoring (ADAS).
Navigation with steering response
Road object and dimension detection
Observation on movement
LiDAR for Sensing
2. Agriculture
AI-enabled technologies are expanding across all industries. Context-driven data labeling can be used by farmers to prevent injuries to their crops. Image annotation simplifies agriculture's following tasks:
Management of livestock
Crop health surveillance
Detection, measurement and analysis of plant fructification
Detection unwanted crops
3. Security and surveillance
Machine learning has been driven in part by the need for security cameras. Businesses are more likely and better equipped to secure critical data and company processes. It is worthwhile to automate inventory management, surveillance and image processing even if it is labor-intensive.
Deep learning image annotation is becoming a critical component of agile cybersecurity. It can be used to aid in crowd detection and night vision even in darkness, thermal vision, traffic movement, face identification for theft detection and pedestrian tracking among other activities.
ML developers train high-tech Video Dataset equipment datasets based on annotated photos. This allows for round-the-clock security surveillance to create a safer environment.
Machine Learning and Point Clouds
Machine learning on point clouds can be difficult because of the issues with segmentation, classification and segmentation.
A classification assigns a single label to the entire point cloud. It is possible to have two labels, such as "Is this data about a cat?" or "Is it about a dog?" Multiple labels are possible (e.g. data about a vehicle. plane. boat. or bike).
Segmentation may be used if we wish to separate the handlebars, wheel, and seat from an image of a bike.
Segmentation can be used to create complex point cloud that represent a complete environment and not just one item. Segmentation allows us to create a point cloud of traffic crossings.
What is 3dpoint cloud segmentation and related problems?
3D-point cloud segmentation. This is a method that divides 3D point clouds in to homogenous regions. The same attributes will apply to points in the same location. 3D Segmentation is difficult because of the large redundancy, inequal sample density, and lack organization in point cloud datasets.
Segmenting 3D cloud points into foreground/background is a critical step in the processing. 3D data allows for precise determination of the form, size, or other features of objects. Segmenting objects in 3D Point Clouds, however, can be difficult.
Point cloud data can be noisy, scattered and unorganized. In addition to this, the point sample density is not uniform and the surface shape might be random because of the lack in statistical distribution patterns. Due to limitations in 3D sensing, the backdrop may become intertwined with the foreground.
It can be difficult to create deep learning models that are computationally efficient while still allowing for segmentation. Segmentation is useful for studying a scene using a variety op applications like object detection and recognition as well as classification and featur extracting.
0 notes
Text
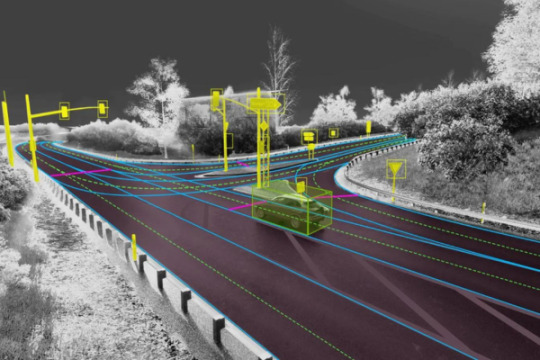
Tree Classification from LiDAR Point Cloud Data
LiDAR systems emit laser pulses toward the ground, which bounce back after hitting objects. The time taken for the pulses to return is used to calculate the distance, creating a detailed 3D representation of the surveyed area known as a point cloud. Each point in the cloud has coordinates (x, y, z) and additional attributes like intensity. This data can capture the fine details of tree canopies, trunks, and even understory vegetation, making it an excellent resource for forest and road tree classification.
0 notes
Text
If you did not already know
BentoML BentoML is a python library for packaging and deploying machine learning models. It provides high-level APIs for defining an ML service and packaging its artifacts, source code, dependencies, and configurations into a production-system-friendly format that is ready for deployment. … RetinaNet RetinaNet, an one-stage detector, by using focal loss, lower loss is contributed by ‘easy’ negative samples so that the loss is focusing on ‘hard’ samples, which improves the prediction accuracy. With ResNet+FPN as backbone for feature extraction, plus two task-specific subnetworks for classification and bounding box regression, forming the RetinaNet, which achieves state-of-the-art performance, outperforms Faster R-CNN, the well-known two-stage detectors. … Supervised Fuzzy Partitioning (SFP) Centroid-based methods including k-means and fuzzy c-means (FCM) are known as effective and easy-to-implement approaches to clustering purposes in many areas of application. However, these algorithms cannot be directly applied to supervised tasks. We propose a generative model extending centroid-based clustering approaches to be applicable to classification and regression problems. Given an arbitrary loss function, our approach, termed supervised fuzzy partitioning (SFP), incorporates labels information into its objective function through a surrogate term penalizing the risk. We also fuzzify the partition and assign weights to features alongside entropy-based regularization terms, enabling the method to capture more complex data structure, to identify significant features, and to yield better performance facing high-dimensional data. An iterative algorithm based on block coordinate descent (BCD) scheme was formulated to efficiently find a local optimizer. The results show that the SFP performance in classification and supervised dimensionality reduction on synthetic and real-world datasets is competitive with state-of-the-art algorithms such as random forest and SVM. Our method has a major advantage over such methods in that it not only leads to a flexible model but also uses the loss function in training phase without compromising computational efficiency. … Submanifold Sparse Convolutional Network Convolutional network are the de-facto standard for analysing spatio-temporal data such as images, videos, 3D shapes, etc. Whilst some of this data is naturally dense (for instance, photos), many other data sources are inherently sparse. Examples include pen-strokes forming on a piece of paper, or (colored) 3D point clouds that were obtained using a LiDAR scanner or RGB-D camera. Standard ‘dense’ implementations of convolutional networks are very inefficient when applied on such sparse data. We introduce a sparse convolutional operation tailored to processing sparse data that differs from prior work on sparse convolutional networks in that it operates strictly on submanifolds, rather than ‘dilating’ the observation with every layer in the network. Our empirical analysis of the resulting submanifold sparse convolutional networks shows that they perform on par with state-of-the-art methods whilst requiring substantially less computation. … https://bit.ly/3fF5sTP
0 notes
Text
If you did not already know
BentoML BentoML is a python library for packaging and deploying machine learning models. It provides high-level APIs for defining an ML service and packaging its artifacts, source code, dependencies, and configurations into a production-system-friendly format that is ready for deployment. … RetinaNet RetinaNet, an one-stage detector, by using focal loss, lower loss is contributed by ‘easy’ negative samples so that the loss is focusing on ‘hard’ samples, which improves the prediction accuracy. With ResNet+FPN as backbone for feature extraction, plus two task-specific subnetworks for classification and bounding box regression, forming the RetinaNet, which achieves state-of-the-art performance, outperforms Faster R-CNN, the well-known two-stage detectors. … Supervised Fuzzy Partitioning (SFP) Centroid-based methods including k-means and fuzzy c-means (FCM) are known as effective and easy-to-implement approaches to clustering purposes in many areas of application. However, these algorithms cannot be directly applied to supervised tasks. We propose a generative model extending centroid-based clustering approaches to be applicable to classification and regression problems. Given an arbitrary loss function, our approach, termed supervised fuzzy partitioning (SFP), incorporates labels information into its objective function through a surrogate term penalizing the risk. We also fuzzify the partition and assign weights to features alongside entropy-based regularization terms, enabling the method to capture more complex data structure, to identify significant features, and to yield better performance facing high-dimensional data. An iterative algorithm based on block coordinate descent (BCD) scheme was formulated to efficiently find a local optimizer. The results show that the SFP performance in classification and supervised dimensionality reduction on synthetic and real-world datasets is competitive with state-of-the-art algorithms such as random forest and SVM. Our method has a major advantage over such methods in that it not only leads to a flexible model but also uses the loss function in training phase without compromising computational efficiency. … Submanifold Sparse Convolutional Network Convolutional network are the de-facto standard for analysing spatio-temporal data such as images, videos, 3D shapes, etc. Whilst some of this data is naturally dense (for instance, photos), many other data sources are inherently sparse. Examples include pen-strokes forming on a piece of paper, or (colored) 3D point clouds that were obtained using a LiDAR scanner or RGB-D camera. Standard ‘dense’ implementations of convolutional networks are very inefficient when applied on such sparse data. We introduce a sparse convolutional operation tailored to processing sparse data that differs from prior work on sparse convolutional networks in that it operates strictly on submanifolds, rather than ‘dilating’ the observation with every layer in the network. Our empirical analysis of the resulting submanifold sparse convolutional networks shows that they perform on par with state-of-the-art methods whilst requiring substantially less computation. … https://bit.ly/2ZhPFWf
0 notes
Text
Best techniques of Point cloud to CAD and Scan to BIM
Introduction:
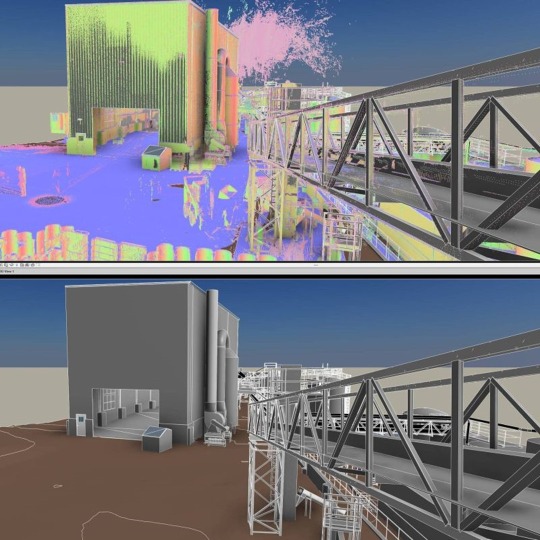
In the realm of architecture and construction, Point Cloud to CAD and Scan to BIM represent innovative methodologies that bridge the gap between traditional design practices and cutting-edge technology. Point Cloud to CAD involves the meticulous conversion of three-dimensional point cloud data, acquired through advanced technologies like laser scanning or LiDAR, into digital CAD environments, offering designers unprecedented accuracy in recreating existing structures. Scan to BIM takes this process a step further, transforming point cloud data into intelligent and parametric 3D models enriched with information about the physical and functional attributes of building elements. Together, these methodologies revolutionize design workflows by providing a more precise representation of as-built conditions, minimizing errors, and fostering enhanced collaboration and data-driven decision-making throughout the lifecycle of construction projects.

What is Point cloud to CAD?
Point Cloud to CAD is a transformative process in the field of design and engineering, seamlessly integrating the physical world with digital precision. This methodology involves the conversion of three-dimensional point cloud data, typically captured through advanced surveying technologies like laser scanning or LiDAR (Light Detection and Ranging), into a digital CAD environment. The point cloud, which consists of millions of individual data points representing surfaces and objects within a physical space, serves as a highly detailed and accurate reference. CAD software then processes and interprets this raw point cloud data, allowing designers, architects, and engineers to create precise digital representations of existing structures or environments. This process not only facilitates the preservation of accurate as-built conditions but also empowers professionals to streamline design workflows, reduce errors, and enhance overall efficiency in the creation of digital models for architectural, engineering, and construction purposes. Point Cloud to CAD has become an indispensable tool, offering unparalleled accuracy and a solid foundation for informed decision-making in diverse industries.
Techniques of point cloud to CAD:
Data Acquisition and Processing
Registration and Alignment
Feature Extraction
Meshing and Surface Reconstruction
Modeling Techniques
Quality Control and Validation
Integration with CAD Software
Collaboration and Documentation
Scan to BIM:
Scan to BIM, an innovative process at the intersection of advanced surveying technologies and Building Information Modeling (BIM), transforms point cloud data obtained through 3D laser scanning or LiDAR into intelligent and parametric 3D models. Beginning with meticulous data alignment and registration to ensure precision, Scan to BIM employs classification and object recognition algorithms to automatically identify and label structural elements within the point cloud. Parametric modeling adds a dynamic dimension, allowing for the creation of intelligent models that adapt to design changes. The management of the level of detail (LOD), interoperability with various software applications, clash detection, and resolution contribute to a streamlined construction process. Additionally, the integration of asset information, thorough documentation, and regular model updates make Scan to BIM a powerful tool not only for design and construction but also for ongoing facility management. Overall, Scan to BIM enhances collaboration, reduces errors, and provides a comprehensive digital representation of the physical environment throughout the project lifecycle.
Techniques of Scan to BIM:
The Scan to BIM process employs a series of techniques to seamlessly transform point cloud data into an intelligent Building Information Model (BIM). Beginning with the meticulous alignment and registration of multiple scans, the data undergoes cleanup and filtering to eliminate noise and enhance accuracy. Advanced algorithms for classification and object recognition automatically identify and label architectural and structural elements within the point cloud, streamlining the modeling workflow. Parametric modeling introduces intelligence to the BIM model, allowing for dynamic properties and adaptability to design changes. Level of Detail (LOD) management ensures that the model provides the necessary information for each project phase. Interoperability with BIM software enhances collaboration, while clash detection and resolution identify and address potential conflicts early in the design process. The integration of asset information, thorough documentation, and regular model updates contribute to a comprehensive BIM model that not only represents the physical structure but also serves as a valuable tool for construction and facility management.
How they work together point cloud to CAD and Scan to BIM?
The Scan to BIM process employs a series of techniques to seamlessly transform point cloud data into an intelligent Building Information Model (BIM). Beginning with the meticulous alignment and registration of multiple scans, the data undergoes cleanup and filtering to eliminate noise and enhance accuracy. Advanced algorithms for classification and object recognition automatically identify and label architectural and structural elements within the point cloud, streamlining the modeling workflow. Parametric modeling introduces intelligence to the BIM model, allowing for dynamic properties and adaptability to design changes. Level of Detail (LOD) management ensures that the model provides the necessary information for each project phase. Interoperability with BIM software enhances collaboration, while clash detection and resolution identify and address potential conflicts early in the design process. The integration of asset information, thorough documentation, and regular model updates contribute to a comprehensive BIM model that not only represents the physical structure but also serves as a valuable tool for construction and facility management.
Conclusion:
Point Cloud to CAD and Scan to BIM work synergistically to facilitate a comprehensive and accurate digital representation of physical structures in the realms of architecture and construction. Point Cloud to CAD serves as the initial bridge between the real world and the digital environment, converting laser-scanned or LiDAR-derived point cloud data into a usable CAD format. This technique ensures precise geometric representation, laying the foundation for subsequent design modifications. Scan to BIM takes this a step further by infusing intelligence into the CAD models. RVTCAD offering Point Cloud to CAD and Scan to BIM services utilize advanced laser scanning technology. They capture precise three-dimensional point cloud data of physical structures, then employ sophisticated software for data processing, object recognition, and parametric modeling. This process enhances design accuracy, collaboration, and decision-making throughout construction projects, ensuring a seamless transition from the physical to the digital realm.
#point cloud to cad#scan to bim#point cloud to bim#bim services#3d laser scanning#as-built drawing#bim laser scanning#scan to revit
0 notes
Text
What Does The Future Hold For Shipping?
Remi Eriksen, Group President, and CEO DNV GL discussed some of the upcoming developments in the maritime world in his speech at the Danish Maritime Technology Conference. Read his lightly edited version of these remarks:
Digitalization and de-carbonization are watchwords for the coming decade, and I will try to explain how the maritime industry can navigate these developments to its best advantage. I will use three examples to illustrate how shipping can advance – to become safer, more efficient and at the same time reduce its environmental footprint.
The main question for all of us is: What does the future hold for shipping?
Image Credits: dnvgl.com
Obviously, the future is notoriously hard to predict and a straight answer is far from easy to give.
What I do know is that shipping will continue to play an important part of the world economy for decades to come. But the industry itself, the vessels, the infrastructure, and the systems that connect them could change substantially. We can of course not ignore the current market situation and the structural effect this might have. But, today is not an arena for fear and pessimism. This is an arena for curiosity, innovation and opportunity.
LNG as a marine fuel
Today shipping plays an integral part in the global economy and moves more than 80 percent of world trade by volume. Not only does shipping move the majority share of world trade, but it also does so while emitting the least amount of greenhouse gasses per transported unit.
In the recent COP21 agreement, shipping was in fact left out. Approximately 2.5 percent of global greenhouse gas emissions can be accounted for shipping, and the industry will not be left alone. It will have to do its bit. A key question is, therefore: How can shipping reduce its environmental footprint, improve cost-effectiveness while at the same time remain the preferred mode of transportation of goods?
One answer is alternative fuels. Depending on fuel type, greenhouse gas emissions, NOX, SOX, and local particle emissions can be significantly reduced – if we want. The technologies are there. Today the leading alternative fuel for ships is LNG. LNG exists in abundance and is becoming increasingly available as infrastructure continues to be built. Right now – ferries and offshore vessels make up the majority of the LNG fuelled ships in operation, but container vessels and oil and chemical tankers are catching up.
Image Credits: dnvgl.com
Let’s take a closer look at LNG fueled container vessels. Together with industry partners, we have investigated the possibility of using a combined gas and steam turbine system (COGAS) to power an ultra-large container vessel.
The project called PERFECt – Piston Engine Room Free Efficient Containership – has developed an LNG-fuelled concept vessel that is electrically driven. PERFECt has a propulsion concept that has the potential to offer a more efficient, more flexible and greener box ship than current 20,000 TEU diesel-engine-driven container vessels.
This new design combines the exceptional volumetric efficiency of membrane containment technology with flexible electric propulsion to save cargo space and improve fuel efficiency compared to a conventional design. Two 11,000 m³ LNG fuel tanks are located below the deckhouse, giving the vessel enough fuel capacity for an Asia/Europe round trip. With the gas and steam turbines integrated at deck level within the same deck house as the tanks, space normally occupied by the conventional engine room can be used to increase cargo capacity significantly. Separating electric power generation from electric propulsion allows the electric power plant to be moved away from the main propulsion system, giving a great deal of flexibility. In fact, an engine room is not needed anymore. The three electric main motors, which are arranged on one common shaft, can be run fully independently of each other providing increased reliability and safety.
The first phase of the project performed by GTT, CMA Ships and DNV GL showed that the project is technically and economically viable. We are now in the second phase of the project and we have been joined by ABB, the Caterpillar company Solar Turbines, and OMT. We will look at optimizing the COGAS system, using the cooling capacity of the LNG, and further optimization of the hull lines to attain greater efficiency and increased cargo capacity.
3D printing
The next potential game-changer in shipping is additive manufacturing or 3D printing. Not only can additive manufacturing result in new designs for more efficient machinery components, it could also allow spare parts to be produced locally in various ports around the world. This would improve responsiveness to market demands, shorten the time for repairs and contribute to more efficient ship operations.
The technology is already being used for rapid prototyping, but it is now gradually being integrated into existing manufacturing infrastructure, for example in the automotive and aircraft manufacturing industries. It has fewer design restrictions compared to conventional manufacturing processes, it offers possibilities for novel designs, including lightweight products, and has the potential to shorten manufacturing time significantly.
Image Credits: dnvgl.com
The US Navy has started testing the technology onboard ships, to evaluate the potential of producing spare parts. However, this requires trained personnel on board, and the printer will be subject to the motions of the vessel, potentially affecting product quality.
So, there are some issues that need to be thought through. Qualification and certification may present significant challenges because of the potential for variability in specified properties. The traditional qualification methods of repeated testing of an end product produced from a centralized facility will not be sufficient. The distributed nature of additive manufacturing means that the product characteristics determined for one location may be entirely different from another location – owing to software and hardware differences, or other factors.
An additional or ‘second-order’ downside of additive manufacturing for shipping is that the distributed production of manufactured goods may reduce the overall demand for shipping of goods.
Digitalization and autonomous shipping
The shipping industry will have to continue innovating to keep up with the increasing expectations from end-users, charterers, regulators and society at large. This is not just about the technology itself, but also about how successful we are in scaling it to the point where it delivers real financial, environmental and societal benefits.
On that note – we should all keep an eye on all the possibilities that digitalization of shipping holds. Ships are becoming sophisticated sensor hubs and data generators, and advances in satellite communications and antenna technology are improving ship connectivity. This allows for a massive increase in the volumes of data transferred between ship and shore – at ever-lower cost.
Digitalization of information flows will spur the automation of existing processes and functions and positively impact safety and environmental performance. The fleet of the future will continually communicate with its managers and perhaps even with a “traffic control” system that is monitoring vessel positions, manoeuvres and speeds.
Image Credits: dnvgl.com
Fleet managers will be able to analyze this data, enabling them to advise the captain and crew on navigation, weather patterns, fuel consumption, and port arrival. This will help to reduce the risks of human error leading to accidents, increase cost efficiency, and help to improve environmental performance. Some of these data will also be shared. Ports will use the data to help them plan and optimize loading and unloading. Classification societies will analyze the data to check on the status of machinery and hull, letting the owners and operators know when a survey is required based on the condition of the systems, helping them to reduce downtime and avoid unnecessary maintenance.
Onshore, new cloud technologies, such as big data platforms and digital twin technologies will have a dramatic effect on how the industry manages information, and how vessels and their components are designed, built, and operated – all of which will see new digital business models emerging.
A potential game changer that may spring out of the progress within information and communication technology is the advent of unmanned vessels. Unmanned vessels can either be remotely operated from shore, on autopilot or be completely autonomous. Many steps will be needed before fully unmanned ships can become a reality. However; some sort of autonomy is also relevant to manned ships, and it would greatly increase safety through smart decision support.
In order to increase this autonomy, situational awareness needs to be improved dramatically. When it comes to autonomous equipment, it’s predicted that equipment like Electronic Chart Display and Information System (ECDIS), GPS, RADARS, CAMERAS and LIDARS (light detection and ranging) will be utilized to create situational awareness around the vessel. These are all systems and sensors which are available on the market today.
We have been researching topics around autonomous and remotely operated vessels for several years now in close cooperation with academia and industry partners. Our goal is to develop classification requirements and assurance principles that will allow the safe introduction of this technology in the maritime industry.
One example is the Advanced Autonomous Waterborne Application Initiative – better known as AAWA. Our focus in this project is to develop class requirements and principles for assurance of safety and performance. A general principle for new technology solutions to be introduced, is that it must be “as safe as, or safer than” existing solutions. At DNV GL we are in the process of forming the framework that will demonstrate this for various degrees of autonomy. Key in this process will be to undertake comprehensive simulations, HIL testing, and physical trials.
Closing
The key drivers for the coming decade are decarbonisation and digitalisation and offer opportunities for the maritime industry to become safer, more efficient while at the same time reducing its environmental footprint. At DNV GL we are excited to be a part of this transformation. We will continue to work with stakeholders across the maritime world to realize the potential of our industry – so that the outlook for shipping tomorrow will be brighter than today.
Technology Outlook 2025
Click here to read further interesting articles on future technologies
Reference: dnvgl.com
Report an Error
from Storage Containers https://www.marineinsight.com/shipping-news/what-does-the-future-hold-for-shipping/ via http://www.rssmix.com/
0 notes
Text
Helping autonomous vehicles see around corners
To improve the safety of autonomous systems, MIT engineers have developed a system that can sense tiny changes in shadows on the ground to determine if there’s a moving object coming around the corner.
Autonomous cars could one day use the system to quickly avoid a potential collision with another car or pedestrian emerging from around a building’s corner or from in between parked cars. In the future, robots that may navigate hospital hallways to make medication or supply deliveries could use the system to avoid hitting people.
In a paper being presented at next week’s International Conference on Intelligent Robots and Systems (IROS), the researchers describe successful experiments with an autonomous car driving around a parking garage and an autonomous wheelchair navigating hallways. When sensing and stopping for an approaching vehicle, the car-based system beats traditional LiDAR — which can only detect visible objects — by more than half a second.
That may not seem like much, but fractions of a second matter when it comes to fast-moving autonomous vehicles, the researchers say.
“For applications where robots are moving around environments with other moving objects or people, our method can give the robot an early warning that somebody is coming around the corner, so the vehicle can slow down, adapt its path, and prepare in advance to avoid a collision,” adds co-author Daniela Rus, director of the Computer Science and Artificial Intelligence Laboratory (CSAIL) and the Andrew and Erna Viterbi Professor of Electrical Engineering and Computer Science. “The big dream is to provide ‘X-ray vision’ of sorts to vehicles moving fast on the streets.”
Currently, the system has only been tested in indoor settings. Robotic speeds are much lower indoors, and lighting conditions are more consistent, making it easier for the system to sense and analyze shadows.
Joining Rus on the paper are: first author Felix Naser SM ’19, a former CSAIL researcher; Alexander Amini, a CSAIL graduate student; Igor Gilitschenski, a CSAIL postdoc; recent graduate Christina Liao ’19; Guy Rosman of the Toyota Research Institute; and Sertac Karaman, an associate professor of aeronautics and astronautics at MIT.
Extending ShadowCam
For their work, the researchers built on their system, called “ShadowCam,” that uses computer-vision techniques to detect and classify changes to shadows on the ground. MIT professors William Freeman and Antonio Torralba, who are not co-authors on the IROS paper, collaborated on the earlier versions of the system, which were presented at conferences in 2017 and 2018.
For input, ShadowCam uses sequences of video frames from a camera targeting a specific area, such as the floor in front of a corner. It detects changes in light intensity over time, from image to image, that may indicate something moving away or coming closer. Some of those changes may be difficult to detect or invisible to the naked eye, and can be determined by various properties of the object and environment. ShadowCam computes that information and classifies each image as containing a stationary object or a dynamic, moving one. If it gets to a dynamic image, it reacts accordingly.
Adapting ShadowCam for autonomous vehicles required a few advances. The early version, for instance, relied on lining an area with augmented reality labels called “AprilTags,” which resemble simplified QR codes. Robots scan AprilTags to detect and compute their precise 3D position and orientation relative to the tag. ShadowCam used the tags as features of the environment to zero in on specific patches of pixels that may contain shadows. But modifying real-world environments with AprilTags is not practical.
The researchers developed a novel process that combines image registration and a new visual-odometry technique. Often used in computer vision, image registration essentially overlays multiple images to reveal variations in the images. Medical image registration, for instance, overlaps medical scans to compare and analyze anatomical differences.
Visual odometry, used for Mars Rovers, estimates the motion of a camera in real-time by analyzing pose and geometry in sequences of images. The researchers specifically employ “Direct Sparse Odometry” (DSO), which can compute feature points in environments similar to those captured by AprilTags. Essentially, DSO plots features of an environment on a 3D point cloud, and then a computer-vision pipeline selects only the features located in a region of interest, such as the floor near a corner. (Regions of interest were annotated manually beforehand.)
As ShadowCam takes input image sequences of a region of interest, it uses the DSO-image-registration method to overlay all the images from same viewpoint of the robot. Even as a robot is moving, it’s able to zero in on the exact same patch of pixels where a shadow is located to help it detect any subtle deviations between images.
Next is signal amplification, a technique introduced in the first paper. Pixels that may contain shadows get a boost in color that reduces the signal-to-noise ratio. This makes extremely weak signals from shadow changes far more detectable. If the boosted signal reaches a certain threshold — based partly on how much it deviates from other nearby shadows — ShadowCam classifies the image as “dynamic.” Depending on the strength of that signal, the system may tell the robot to slow down or stop.
“By detecting that signal, you can then be careful. It may be a shadow of some person running from behind the corner or a parked car, so the autonomous car can slow down or stop completely,” Naser says.
Tag-free testing
In one test, the researchers evaluated the system’s performance in classifying moving or stationary objects using AprilTags and the new DSO-based method. An autonomous wheelchair steered toward various hallway corners while humans turned the corner into the wheelchair’s path. Both methods achieved the same 70-percent classification accuracy, indicating AprilTags are no longer needed.
In a separate test, the researchers implemented ShadowCam in an autonomous car in a parking garage, where the headlights were turned off, mimicking nighttime driving conditions. They compared car-detection times versus LiDAR. In an example scenario, ShadowCam detected the car turning around pillars about 0.72 seconds faster than LiDAR. Moreover, because the researchers had tuned ShadowCam specifically to the garage’s lighting conditions, the system achieved a classification accuracy of around 86 percent.
Next, the researchers are developing the system further to work in different indoor and outdoor lighting conditions. In the future, there could also be ways to speed up the system’s shadow detection and automate the process of annotating targeted areas for shadow sensing.
This work was funded by the Toyota Research Institute.
Helping autonomous vehicles see around corners syndicated from https://osmowaterfilters.blogspot.com/
0 notes
Text
RoboSense Announces partnership with ControlWorks to provide Smart LiDAR Sensor System to Korean Automotive industry
SHENZHEN, China & SEOUL, South Korea -- RoboSense, a leading global supplier of LiDAR perception systems for autonomous driving, and ControlWorks, a leading provider of automotive electronics systems in Korea, announced today a partnership to provide RoboSense's Smart LiDAR Sensor Systems to Korean OEMs, Tier 1 suppliers, etc. ControlWorks will provide localized sales channels, product services and technical support for the Korean market. RoboSense's autonomous perception systems consist of advanced LiDAR hardware and AI point cloud perception algorithms can output in real-time environment information from the 3D point cloud, including high-precision localization, obstacles detection, classification, tracking, etc. Read More from Financial Post https://ift.tt/2YFkXTq via IFTTT Blogger Mortgage Tumblr Mortgage Evernote Mortgage Wordpress Mortgage href="https://www.diigo.com/user/gelsi11">Diigo Mortgage
0 notes
Text
Publishing Point Cloud Scene Layers in ArcGIS Pro 2.1
Since the release of ArcGIS Pro 1.4 it has been possible to publish various 3D feature types from ArcGIS Pro to the I3S scene layer format, an OGC community standard, beginning with 3D object multipatch features to ArcGIS enterprise. Since then the list of supported feature types has grown to include 3D Objects (Multipatch), Point, Integrated Mesh (Drone2Map, Pix4D, ContextCapture, VRICON) and since ArcGIS Pro 2.0 Point clouds in LAS, ZLAS an LAZ formats.
This blog will focus on the organization, publishing and management of point cloud data to I3S point cloud scene layer format. From the initial gathering of LiDAR point cloud data to the generation of a point cloud scene layer package (SLPK) for uses locally in ArcGIS Pro or for publication to ArcGIS Online as a scene layer.
If you don’t have your own collection of LiDAR, LAS, ZLAS or LAZ files lying around on Hard Drive or set of DVDs from a long-forgotten flood mapping or elevation survey, there are plenty of free sources of LiDAR point cloud data available through government and non-profit organizations.
Open Topography based out of the San Diego Supercomputer Center at the University of California, San Diego provides access to a wide array of high resolution earth science LiDAR data.
The United States Interagency Elevation Inventory gives users access to a wide variety of LiDAR, IfSAR and Bathymetry point cloud data for many areas in the USA.
One of the free datasets available on the United States interagency elevation inventory is the 2014 USGS CMGP Lidar: Post Sandy (New York City) dataset. Which was acquired and processed to assist in the evaluation of storm damage and erosion of the local environment as part of USGS Hurricane Sandy response along the Atlantic Seaboard. I will be using this dataset to demonstrate the processing and publication of point cloud data.
Using the United States interagency elevation inventory site, you will be directed to the National Oceanic and Atmospheric Administration data access viewer.
Selecting the New York vicinity provides you with the all the information to download the LiDAR data and full metadata on its collection and processing.
Once the data has been downloaded you have a 24GB folder of 510 LAZ data files, which you can now either convert directly to a point cloud scene layer. Or if you wish to carry out further filtering, classification or analysis, you can convert to LAS and a LAS Dataset for processing and analysis in ArcGIS Pro.
To convert the LAS ZLAS or LAZ point cloud data into a PCSL SLPK, open ArcGIS Pro, navigate to the “Create Scene Layer Package” geoprocessing tab and drag the folder containing the LAZ files into the input Layer dialog. Select an output folder and define what attributes to cache. Finally select the output coordinates or use the default GCS_WGS_1984 which transforms the input projection, in this case NAD 1983 to WGS 1984.
The process is similar to output a PCSL SLPK for a LAS dataset. Except you can define the point render type (Elevation, Classification, Intensity or RGB color if present). Add the LASD dataset to the map then add it as the input layer to the “Create Scene Layer Package” tool. Once you have entered all parameters click on run and the data will be processed into a single point cloud scene layer package (SLPK).
Once the SLPK has been generated you can view it in ArcGIS Pro by adding it to a scene using the add data button on the Map tab.
To publish the scene layer package to either ArcGIS Enterprise or to ArcGIS Online use the Share Scene layer package tool.
Filling out a Summary description and tags. The tags are used to search for the item and the description identifies the package and credits for the source and providence of the data.
Once shared to ArcGIS Online the package can be published using the publishing button on the Scene Layer Package properties page. The published scene layer may then be shared within your organization or to the public.
Be sure to add detailed description and source credits to the resultant hosted scene layer.
You can now add this point cloud data to a web scene along with other 2D or 3D online services.
Or consume the scene layer services along with local data in ArcGIS Pro.
These are just some of the ways in which you can share and publish very large LiDAR Point Cloud datasets locally and to ArcGIS Online. To review other examples of point cloud scene layers check out the 3D Scene Layer Group on ArcGIS Online.
from ArcGIS Blog https://ift.tt/2uK54RM
0 notes