#lookup in datatable
Explore tagged Tumblr posts
Visit Tumblr Blog
Explore Tumblr blogs with no restrictions, modern design and the best experience.
Last Seen Tumblr Blogs


Fun Fact
There were a total of 171.5 billion posts on Tumblr in 2019.
Text
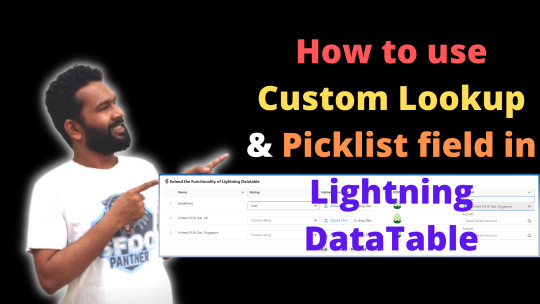
How to use the Lookup field in Lightning DataTable?
How to use the Lookup field in Lightning DataTable?
Hello #Trailblazers, We all know that Salesforce standard Lightning DataTable is the best table that we can use to display the record and it also does support the in-line editing. There are some limitations of the Standard lightning datatable like we can not have a lookup field, Picklist field or event some file upload for every column. In this blog post, I will show you how you can create a…
View On WordPress
#how to use lookup inside datatable#How to use the Lookup field in Lightning DataTable#lookup in datatable#picklist in datatable#picklist inside datatable
0 notes
Text
300+ TOP MSBI Objective Questions and Answers
MSBI Multiple Choice Questions :-
1. What is the difference between UNION and UNION ALL? A. Union selects only unique row (data) from all queries and Union all selects all rows from all queries. B. Union selects row (data) from all queries and Union all selects all rows from all queries. C. Union selects only unique row (data) from all queries and Union all selects rows from all queries. D. Union selects row (data) from all queries and Union all selects rows from all queries. Ans: a 2. Define Row Number function? A. To generate sequence number. B. To generate sequence number based on order by column. C. To generate number. D. None. Ans: b 3. What is Normalization? Types of normalization? A. Join the tables B. Move the data into tables. C. Split the table to reduce duplicates and it has five types. D. None Ans: c 4. What are different types of joins? A. Inner, outer, self join. B. Equi join and cross join. C. Right outer join. D. All above. Ans: d 5. What are the advantages of using stored procedure? A. Pre executable program. B. We can get the data. C. Security. D. It is similar to function. Ans: a 6. What is BCP? A. Bulk copy program. B. Business continuity program. C. A and B. D. None. Ans: a 7. Define Index? A. Predefined pointers to data page. B. It is primary key. C. It is foreign key. D. None. Ans: a 8. What command do we use to rename db, table, and column? A. Invoke command B. Commit C. Rename D. None. Ans: c 9. Define having clause? A. It is similar to where but must use group by clause. B. It is equal to where clause. C. None. D. It is equal to from clause. Ans: a 10. What are the basic functions system databases? A. To create functions. B. To create stored procedure. C. To maintain metadata information. D. None. Ans: c
MSBI MCQs 11. Explain ETL process? A. Extract, Translation, Loading. B. Extract, Transformation , Loading C. Both a and b. D. None. Ans: b 12. Difference between for loop and for each loop container? A. For loop based on conditions and for each loop based on objects collections. B. For loop based on objects collections and for each loop based on objects collections. C. None. D. Both a and b. Ans: a 13. What does a control flow do? A. To control workflow. B. To control events. C. To control data flows. D. To control lookup. Ans: a 14. Explain event handlers? A. To handle data validations. B. To handle errors. C. To handle events. D. None. Ans: c 15. SSIS 2008 configuration types? A. Five. B. Four. C. Three. D. One. Ans: a 16. Define Lookup transformation? A. Used as reference table. B. Used as master table. C. Used as fact table D. None. Ans: a 17. Define synchronous transformations? A. Input rows count and Output rows count are same. B. Input rows count and Output rows count are not same. C. None. D. Input rows count and Output rows count are different. Ans: a 18. How to rename file using SSIS tasks? A. Using lookup. B. Using Data flow. C. Using File system task. D. None. Ans: c 19. What does mean by data auditing? A. To maintain data load statistics in ETL process. B. To know the errors. C. To know the Primary keys. D. None. Ans: a 20. How many container tasks available in SSIS? A. One. B. Two. C. Three. D. Four. Ans: d 21. Define role play dimensions? A. One dimension used multiple times in the cube. B. One dimension used in different cubes. C. Shared across cubes. D. None. Ans: a 22. Define dimension usage in SSAS Cube? A. To maintain cube data size. B. To know the relationships between dimensions and fact. C. To build business logic. D. None. Ans: b 23. MDX stands? A. Memory, Distribution, extensions. B. Memory, dimension, expressions. C. Multi, dimension, expressions. D. None Ans: c 24. DSV stands? A. Data source View. B. It is view. C. It has relationships and metadata. D. All above. Ans: d 25. How many types of actions available in the Cube? A. One. B. Two. C. Three. D. None. Ans: c MSBI Objective Type Questions with Answers 26. What do you understand by dynamic named set (SSAS 2008)? A. To create dynamic set of members. B. To create set of members. C. None. D. Both a and b. Ans: a 27. How many types of dimension are possible in SSAS? A. Four. B. Five. C. Six. D. Seven. Ans: c 28. In which scenario, you would like to go for materializing dimension? A. To increase spee B. To decrease memory size. C. Both. D. None. Ans: a 30. What are the options to deploy SSAS cube in production? A. Using BIDS. B. Using SSMS. C. Using XMLA. D. All the above. Ans: d 31. Describe Reporting Lifecycle? A. Reports and reports models. B. Report authoring, Management, Delivery. C. Both. D. None. Ans: b 32. What can SQL Server Reporting Services do? A. To create files. B. To create tables. C. To create Reports. D. None. Ans: c 33. Define reporting processing? A. Report data processing. B. Report rendering process. C. Report delivery process. D. All the above. Ans: d 34. How many default rending options are available in SSRS2008? A. Four. B. Five. C. Two. D. One. Ans: a 35. What is the usage of Report Builder? A. To create reports. B. To create reports for users. C. Business users create reports. D. None. Ans: c 37 How many architecture components of SSRS 2008? A. Five. B. Six. C. Seven. D. None. Ans: b 38. Explain on SSRS2008 Reporting Items? A. Tablix,Chart,List B. Sub Report. C. Both A and B. D. None. Ans: c 39. What does mean by nested datasets? A. Used datasets with in dataset. B. A dataset. C. None. D. A table. Ans: a 40. How many command line utilities of SSRS2008? A. Three. B. Four. C. One. D. None. Ans: a 41. You are creating a SQL Server 2008 Integration Services (SSIS) package for Company.com. The package contains six Data Flow tasks and three Control Flow tasks. You should alter the package Which is the correct answer? A. You should increase the two Control Flow tasks and one Data Flow task to a container. Change the TransactionOption property of the container to Supported. B. You should increase the two Control Flow tasks and one Data Flow task to a container. Change the TransactionOption property of the container to Disabled. C. You should increase the two Control Flow tasks and one Data Flow task to a container. Change the TransactionOption property of the container to Required. D. You should increase the two Control Flow tasks and one Data Flow task to a container. Change the TransactionOption property of the container to RequiredNew. Ans: C 42. You are managing a SQL Server 2008 Reporting Services (SSRS) sample which does not give some same rendering extensions for Company.com. You should make sure that you could set the server in order to render to Microsoft WorWhich is the correct answer? A. You should change the AppSetttings.config file. B. You should change the Global.asax file. C. You should change the Machine.config file. D. You should change the RSReportServer.config file Ans: D 43. You are creating a SQL Server 2008 Integration Services (SSIS) package on a SQL Server 2008 database for Company.com. In order to develop a failure recovery plan that is published for a SQL Server. Which is the correct answer? A. You should back up the master database. B. You should back up the local database. C. You should back up the system database. D. You should back up the systemdb databse. Ans: A 44. You are developing a SQL Server 2008 Reporting Services (SSRS) instance of report model for Company.com.In the Report Builder tool, the users should need to create their SSRS reports. The data source they used will include a Microsoft SQL Server 2008 database. Which include 1000 tables? You should design the report model for users, and allow access to only the 20tables which they require for reporting. Which is the correct answer? A. You should develop DataSet using the Web Service to Schema(s) option. B. You should develop DataTable using the Web Service to Schema(s) option. C. You should develop a data source view and select only the required tables and views. D. You should set the data source view in the setting file. Ans: C 45. You are managing a SQL Server 2008 Analysis Services (SSAS) database for Company.com.A sales manager called Clerk is responsible for the sales of bikes in the Northeast region. You decide to give some rights to the rights to Clerk to visit the database.You won two roles below called Southern Region and Nikes. Their schemas are listed below:You have make The Visual Totals properties attribute true for roles above.You should make sure that Clerk could browser the workers in the Product dimension which link to the Nikes category in the Southern region. Which is the correct answer? A. You should increase Clerk to a Nikes role B. You should increase Clerk to the Southern Region role. C. You should increase Clerk to a new role which owns components below: D. .} as the permitted configuration.{...} as the permitted E. You should increase Clerk to the default Region role. Ans: C 46. You are managing a SQL Server 2008 Analysis Services (SSAS) database which includes a Sale dimension that includes the Category and Subcategory properties for Company.com.There is a rigid relationship type for properties. The data source for the Sale dimension alters the relationship between the Type and Sub Type values. You should make sure that you could run an XML to operate he dimension to reflect the change normally for Analysis (XMLA). Which is the correct answer? A. You should utilize the ProcessDefault command. B. You should utilize the ProcessClear command. C. You should utilize the ProcessIndexes command. D. You should utilize the ProcessDefault and the ProcessClear commands. Ans: D 47. You are managing a SQL Server 2008 Analysis Services (SSAS) instance for Company.com. In order to execute the Usage-Based Optimization Wizard you should make query logging enable. Which is the correct answer? Which is the correct answer? A. You should make the QueryLogSampling server attribute default value. B. You should make the QueryLogSampling server attribute 5. C. You should configure the server property of DefaultFolders. D. You should configure the QueryLogConnectionString server attribute and set a valid connection string. Ans: D 48. You are managing a SQL Server 2008 Analysis Services (SSAS) database for Company.com.You get the Duplicate Key error when you operate the Analysis Services database.You should alter the ErrorConfiguration attribute in order to make processing run normally. Which is the correct answer? A. You should alter the Dynamic Management View (DMV) B. You should alter the Local Group C. You should alter the dimension D. You should alter the Transactions Log Ans: C 49. You are managing a SQL Server 2008 Analysis Services (SSAS) database for Company.com. In order to update data in a partition each hour you should run the incremental processing method. In order to solve the problem, which is the correct answer? A. You should utilize ProcessAdd for Analysis (XMLA) command B. You should utilize default command for Analysis (XMLA) C. You should utilize ProcessNone for Analysis (XMLA) command D. You should utilize ProcessView for Analysis (XMLA) command Ans: A 50. You are developing a SQL Server 2008 Reporting Services (SSRS) report for Company.com.Assembly should be created in order to run real-time lookup and currency conversion. The assembly has a static class named daily which lives in the namespace HomeCalc.there is a method called DMO which need two arguments, Cuurnt and HomeCalcWhen the report is operating, you should reference the ToEUR method in an expression to convert USD to USO. Which is the correct answer? A. You should use the expression of =Code. HomeCalDaily. USO (Fields! Cuurnt.Value,” DMO”) B. You should use the expression of =Code! HomeCalDaily. USO (Fields! Cuurnt.Value,”DMO”) C. You should use the expression of = HomeCalDaily.USO (Fields! Cuurnt.Value,”USD”) D. You should use the expression of = HomeCalc! Daily.USO (Fields! Cuurnt.Value,”USD”) Ans: C MSBI Questions and Answers pdf Download Read the full article
0 notes
Text
A So-So Second Date with Julia
#ICYDK: A So-So Second Date with Julia A few months ago, I wrote a quite positive blog on the Julia analytics language, reveling in its MIT pedigree, its comprehensible structure, and its interoperability with data science stalwarts R and Python. I demonstrated some of Julia's capabilities with a skinny data set of daily stock index values, and I showed it collaborating with R's powerful ggplot graphics subsystem. This time around, I decided to test Julia against a much meatier data set -- one that I've already examined extensively with both R and Python. I find time and again that it's critical to push analytics platforms with size to uncover their strengths and weaknesses. The data set I use here consists of Chicago crime records from 2001-2018 in a csv file posted for download each morning. At present, it consists of over 6.7M records and 20+ attributes on the what, where, and when of all crimes logged by the Chicago Police Department. My tests revolve on loading the "master" data, then enhancing with lookup tables describing Chicago communities and the classifications of crimes. From there, I tally multi-attribute frequencies on type, location, and time -- ultimately graphing the results. R with it's data.table/tidyverse data management/analysis ecosystem and Python with Pandas have met the challenges with aplomb. Both their notebooks have been easy to construct and plenty fast. How would Julia, a much less mature competitor, stack up? As an adolescent, the Julia language is a bit of a moving target, making the development process somewhat slower than with R and Python. I was able to do what I needed to, though, adopting a similar development strategy of driving from dataframe/datatable packages. stackoverflow is my best development friend, if, not surprisingly, a bit more helpful with R and Python than Julia. So what did I find? With the exception of several annoyances such as the absence of a vectorized "in" operator, I was pretty much able to mimic in Julia the programming style I used with Python/Pandas. In fact, Julia was somewhat more facile than Pandas with "by group" processing, as its functions acknowledge missing values, unlike Pandas, which ignores them. What disappointed me, though, was the relative performance of Julia vs R/Python. I think I'm being charitable noting that the tests I ran in both R and Python run at least twice as fast as comparables in Julia. And, of course, the expectation is that Julia should be faster. So I guess I'm a bit despondent after my second date with Julia -- but not, like some, ready to give up just yet. The code that follows first downloads the csv file from the Chicago Data Portal. It then reads the data into a Julia dataframe, joining that in turn with several lookup tables -- much like one would do with an RDBMS. I then run a number of frequencies queries involving type, time, and place. Finally, and perhaps most gratifyingly, I use R's ggplot exposed by the RCall package to graph frequency results. The code cells follow. The software used is Julia 1.0.0, Python 3.6.5, Microsoft Open R 3.4.4, and JupyterLab 0.32.1. Read the entire blog here. https://goo.gl/YJdcB3
0 notes
Text
[Udemy] Learn Excel 2016 Intermediate Level - Beyond the Basics
If you already know the basics of Excel, this intermediate level course will help you become an Excel power user What Will I Learn? Review Excel terminology Learn cool tips and tricks in the Ribbon Discover common Excel hotkeys How to use VLOOKUP and HLOOKUP Learn how to use popular functions Discover how to use named ranges Discover the power of Dynamic Formulas and how to use them Get advanced level tips for creating awesome charts and graphs How to work with and analyze your data using data slicers, PivotTables, Power Query and PivotCharts Practice what you learned with included exercise files Requirements Microsoft Excel 2016 desktop version for Windows installed and ready to use on your computer. Description Master important topics such as Charts and Graphs, Working With Data, Dynamic Formula, and Named Ranges. A full 4.5 hours of expert instruction 39 individual video tutorials More advanced mastery of Excel Perfect for advancing at work Easy to follow instructions Step by step tutorials are easy to understand More advanced use of working with data Mastery of charts and graphs Covers Dynamic Formula and Named Ranges Helps you become an Excel power user Practice what you learned with included exercise files Learn Excel 2016 Intermediate takes you well beyond the beginner stage to become an Excel power user. Now you can possess the more advanced skills that will set you apart from others. The course consists of 39 individual video tutorials that last a full 4.5 hours. Work at your own pace and take as much time as you need. This lets you fit the course work with your work schedule and life. Or speed through the course to give yourself crash mastery. This Intermediate level course gives you the additional advanced skills you need to become more valuable at work. Also perform more impressive duties in your own business, for volunteer work, or to augment fun hobbies. Excel is part of the MS Office package that is used in business everywhere in the world. Now you have access to a step-by-step course that empowers you to become an impressive Excel power user. Instruction is professionally produced for clarity and ease of learning. Each process is explained in detail with lots of illustration. Step by step instruction makes functions easy to understand and remember. Contents and Overview Learn Excel 2016 Intermediate starts where the beginning Excel course concluded. This course gives you more advanced mastery of working with Excel. Rather than being limited to a few functions, this Intermediate course lets you go much deeper into the remarkable power and functionality of MS Excel. The course starts by explaining terminology, tips and tricks in the ribbon, hotkeys, and defining your Excel view. This approach to the beginning gets learners off on the right foot. You gain a better understanding of finding your way around Excel. The next few chapters present interesting video tutorials that fully explain Indexing and Lookups. The various functions are illustrated and discussed and case study lookups are explored. Additional chapters talk about intermediate creation of charts and graphs and working with data. DataTables, Data Slicers, Pivot Tables and much more. Video lengths range from around 3 minutes to 11 minutes. This lets you learn in small manageable blocks that can be studied around a busy schedule. *Updated July 2017: Close captions in English added. Who is the target audience? Those new to using Microsoft Excel 2016. Users of earlier versions of Excel looking to update their skills. Users who have a foundation of Microsoft Excel and seeking to take advance there Excel 2016 knowledge. source https://ttorial.com/learn-excel-2016-intermediate-level-beyond-basics
source https://ttorialcom.tumblr.com/post/177939382073
0 notes
Text
A So-So Second Date with Julia
#ICYMI: A So-So Second Date with Julia A few months ago, I wrote a quite positive blog on the Julia analytics language, reveling in its MIT pedigree, its comprehensible structure, and its interoperability with data science stalwarts R and Python. I demonstrated some of Julia's capabilities with a skinny data set of daily stock index values, and I showed it collaborating with R's powerful ggplot graphics subsystem. This time around, I decided to test Julia against a much meatier data set -- one that I've already examined extensively with both R and Python. I find time and again that it's critical to push analytics platforms with size to uncover their strengths and weaknesses. The data set I use here consists of Chicago crime records from 2001-2018 in a csv file posted for download each morning. At present, it consists of over 6.7M records and 20+ attributes on the what, where, and when of all crimes logged by the Chicago Police Department. My tests revolve on loading the "master" data, then enhancing with lookup tables describing Chicago communities and the classifications of crimes. From there, I tally multi-attribute frequencies on type, location, and time -- ultimately graphing the results. R with it's data.table/tidyverse data management/analysis ecosystem and Python with Pandas have met the challenges with aplomb. Both their notebooks have been easy to construct and plenty fast. How would Julia, a much less mature competitor, stack up? As an adolescent, the Julia language is a bit of a moving target, making the development process somewhat slower than with R and Python. I was able to do what I needed to, though, adopting a similar development strategy of driving from dataframe/datatable packages. stackoverflow is my best development friend, if, not surprisingly, a bit more helpful with R and Python than Julia. So what did I find? With the exception of several annoyances such as the absence of a vectorized "in" operator, I was pretty much able to mimic in Julia the programming style I used with Python/Pandas. In fact, Julia was somewhat more facile than Pandas with "by group" processing, as its functions acknowledge missing values, unlike Pandas, which ignores them. What disappointed me, though, was the relative performance of Julia vs R/Python. I think I'm being charitable noting that the tests I ran in both R and Python run at least twice as fast as comparables in Julia. And, of course, the expectation is that Julia should be faster. So I guess I'm a bit despondent after my second date with Julia -- but not, like some, ready to give up just yet. The code that follows first downloads the csv file from the Chicago Data Portal. It then reads the data into a Julia dataframe, joining that in turn with several lookup tables -- much like one would do with an RDBMS. I then run a number of frequencies queries involving type, time, and place. Finally, and perhaps most gratifyingly, I use R's ggplot exposed by the RCall package to graph frequency results. The code cells follow. The software used is Julia 1.0.0, Python 3.6.5, Microsoft Open R 3.4.4, and JupyterLab 0.32.1. Read the entire blog here. https://goo.gl/LTcs8S
0 notes
Text
A So-So Second Date with Julia
A So-So Second Date with Julia A few months ago, I wrote a quite positive blog on the Julia analytics language, reveling in its MIT pedigree, its comprehensible structure, and its interoperability with data science stalwarts R and Python. I demonstrated some of Julia's capabilities with a skinny data set of daily stock index values, and I showed it collaborating with R's powerful ggplot graphics subsystem. This time around, I decided to test Julia against a much meatier data set -- one that I've already examined extensively with both R and Python. I find time and again that it's critical to push analytics platforms with size to uncover their strengths and weaknesses. The data set I use here consists of Chicago crime records from 2001-2018 in a csv file posted for download each morning. At present, it consists of over 6.7M records and 20+ attributes on the what, where, and when of all crimes logged by the Chicago Police Department. My tests revolve on loading the "master" data, then enhancing with lookup tables describing Chicago communities and the classifications of crimes. From there, I tally multi-attribute frequencies on type, location, and time -- ultimately graphing the results. R with it's data.table/tidyverse data management/analysis ecosystem and Python with Pandas have met the challenges with aplomb. Both their notebooks have been easy to construct and plenty fast. How would Julia, a much less mature competitor, stack up? As an adolescent, the Julia language is a bit of a moving target, making the development process somewhat slower than with R and Python. I was able to do what I needed to, though, adopting a similar development strategy of driving from dataframe/datatable packages. stackoverflow is my best development friend, if, not surprisingly, a bit more helpful with R and Python than Julia. So what did I find? With the exception of several annoyances such as the absence of a vectorized "in" operator, I was pretty much able to mimic in Julia the programming style I used with Python/Pandas. In fact, Julia was somewhat more facile than Pandas with "by group" processing, as its functions acknowledge missing values, unlike Pandas, which ignores them. What disappointed me, though, was the relative performance of Julia vs R/Python. I think I'm being charitable noting that the tests I ran in both R and Python run at least twice as fast as comparables in Julia. And, of course, the expectation is that Julia should be faster. So I guess I'm a bit despondent after my second date with Julia -- but not, like some, ready to give up just yet. The code that follows first downloads the csv file from the Chicago Data Portal. It then reads the data into a Julia dataframe, joining that in turn with several lookup tables -- much like one would do with an RDBMS. I then run a number of frequencies queries involving type, time, and place. Finally, and perhaps most gratifyingly, I use R's ggplot exposed by the RCall package to graph frequency results. The code cells follow. The software used is Julia 1.0.0, Python 3.6.5, Microsoft Open R 3.4.4, and JupyterLab 0.32.1. Read the entire blog here. https://goo.gl/qxQiMA
0 notes