#s&p500Index
Text
Wall Street's Crystal Ball: Navigating Uncertainties in the Second Half of 2023

As we step into the second half of 2023, the outlook for Wall Street appears increasingly uncertain. Following a robust first half, the stock market has recently experienced some turbulence, with the S&P 500 index retracing approximately 2% from its record high.

In this article, we delve into the factors contributing to the recent volatility and explore the potential opportunities and challenges that lie ahead.
The Federal Reserve's Monetary Policy and Market Uncertainty
One prominent reason behind the market volatility is the prevailing uncertainty surrounding the Federal Reserve's monetary policy. It is widely anticipated that the Fed will raise interest rates multiple times throughout the year to address the issue of inflation. However, there is a lack of consensus among investors regarding the degree of aggressiveness the Fed will adopt, leading to market apprehension and unease.
The Ongoing Ukraine Conflict and Global Implications
Another significant factor influencing market volatility is the ongoing war in Ukraine. This conflict has disrupted global supply chains and resulted in elevated energy prices, which are imposing strain on both businesses and consumers. The uncertainties stemming from the war are further impacting investor sentiment, contributing to the prevailing market fluctuations.
Balancing Optimism with Potential Risks
Despite the recent turbulence, several analysts maintain a positive outlook on stocks over the long term. They highlight robust corporate earnings and sustained economic growth as factors driving optimism. However, they also emphasize the existence of potential risks and caution investors to be prepared for near-term volatility.
In a recent client note, Goldman Sachs analysts expressed their expectation that the S&P 500 will reach 4,400 by year-end, representing a 5% increase from its present level. Nonetheless, they acknowledge the possibility of stocks plummeting to 3,800 if the Federal Reserve enacts a more aggressive interest rate hike strategy than initially anticipated.
Navigating the Uncertainties: Opportunities and Challenges
It is evident that Wall Street's crystal ball is clouded with uncertainties, necessitating a careful evaluation of risks and rewards before making investment decisions. While volatility is likely to persist in the markets due to the aforementioned factors, there are underlying factors that could support stocks in the long term.
Recent Stock Rally and Positive Indicators
The recent rally in stocks provides some promising signs for investors. On Friday, the S&P 500 index surged by 1.6%, marking its most substantial gain in a month. Importantly, this rally was broad-based, with all 11 sectors of the S&P 500 closing the day higher. Notably, technology stocks led the gains, as evidenced by the Nasdaq Composite index rising 2.2%.
Investors found encouragement in strong corporate earnings reports and positive economic data, which helped drive the market's upward momentum. Additionally, the yield on the 10-year Treasury note decreased to 3.05%, reaching its lowest level in two weeks. Simultaneously, the dollar weakened against other major currencies, further influencing market dynamics.
Navigating Uncertain Waters
In conclusion, as we navigate the uncertainties of the second half of 2023, it is crucial to assess the potential risks and rewards associated with investing. The Federal Reserve's monetary policy decisions and the ongoing conflict in Ukraine are significant factors that contribute to market volatility. However, analysts remain cautiously optimistic, pointing to strong corporate earnings and economic growth as reasons for long-term confidence.
While the crystal ball of Wall Street may be hazy, investors can find solace in the recent stock rally and positive indicators. Careful consideration of these factors and an informed investment strategy can help navigate the ever-changing landscape of the financial markets.
Read the full article
#Businessgrowth#corporateearnings#Economicgrowth#fedinterestrates#interestrates#MarketVolatility#s&p500index#stockmarket#stockmarketvolatility#stocks#stocksrally#UK#unitedkingdom#unitedstates#USeconomy#WallStreet#wallstreetuncertainty#warinukraine
0 notes
Text
#bearmarket#dow#dowjonesstockmarket#dowjonestoday#s&p500#s&p500today#s&p500Index#stockfutures#stockmarket20222#stockmarketnews#stockmarkettoday#stocks#thebiographypen#usnews
0 notes
Text
Financiers make Warren Buffett-like moves in the middle of coronavirus crisis
not easily fixable by the government. ” data-reactid=”16″ type=”text”> not quickly fixable by the federal government ” data-reactid=”16″ type= “text “> Markets have been hammered by coronavirus outbreak fears and an oil rate war, dropping nearly20%off their February highs. The thought of a massive” stay at home” circumstance could show to be a significant financial problem not easily fixable by the federal government
persevere“” data-reactid=”17″ type=” text” > In the middle of the panic, major U.S. financial investment brokerages like Fidelity, Vanguard, and T. Rowe Rate– which have about $ 9 trillion under management combined– are attempting to preempt clients from fear selling, by telling them to” stay the course“
This guidance– to think long term and not respond to the daily gyrations of the stock exchange– is exactly what iconic investor Warren Buffett, CEO of Berkshire Hathaway, has actually said on many occasions— consisting of the 2008 financial crisis when he composed in an op-ed,” Buy American. I Am. “
In his op-ed, Buffett stated he believed in the American economy and its companies, making the case to remain in or enter into the marketplace if you want to invest for the long term, due to the fact that” equities will likely outperform cash over the next decade, probably by a significant degree.”
According to Vanguard, some financiers are doing just that.
View images
Warren Buffett, Chairman and CEO of Berkshire Hathaway, smiles as he plays bridge following the annual Berkshire Hathaway shareholders fulfilling in Omaha, Neb., May 5,2019( AP Photo/Nati Harnik)
“Throughout the last week of February and the first week of March, the majority of families trading moved cash into equities instead of into fixed earnings( bonds and cash),” Vanguard’s Amy Lash informed Yahoo Finance. “More than 7 in 10 households trading moved into equities.”
Lash added that while there has been a total increase in trading from Lead clients, only 1%are making relocations, compared to a common day’s 0.4%. Individuals with only retirement strategy accounts– as opposed to taxed brokerage ones — have actually barely touched things. Less than 0.3%of Lead’s 30 million consumers have made any trades over the past month, according to Lead.
This narrative reveals that while there may be significant selling driving the markets lower– the S&P 500 index is at last May’s levels since Monday’s close — typical retail investors are looking ahead– to when the coronavirus will be under control and the worries soothed.
For numerous typical investors, the cost is best” data-reactid=”
counterintuitive given the day’s huge selloff, with major stock indexes off by more than 7%. It was a busy Monday, with 57%more logins at Fidelity than the average Monday over the past 12 months.” data-reactid=”46″ type=”text”>)” type=” text” > For many typical investors, the cost is right
This isn’t the only Buffett-esque lesson retail financiers are heeding.
counterproductive provided the day’s big selloff, with significant stock indexes off by more than 7%. It was a hectic Monday, with 57%more logins at Fidelity than the typical Monday over the past 12 months.” data-reactid=”46″ type=” text” > Brokerage accounts at Fidelity saw an equity buy-to-sell ratio of 2.11 to 1 on Monday. That implies that for every stock sale, there were more than 2 purchases– somewhat counterintuitive given the day’s big selloff, with significant stock indexes off by more than 7%. It was a hectic Monday, with57%more logins at Fidelity than the average Monday over the past12 months.
View photos
Fidelity’s order book on Monday, March 9,2020. The marketplace went down 5 %, but people bought a lot of stocks.( Fidelity )
” Clients are using the market volatility to add equities to their portfolio,” Fidelity’s Robert Beauregard told Yahoo Finance.
Fidelity clients are doing exactly what Buffett does. When a stock he likes goes under a particular limit, ending up being cheap enough, he frequently buys more of it.
” The most typical situation is that clients already own the position,
common stocks people are lapping up? Apple (AAPL), Microsoft (MSFT), Inovio Pharmaceuticals (INO), Tesla (TSLA), and Amazon (AMZN). (Inovio said last week it was accelerating the timeline for development of a coronavirus vaccine and expects to start human trials next month in the U.S.)” data-reactid=”74″ type=”text”>think in the company, and are adding to their existing position at a’ discount,'” Beauregard said.
common stocks individuals are lapping up? Apple( AAPL ), Microsoft( MSFT), Inovio Pharmaceuticals ( INO), Tesla ( TSLA), and Amazon ( AMZN). (Inovio stated last week it was accelerating the timeline for advancement of a coronavirus vaccine and expects to start human trials next month in the U.S.)” data-reactid=”74″ type= “text “> The most common stocks individuals are lapping up? Apple( AAPL), Microsoft( MSFT), Inovio Pharmaceuticals ( INO), Tesla( TSLA), and Amazon(AMZN&) ).( Inovio stated last week it was speeding up the timeline for development of a coronavirus vaccine and anticipates to start human trials next month in the U.S.)
SPY )saw 7 purchases to every sell, iShares Core S&P 500 ( IVV )8.8, and Lead’s S&P500( VOO) a whopping 9.” data-reactid=” 75″ type=” text” > For index funds and ETFs, SPDR S&P500( SPY
low-cost S&P 500 index fund,” he wrote in his 2016 Berkshire Hathaway annual shareholder letter.” data-reactid=”76″ type=”text”>) saw 7 purchases to every sell, iShares Core S&P500( IVV ) 8.8, and Vanguard’s S&P 500( VOO) a whopping 9.
inexpensive S&P500 index fund,” he wrote in his2016 Berkshire Hathaway yearly shareholder letter” data-reactid=”76″ type=” text” > Those three funds duplicate the S&P500 index, which itself is perhaps the best representation of the more comprehensive U.S. economy. Buffett would authorize:” My regular suggestion has been a low-cost S&P500index fund, “he composed in his2016 Berkshire Hathaway yearly shareholder letter
–
Ethan Wolff-Mann is a writer at Yahoo Financing focusing on customer concerns, personal finance, retail, airline companies, and more. Follow him on Twitter@ewolffmann ” data-reactid=”78″ type=” text” > Ethan Wolff-Mann is a writer at Yahoo Financing concentrating on customer problems, individual finance, retail, airline companies, and more. Follow him on Twitter @ewolffmann
Fidelity, Lead, T. Rowe Price to financiers:’ Stay the course’
Why the US economy is especially sensitive to the coronavirus outbreak
The coronavirus robocall frauds are emerging
9 crucial dates when we’ll understand more about how coronavirus is effecting the economy
Coronavirus cost gouging: 3 charts reveal Amazon’s wild spikes
The ‘best-case’ coronavirus scenario: people do not all get ill at the same time
Read the latest financial and business news from Yahoo Finance” data-reactid=”87″ type=”text”>
Is the stock market overreacting to the coronavirus?
Twitter, Facebook, Instagram, Flipboard, LinkedIn, YouTube, and reddit.” data-reactid=”88″ type=”text”>
Check out the most recent monetary and company news from Yahoo Finance” data-reactid =”87″ type=”text” > Read the most recent financial and organisation news from Yahoo Financing
Follow Yahoo Finance on Twitter, Facebook, Instagram, Flipboard, LinkedIn, YouTube, and reddit
” data-reactid =” 88″ type=”text” > Follow Yahoo Financing on Twitter , Facebook , Instagram , Flipboard , LinkedIn , YouTube , and reddit
%.
from Job Search Tips https://jobsearchtips.net/financiers-make-warren-buffett-like-moves-in-the-middle-of-coronavirus-crisis/
0 notes
Text
A Sharp Reflex Rally

While it is indeed a sharp “reflex rally,” With follow through today, please remember this: “Bear Markets” are not resolved in a single Day, Week, or a Month. Most importantly, "bear markets” do not end with “consumer confidence” still very elevated.
Notice that during each of the previous two bear market cycles, confidence dropped by an average of 58 points.
This past week, we saw early indications of the unemployment that is coming to America as jobless claims surged to 10 million, and unemployment in April will surge to 15-20%.
Confidence, and ultimately consumption, Which comprises 70% of GDP, will plummet as job losses mount. It is incredibly difficult to remain optimistic when you are unemployed.
No Light At The End Of The Tunnel Yet
The markets have been clinging on to “hope” that as soon as the virus passes, there will be a sharp “V”-shaped recovery in the economy and markets. While we strongly believe this will not be the case, we do acknowledge there will likely be a short-term market surge as the economy does initially come back “online.” That surge could be very strong and will once again have the media crowing the “bear market” is over. However, for now, we are not there yet.
Most importantly, as shown below, the majority of businesses will run out of money long before SBA loans, or financial assistance can be provided. This will lead to higher, and a longer-duration of unemployment.
What the cycle tells us is that jobless claims, unemployment, and economic growth are going to worsen materially over the next couple of quarters.
The problem with the current economic backdrop, and mounting job losses, is the vast majority of American’s were woefully unprepared for any disruption to their income going into recession.
Two important points:
The economy will eventually recover, and life will return to normal.
The damage will take much longer to heal, and future growth will run at a lower long-term rate due to the escalation of debts and deficits.
For investors, this means a greater range of stock market volatility and near-zero rates of return over the next decade.
The Bear Still Rules
History tells the story covering the last 8 full fledged bear markets: The should be sold into!
In other words, if you have taken the decline thus far, When you see the rally explode up, sell it and preserve as much as you can before the next dip.
On Friday, our colleague, Jeffery Marcus of TP Analytics, penned the following:
When the 11-year bull market trend ended, other shorter trends were also violated. In late February, the S&P 500 fell below its 14-month uptrend line, and in early March the 13-month uptrend line was violated. Those breaks set in place the steep declines seen in the 2nd and 3rd weeks of March.
While it may seem like an epic battle is going on around S&P 500 2500, the real problem is the downtrend forming from the 2/19 high.
TPA still continues to see real long term support in the 3% range between 2110 and 2180. A less likely move below that support, would leave long term support levels of the lows of 2014 and 2015.
S&P 500 – Long Term

His analysis agrees with our own:
“While the technical picture of the market also suggests the recent “bear market” rally will likely fade sooner than later. Such an advance will ‘lure’ investors back into the market, thinking the ‘bear market’ is over. Importantly, despite the sizable rally, participation has remained extraordinarily weak. If the market was seeing strong buying, as suggested by the media, then we should see sizable upticks in the percent measures of advancing issues, issues at new highs, and a rising number of stocks above their 200-dma.”
On a daily basis, these measures all have room to improve in the short-term. However, the market has now confirmed longer-term technical signals suggesting the “bear market” has only just started.
There are reasons to be optimistic about the markets in the very short-term. We will get through this crisis. People will return to work. The economy will start moving forward again.
However, it won’t immediately go right back to where we were previously. We are continuing to extend the amount of time the economy will be “shut down,” which exacerbates the decline in the employment, and personal consumption data. The feedback loop from that data into corporate profits, and earnings, is going to make valuations more problematic even with low interest rates currently.
This is NOT the time to try and “speculate” on a bottom of the market. You might get lucky, but there is very high risk you could wind up losing even more capital.
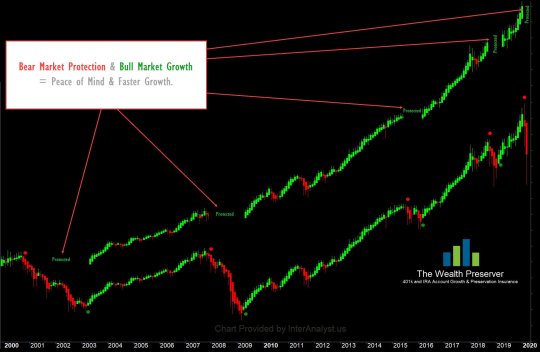
For long-term investors like our Wealth Preserver Members, just remain patient and let the market dictate when the bottom has been formed. As you can see in the image below, the InterAnalyst Green Buy signal will come as it has every other time. But it only signals when the market is on solid footing.
Bear markets never end with optimism, but in despair. So remain patient, it the bear will end and you will capture the slingshot move back up once the markets are on solid footing.
Although we continue to author opinion and analysis, please remember that our writings do not replace the green buy and red sell signals derived from over 140 years of market analytics. Use the Wealth Maximizer Pro to help give you daily charts and signals to help with daily market direction. Apply those to the Wealth Maximizer Weekly charts and signals to give you more confidence in the direction.
When the Wealth Preserver Monthly signal confirms both the Wealth Maximizer and Wealth Maximizer Pro memberships, you are prepared for the slingshot.
Members Version of A Sharp Reflex Rally
Members please login to view your market signals and read the balance of this post for entry and exit points.
Read the full article
#DIA#DowJonesMarketUpdate#DowJonesupdate#GoldTradingSignals#Nasdaq#QQQ#QQQTradingSignals#Russell2000#S&P500Index#S&P500TradingSignals#SPYTradingSignals#TradeSignals#WealthMaximizer#WealthMaximizerPRO#WealthPreserver
0 notes
Text
Destructive Coronavirus Truth
The Destructive Coronavirus Truth is much more dangerous than the virus itself.
No one has stated it more clearly that Mr. Celente in this video. We appreciate and value his Wealth Preserver Membership.
You absolutely must watch every minute of this video as he is as animated as ever.
He explains the who, what, why, where, and when of this whole mess. More importantly, he does not mince words of how its effecting the economy.
Fortunately our members have been protected from this crash and are preparing the coming slingshot up. Holding the right investment will be vital and once this crash and slingshot back up is over, the real depression and 90% crash is coming.
The Wealth Preserver will guide our members step by step through the future like a GPS system for your Investments and retirement accounts.
Use the following promo code: Wealth25
Read the full article
#DIA#DowJonesMarketUpdate#Nasdaq#QQQ#QQQTradingSignals#RUTTradingSignals#S&P500#S&P500Index#SPYTradingSignals#StockMarketCrash#StockTradingSignals#TradeSignals#TradingStrategy#WealthMaximizerPRO#WealthPreserver
0 notes
Text
Is There Blood In The Street Yet?


Baron Rothschild, an 18th-century British nobleman and member of the Rothschild banking family, is credited with saying that "the time to buy is when there's blood in the streets."
The original quote is believed to be "Buy when there's blood in the streets, even if the blood is your own."Here is an image of today's Drudge Report...Based on the Drudge report, it certainly looks like someone is bleeding right now.
Are we at the bottom though?
All my neighbors are out walking for exercise or stress relief.
What I do know is that I saw the same types of activities going on in late 2002 and 2008. Well because this is early 2020, let's hope to see it bottom soon and turn up.
We expect a "Slingshot" to the upside with the same ferocity as it had to the downside.
On February 18th, our daily trading charts issued a stock market exit signal. It was supported by our weekly sell signal that week, followed by our monthly Wealth Preserver that month.(Click on any image to maximize)Now that the Bear Market has come out of the woods to show itself, no one knew it would come with a unique flu called Caronavirus. This virus has certainly moved the bear into the psyche of our global economy. And by the looks of the Drudge Report, the bears cold has gotten worse.
When will this Bear fever break?
We will know within a few days of it bottoming and turning up.
As Baron Von Rothschild knows, more blood is coming before the bear will be ready to hibernate again. Fortunately, we give entry signals just as we have for almost 30 years.These signals in the charts are real and have been followed by our member from further back than the chart illustrates.
Each bar in the chart represents a month, all you need to do to visualize the power is to move the Green Signal up and over the prior Red Signal, and you can quickly realize how much farther ahead you would be.
Here, let me do it for you:
Read the full article
#DIA#DowJonesMarketUpdate#Nasdaq#QQQ#QQQTradingSignals#RUTTradingSignals#S&P500#S&P500Index#SPYTradingSignals#StockMarketCrash#StockTradingSignals#TradeSignals#TradingStrategy#WealthMaximizerPRO#WealthPreserver
0 notes
Text
Here's When The Stock Market Explodes Up
This is the Global Central Bank, Pension Fund, Retirement Account, and Stock Market Crash we warned was coming. It is here.
As for a bottom?
Keep in mind that we MUST go down first in order to clean it out and this then creates the bear trap as we saw back in 2009.
It will turn when there is more "blood in the streets" and all three of our memberships pegged it and protected our Members. That is why our members have avoided 70% of this decline thus far and will likely avoid 95% of it before it turns up. The important point here is that they will reenter the market with as much money as they had in late February.
And as the market turns and rallies off the bottom, the banks, brokerages, insurance companies and press will once again not believe it has turned because they will fear it will turn down again.
To our Members, this current market action only reinforces long-term forecast.
Now, with global interest rates at, or near, zero, bonds will soon become the place to leave.
Where will that money go?
Eventually, the only place for capital to shift to will be US Equities. Specifically, these will be in a slingshot move up.
Read the full article
#DIA#DowJonesMarketUpdate#Nasdaq#QQQ#QQQTradingSignals#RUTTradingSignals#S&P500#S&P500Index#SPYTradingSignals#StockMarketCrash#StockTradingSignals#TradeSignals#TradingStrategy#WealthMaximizerPRO#WealthPreserver
0 notes
Text
Are We Close To The Bottom Of This Crash?

Livio, As a member and reading your member blog posts I was amazed how precise your exit signal was on February 18th. I just have one simple question. Are we close to the bottom of this crash yet?
Paul, Toronto
Good Question Paul.
The simple answer is that question is only God knows the exact day, hour, and precise number is the bottom on the Dow or S&P 500. However, we have guideline to give us the general idea. which I will cover shortly. Before I cover "todays" chart, the next section is a review of one of our members posts and chart from 2 days ago:
Trend-lines, also known as bounding lines, are lines drawn on a stock chart that connect two or more price points. Since stock prices tend to trend, trend-lines that connect the highs or lows in the stock's price history can help identify the current trend and predict what the stock price might do in the future.
The markets are based on TIME and PRICE. So in time the bottom moves along the final green trend line. X axis is time, Y axis is price.
The axis is the bottom of all the prior closings in time (trend line) in the price. That is why the green line is at the bottom of the rising price trend.
In our current chart above you can clearly see when parallel market lines of prior bull runs have a retracement or Bear Market there is always possible turning point.
One possible turning point is a right before a Fib/Phi level of a 28% decline at 2477.92. So until then I will not trust the validity of any counter trend bullish rally.
NOTICE: If it breaks the trendline just take a look at where the market could head using history as your confirmation. Ouch. Thank goodness the Wealth Preserver protected you.That post was then and this is for today and when and where the bottom comes, lets look at the following chart.
To make it clear, I offered precise trading ranges to help you assess when and where the bottom arrives. Remember that price changes with time and that is why ranges are used because as time moves forward the range in the area automatically changes.
I have colored and commented each colored area in the chart for clarity and ease of understanding.
As the Daily, Weekly, and Monthly trade signals become available in your members area, you will precisely know when the bottom arrives in both time and price.
Ciao for now.
Members can login here to view the balance of this information and the actual trade signals.
Read the full article
#DIA#DowJonesMarketUpdate#Nasdaq#QQQ#QQQTradingSignals#RUTTradingSignals#S&P500#S&P500Index#SPYTradingSignals#StockMarketCrash#StockTradingSignals#TradeSignals#TradingStrategy#WealthMaximizerPRO#WealthPreserver
0 notes
Text
InsidersPower Newsletter - March 2020

The InsidersPower Newsletter is ready to be viewed along with your Monthly, Weekly, and Daily charts with trade signals.
The stock markets around the world have been impacted dramatically and the InterAnalyst system has produced many trade signals across all industries and countries.
Log in now to read the entire newsletter and the last section to learn precisely how to get your accounts right back to where they were before this "flash crash".Free 7 Day Trials Here
Read the full article
#DIA#DowJonesMarketUpdate#Nasdaq#QQQ#QQQTradingSignals#RUTTradingSignals#S&P500#S&P500Index#SPYTradingSignals#StockMarketCrash#StockTradingSignals#TradeSignals#TradingStrategy#WealthMaximizerPRO#WealthPreserver
0 notes
Text
Part 2: When Will The Markets Turn Up?

As I mentioned in yesterdays Bull & Bear Blog post, there was a gap to fill below yesterdays close. Today, traders put in their best efforts to close the gap, but failed to do so as you see in the chart below.
Now that it is likely to break through and fill the gap, whats next? The indexes like to break significant corrections into 3 phases with 2 rallies before they bottom. So, lets take a look at one example of this that could repeat now.
The image below is from the most recent correction in 2018:That drop lasted from October - December and bounced back in January. Usually corrections of significance take back roughly -20% from the top and are not considered bear markets.
So as we can see in the top image, we have take only 9% from the top in relative terms, 11% less than in 2018.
Nonetheless, we now live in 2020 and our run up to this correction was long and strong, so we are giving back some right now with the help of the Corona-virus. Unlike 2018 this may not bounce back quite as quick because the virus is spreading still.
Because our Wealth Preserver signals have been so accurate at protecting against serious Bear Markets and sideways consolidating markets lets take a look at our famous question...
"If today were the last day of the month, what would be the likely signal for the S&P500, Nasdaq, Dow, and Russell 2000?"
Read the full article
#DIA#dowjones#GoldTradingSignals#QQQ#QQQTradingSignals#Russell2000#RUT#S&P500Index#SPY#SPYTradingSignals#TradeSignals#TradingStrategy#WealthMaximizer#WealthMaximizerPRO#WealthPreserver
0 notes
Text
When Will The Markets Turn Up?

When will the markets turn up? Watch this short video to learn precisely when this will happen for immense profits!
Read the full article
#DIA#dowjones#GoldTradingSignals#QQQ#QQQTradingSignals#Russell2000#RUT#S&P500Index#SPY#SPYTradingSignals#TradeSignals#TradingStrategy#WealthMaximizer#WealthMaximizerPRO#WealthPreserver
0 notes
Text
Markets may be underestimating US-China trade war risks

Stocks on Wall Street climbed higher this week due in part to increased hopes for a U.S.-China trade war resolution — but Blackstone's Joseph Zidle warned that investors might be too optimistic.
Zidle, chief investment strategist at the asset management firm, said the trade war will likely drag on much longer than what investors are currently expecting. That means the impact on the economy and financial markets could be "bigger than most people think," he said on Friday.
"The markets are really pricing in Goldilocks: they're pricing in more Fed cuts and some sort of positive resolution to trade. I just think that, at this point, sentiment is excessive," Zidle told CNBC's "Squawk Box."
"I think both the United States and China are preparing for a much longer, a prolonged and drawn out period of uncertainty," he added.
His comments came after the Dow Jones Industrial Average recorded its seventh straight day of gains on Thursday, while the S&P 500 and Nasdaq Composite climbed for the third consecutive day.
Global trade is really complicated, it's complex and it's intertwined ... The unintended consequences of trade wars and currency wars I think are hard to understand. My guess is they're going to be bigger than most people think.
Trade war consequences
The U.S. and China have since the beginning of 2018 slapped tariffs on each other's goods worth billions of dollars. The trade war has hurt business sentiment and slowed down import and export activity globally.
The International Monetary Fund said on Thursday that tariffs imposed by the two countries could shave 0.8% off global economic output in 2020, with potentially more losses in the following years, according to a Reuters report. In response, U.S. Treasury Secretary Steven Mnuchin said he hasn't seen the new IMF forecast, but he doesn't expect the impact on America to be as significant, Reuters reported.
Zidle said the trade war could bring about "unintended consequences" that many may not be aware of right now. He explained that many companies have set up complex production chains that spread across a large number of countries. So, the exact impact of a trade war is difficult to quantify, he added.
In addition, Trump could still extend the trade war to other economies such as Europe and Mexico — which would put more pressure on financial markets, the strategist said.
"Global trade is really complicated, it's complex and it's intertwined," he said. "The unintended consequences of trade wars and currency wars I think are hard to understand. My guess is they're going to be bigger than most people think."
Read the full article
#BlackstoneGroupInc#businessnews#China#donaldtrump#DowIndustrials#economy#europe#InternationalMonetaryFund#Investmentstrategy#markets#Mexico#NASDAQComposite#S&P500Index#StevenMnuchin#stockmarkets#trade#UnitedStates#Worldeconomy#WorldMarkets
0 notes
Text
The market's trip to new highs is different this time

Strength in semiconductors and a whole host of other sleeper stocks is a telling sign that the market will not only make it to new highs but could remain in an uptrend, according to technical analysts.
For a couple years, investors could simply look to the performance of the favorite FANG names — Facebook, Amazon, Netflix and Alphabet — for clues to market performance, but now the fact that a broad range of stocks are being swept higher is a very positive sign.
"This is different than the past few moves back to highs. You have a bigger base. When you have one group that's leading and everything else is left behind it's easy to lose that one group, and you hit an air pocket," said Scott Redler, technical analyst and partner with T3Live.com. "When you have a lot of groups and they're taking turns, it's harder to break the back of the bull."
The S&P 500 ended Thursday at 3,009, up 8, and just 0.6% away from its all-time high. The Dow, which is also less than a percent from its high, ended at 27,182, up 0.2%. The S&P's high from late July was 3,027.98, and Redler said it would be a positive if it can continue to hold above the psychological 3,000 level.
The small-cap Russell 2000 ended off by less than a point at 1,575, but it is up 4.6% for the week, in its best weekly performance so far since January.
Stocks are powering higher amid positive developments in the trade wars, with U.S. officials preparing to meet Chinese counterparts next month. Analysts have said the market's run higher could be disrupted if there is negative news on the trade front. For now, both the U.S. and China have held off on some new tariffs in a show of good faith.
Trading in recent sessions has been markedly different than in other phases of the bull market. Value stocks, or those less loved and with lower price-to-earnings ratios, have been gaining favor. At the same time, the momentum stock winners underperformed, though some are moving higher after falling at the beginning of the week.
"I think the general view out there is growth and value are mutually exclusive ideas. I disagree. I think they can work in tandem," said Chris Verrone, Strategas Research head of technical strategy. "We call that a broader market."
A number of those momentum names were higher Thursday, including Visa, up 2.3%, and Mastercard, up 2.4%, and the iShares Edge MSCI USA Momentum Factor ETF was up 1.4%. At the same time, the iShares S&P 500 Value ETF IVE had been moving opposite momentum, but it was slightly higher in afternoon trading.
Some strategists say the big rotation, which was not so obvious in Thursday's trading, was kicked off by the belief that interest rates are rising after finding a bottom this summer. The 10-year yield Thursday was at 1.78%, just weeks after hitting a low of 1.42%. Yields move opposite price.
In the recent past, when the stock market returned to highs, it was led by FANG, Redler said. "This time tech and FANG are kind of in line and not a headwind," he said, "but it's the broad-based nature of the value names, small caps and banks that lifted the S&P to play catch up, and lifted it back to its highs."
"Now in order to power above it, it's time for FANG to wake back up. Semiconductors are considered the backbone of tech. The semiconductors are giving clues that things aren't so bad and China is still ordering, and there's the potential for a deal ... Semis are the backbone of tech, and FANG is the heart of it," he said.
Frank Cappelleri, executive director at Instinet, said the best-case scenario for the market is for the momentum laggards from earlier in the week to join the value and other stocks that are moving higher. He said the software sector is a key group to regain ground. Microsoft was up 1.4% Thursday after getting knocked down earlier in the week.
"I think you always have to watch tech, how semiconductors are doing going forward. SMH has quietly gotten back to its highs of the summertime," said Capelleri. "If you looked at what happened last year, they lagged since March of 2018."
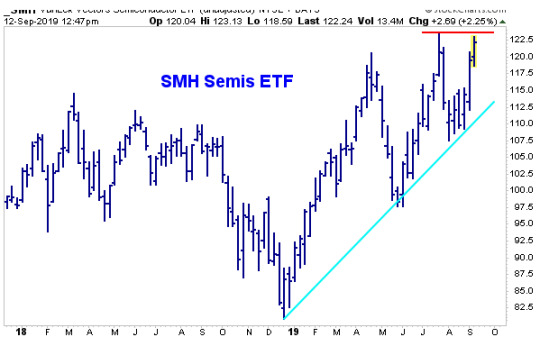
Source: Instinet
Cappelleri said in a week where momentum got hit so hard, the sector "was stubborn in terms of not losing its bid." SMH was up 2.6% for the week and is now up 7.1% for September so far.
"The semis have been quiet for months, but over the last two weeks they're making all-time highs," said Verrone. "Really over the last two years they've been sideways and ... over the last couple of weeks they've been waking up."
Verrone said the leaders in the group are behaving well, as the sector reasserts its market leadership. "Texas Instrument and Taiwan Semiconductor are big global bellwethers that behaved resoundingly well, despite what many people believe is a tense trade and global growth environment," he said.
Verrone said the two chip names are part of a handful of stocks he is watching to gauge the market's health. The others are Alibaba, J.P. Morgan and Apple.
"Two weeks ago, they had these bank stocks on the ropes. The referee was about to stop the fight. But the way they've come back from that is impressive. J.P. Morgan, in particular, is literally on the doorstep of a new all-time high," he said. "They had every opportunity to just finish that one off a couple of weeks ago. They couldn't keep it down."
Alibaba, Chinese e-retailer, is at the center of the trade conflict. "It's ground zero for the Chinese consumer stocks and growth," he said.
Apple, a U.S. tech and consumer bellwether, has also been behaving well, and was up for three days around a product announcement of new iPhones and iPads. That is unusual for the company's shares, which often sag around product announcements.
Verrone said Wall Street's current lack of love for the one-time darling is a positive for a further move higher.
"Apple has the fewest number of buy ratings from the sell side at any point in about a decade," he said. "All during the summer you saw all the analysts capitulate," he said.
Verrone said he expects the market to continue moving higher and the S&P 500 to reach 3,150 by the end of the year.
Besides the strong behavior of those select stock names, Verrone said, there are plenty of other positives.
"I just can't remember a time when the divide between perception and reality has been so wide," said Verrone. "People have been very uncomfortable all summer, but the stocks don't act bad. That tells us the market is heading higher."
Improvements in such indicators as the advancing shares over declining is also a good sign for further gains. Verrone said earlier this week the percent of stocks with an upward sloping 200-day moving average is the best of the year so far, and new highs are show up in transports, discretionary and banks.
"A breadth surge over the last two weeks is as good as anything we've seen in the days and weeks coming off the December 2018 lows," he said. "That's true in Europe and domestically as well."
Read the full article
#AlibabaGroupHoldingLtd#AlphabetClassA#Amazon.comInc#AppleInc#businessnews#DowIndustrials#earnings#Facebook#iSharesEdgeMSCIUSAMomentumFactorETF#iSharesS&P500ValueETF#JPMorganChase&Co#MarketInsider#markets#NetflixInc#Russell2000Index#S&P500Index#U.S.10YearTreasury#VanEckVectorsSemiconductorETF#wallstreet
0 notes
Text
Stocks are expected to break out to new highs, barring any errant presidential trade tweets

The stock market is itching to make new highs, and it may soon, as long as progress continues to appear to be made on the trade war front.Technical market analysts, who watch stock charts, see an opportunity for stocks to break above previous highs, after the S&P 500 rose above its 50-day moving average last week and crossed above August highs, two signals of positive momentum.For fundamental analysts, there are other positives in place for stocks, including a possible bottom in interest rates, central bank easing and a pick up in some economic data.

But the one wild card is the trade war, which appears to be making progress with talks planned for October between U.S. and Chinese officials.The S&P 500 is about 1.7% away from its late July high of 3,027.98, and stocks have recently been driven higher by strength in technology and consumer discretionary stocks. Both sectors are within 2% of all-time highs."Technically, it set itself up, and now it has to keep itself there," said Scott Redler, partner with T3Live.com. "For the camp that wants to see new all-time highs, they would like to see the S&P 500 to hold 2,940 to 2,955. The longer it holds that, the more likely it will be make 3028, the all-time high."September has started off on positive footing after August's decline. Usually a weak month, the S&P 500 was up 1.7% so far for September, as of Monday. On Monday, the S&P closed at 2,978, down 0.2%.Stocks started Monday higher, but were mixed to flattish in afternoon trading, as technology stocks gave up some gains. Small caps, however, were outperforming, with the Russell 2000 up 1.2% in afternoon trading. Small caps are a sector that has been lagging and was expected to rise as the market returned to its highs.Bond yields, which have moved to worrisome low levels in August, have been higher in September. The 10-year Treasury was yielding 1.63% Monday afternoon.
'Shakeout summer'
"Last week's action was meaningful from a trading basis, in that we broke above the August range, the upper end of the range being 2,940," on the S&P 500, said Ari Wald, technical analyst at Oppenheimer. "I think the underappreciated point for us is the market is coming off cyclically oversold levels." in the past 52 weeks, the S&P has moved higher by just 2.75%, he added."After such little market progress, we're starting to see signs conditions are getting better and global equities are beginning to base in a move higher," said Wald.He said the market is still reacting to last year's sell-off, and is now in a position for a move higher. "When it's done raining, it's still wet outside, and that's what we had in 2019. The storm was in 2018 when we had the big downturn in December," Wald said. "2019 has been base building... It was our case there would be a shakeout summer."Wald said there is also a negative attitude on the part of investors, which could act as a contrarian positive. "The way things are shaping, I think we could experience a nice run up in the equity market in the next 12 months. Clients, and investors, are just coming up with every reason possible not to buy stocks. it's very telling, on a contrarian basis," he said.
Trump tweets
James Paulsen, chief investment strategist at Leuhtold Group, said there are fundamental factors at work, that are also helping stocks and could push them to highs."It's near an all-time high but a mid-morning tweet could put it back," said Paulsen, adding that the trade headlines have created turbulence for stocks. Strategists say tweets from President Donald Trump could move the market in either direction, and recently his trade tweets have been more negative than positive."It does seem, since the Trump tweet in early August...the biggest thing that's changed since then is the global economic reports have gotten better on average," said Pauslen. Paulsen said he has been watching economic surprise indexes, and they are rising globally. The indexes measure beats against misses on economic data, and when they are positive it is perceived as good news for the stock market."Momentum might be improving. Along with that is recession fears are receding. Rates are going back up," said Paulsen. When rates hit very low levels in August, the move reflected fears of a recession and stocks were also shaky.Paulson said the improvement in the economic data is coming as some prior central bank easing is having an impact. "We're focused on the Fed and the ECB, but there's been easing for nine months, and that's starting to come home to roost."But he cautions that if the yield curve does not steepen and is inverted that could undermine investor confidence, since it is a recession warning. The yield curve is inverted when short term intrest rates are higher than long duration rates. He said the Fed should cut rates by 50 basis points to help the process.The European Central Bank meets this week and it is expected to take some action to possibly cut its already negative yields and boost its asset purchase program. The Fed meets next week, and it is expected to cut interest rates at least by a quarter point.JP Morgan equity strategists expect the stock market to rise into year end, and they see a list of reasons to be positive about. "Better technicals, light positioning, more favourable seasonals, signs of a trough inactivity momentum, potential de-escalation in trade uncertainty, 2nd Fed cut— which might move ahead of market expectations this time, and finally the up coming restart of ECB's QE are likely to be the positive catalysts for this up move, in our view," the strategists wrote in a note.
U.S. economic surprise index

Source: CitigroupWith the change in tone for stocks, analysts say it's time to shift holdings."Cyclicals/Defensives flows, price relatives and Value/Growth valuations all look stretched, with Banks in particular trading significantly below what peripheral spreads would imply," noted the J.P. Morgan strategists in a note. "We have argued last week that a turn in sector leadership is upon us, especially if bond yields inflect higher, where Cyclicals and Banks should be favoured into the year-end."Paulsen said he sees opportunity in smaller tech names, versus the FANG stocks—Facebook, Twitter, Amazon and Alphabet, Google parent. To varying degrees, the FANG stocks have been subject to government scrutiny for possible new regulations or even taxes on the group."It's still not easy out there. The rotation could be vicious at time, whereas in the last two weeks you just saw the cloud computing and software names lose momentum and get hit. You also saw the hot IPO sector lose momentum and get hit. You need to be in the right place at the right time," said Redler. "Shorts aren't doing so well. You really had to be a surgeon to pick the best spots and keep moving fast to stay with the sectors that are in vogue."Wald said one sector that is showing strength is semiconductors, despite the ups and downs of trade headlines. He said the Philadelphia Semiconductor Index SOX, which has reclaimed highs, is showing signs of a bigger breakout. Wald said he expects tech to continue leading the bull market higher.
Read the full article
#businessnews#earnings#MarketInsider#markets#PHLXSemiconductorSectorIndex#Russell2000Index#S&P500Index#wallstreet
0 notes
Text
These investors made a killing betting on waste management company

Source: Waste ConnectionsChristopher Warner and Ozo Jaculewicz helped build one of the top-performing funds of 2019 with an unconventional bet: Waste Connections.Waste Connections, a waste management company based in Canada, has the largest weight in the Wells Fargo Asset Management Discovery fund (WFDAX), which is managed by Warner and Jaculewicz. Their bet on Waste Connections panned out, with the stock gaining 23% this year. It has also led to massive gains for the fund's investors in 2019.The four-star rated fund is up 34.9% this year and is outperforming 97% of the funds in its category, according to Morningstar. The fund — which has $2.6 billion in assets — has also been on fire relative to the S&P 500, which is up 18.7% in 2019.

"The way we manage the portfolio and the way we think about things is we like balance and sales," said Warner, one of the fund's co-managers. "We're growth managers but we like a balanced portfolio so we can do well in different market environments."Connor Young, an analyst at Morningstar, said that while the fund is a top performer, it has been vulnerable to big pullbacks in the market given its tilt towards high-growth companies. The fund, Young noted, posted a 20% loss in the fourth quarter of 2018 amid a sharp market downturn."But at their core, these are talented and experienced managers who … continue to carry out a proven approach that has delivered strong long-term results at this fund," Young said.
'The right side of change'
Waste Connections was first added to the fund in June 30, 2016 after the company announced a merger with rival Progressive Waste Solutions. In that time, the Waste Connections shares have almost doubled."Progressive was a poorly managed asset," Warner said. "Waste Connections just had a better strategy than everyone else. They focus on secondary markets; markets where they can be the only provider."Waste Connections fits into the team's philosophy of investing in companies that are on "the right side of change," Warner added."Think about the Krogers vs. the Amazons. The consumer preference for younger consumers is to get their groceries delivered, have low prices and transparency. Kroger, to a certain extent has invested in stores and store distribution," he said. "In our view, those companies ... are on the wrong side of change."Other stocks that fit this investment strategy include MercadoLibre, an online retailer based in Argentina, and Black Knight, a company that builds software solutions for banks to better process mortgage originations and home equity lines.MercadoLibre shares have been on fire this year, skyrocketing more than 100%. The stock has done even better since the fund first invested in it. MercadoLibre is up more than 200% since Sept. 30, 2016.Warner said MercadoLibre's integrated payment system, coupled with its e-Bay-like marketplace, put it on the right side of change."In emerging markets like that, consumers tend to skip a step and they may not even get a credit card or a bank account," he said. "They'll deal directly with the e-commerce provider, sort of like Alipay and WeBank in China. They'll skip the traditional businesses we're used to."As for Black Knight, the company has a lot of space to grow as banks' software infrastructure ages and it becomes more expensive to upgrade, Warner noted. "What Black Knight has done is create a packaged software solution to offer to these banks, take it over at a much lower cost while providing the functionality you need to be competitive in the modern world."Black Knight shares are up about 41% this year. The stock was first added into the fund on Oct. 31, 2017. Since then, the stock is 40% higher.
Finding 'mispriced' innovations
The fund's investment approach has returned more than 17% over the past three years, outperforming nearly 90% of its peers over that time."We think the long-term prospects of those companies on the right side of change are commonly misperceived by the market," said Jaculewicz, an associate manager working in the fund. "That's a key anomaly and a key signal that we're looking to exploit. We think innovation is mispriced pretty often."But Jaculewicz added it is becoming increasingly difficult to effectively navigate this market and find good companies to invest in."There are just simply fewer businesses in the world that can grow earnings and cash flow at sort of predictable levels," he said. "In a world that's starved of growth, investors are going to continue to seek out characteristics that are more certain."Subscribe to CNBC on YouTube.
Read the full article
#Amazon.comInc#BlackKnightInc#BreakingNews:Markets#businessnews#Investmentstrategy#MercadoLibreInc#S&P500Index#stockmarkets#TheKrogerCo#wallstreet#WasteConnectionsInc#WellsFargoDiscoveryFund-ClassA
0 notes
Text
Special chart suggests the market is starting a hot streak
Bespoke Investment's Paul Hickey believes a market hot streak is unfolding.The independent market researcher is building his bullish case by zeroing in on the Citi Economic Surprise Index, which is built to measure optimism in the economy. In the week ending Friday, the index flipped into positive after spending more than 100 days in negative territory. Hickey contends the move suggests investors are feeling more confident about the economy's direction, so there's a good chance stocks will rip higher.
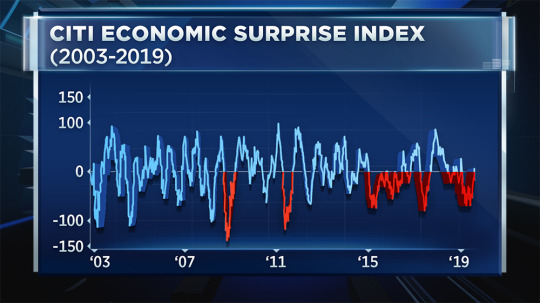
"There are five prior periods that we're talking about. One, three and six months later, the S&P was higher four out of five times," Hickey told CNBC's "Trading Nation" on Friday. "When we looked at when these prior streaks have ended and expectations have been ratcheted down enough, the market actually did quite well going forward."Hickey is emphasizing the trend because the gains are pretty significant.When the index went negative for at least 100 days, he reports the S&P 500's median gains were 4% over the next month, 6% three months later and 8.5% six months later.And, stocks may be well on their way.The S&P 500 and Dow are closing in on their all-time highs again. They're now less than 2.5% away and ended the week above their 50 day moving averages.Stocks picked up momentum after President Donald Trump indicated trade talks with China were getting back on track, and economic data exceeded expectations."When it's such a foregone conclusion in that the economy is weakening and the stock market is going to go down, that's usually when you have the best times to catch a rally in stocks when sentiment is all looking the other way," Hickey said. Disclaimer
Read the full article
0 notes
Last Seen Blogs

vebiotic
Untitled

miasmacaron
Uguu Motherfucker

earlysworld-blog
شركة تنظيف

dylanocryinforever
I'm a khaleesi not a queen

camdenscomics
Camden's Comics