#simple linear regression analysis
Explore tagged Tumblr posts
Visit Tumblr Blog
Explore Tumblr blogs with no restrictions, modern design and the best experience.
Last Seen Tumblr Blogs


Fun Fact
There are dozens of funny blogs to kill time on Tumblr.
Text
Executive summary
If you wanted to show the American public that the COVID vaccines saved lives, the easiest proof is to plot each state (or county) based on its vaccination rate (x axis) and its change in mortality from pre-vaccination baseline on the y-axis.
I did this. The slope is positive.
This means that more vaccinations are associated with higher mortality.
Can this be challenged?
I don’t think so.
The data is the data. They can’t change it. And there is only one way to draw a line through the data. If the shots worked, the slope would be strongly negative and it’s not.
This is likely why not a single paper attempts to do the most obvious analysis. They probably did it, saw that it was not supporting the narrative, and then decided not to publish.
Results for state regression and county regression
The slope was positive and statistically significant for both the state and county analysis. This means that the COVID vaccines did the opposite of what they promised: it increased your risk of death.
The R2 value of .31 is quite spectacular and it means this isn’t an accident.
21 notes
·
View notes
Text
Python Libraries to Learn Before Tackling Data Analysis
To tackle data analysis effectively in Python, it's crucial to become familiar with several libraries that streamline the process of data manipulation, exploration, and visualization. Here's a breakdown of the essential libraries:
1. NumPy
- Purpose: Numerical computing.
- Why Learn It: NumPy provides support for large multi-dimensional arrays and matrices, along with a collection of mathematical functions to operate on these arrays efficiently.
- Key Features:
- Fast array processing.
- Mathematical operations on arrays (e.g., sum, mean, standard deviation).
- Linear algebra operations.
2. Pandas
- Purpose: Data manipulation and analysis.
- Why Learn It: Pandas offers data structures like DataFrames, making it easier to handle and analyze structured data.
- Key Features:
- Reading/writing data from CSV, Excel, SQL databases, and more.
- Handling missing data.
- Powerful group-by operations.
- Data filtering and transformation.
3. Matplotlib
- Purpose: Data visualization.
- Why Learn It: Matplotlib is one of the most widely used plotting libraries in Python, allowing for a wide range of static, animated, and interactive plots.
- Key Features:
- Line plots, bar charts, histograms, scatter plots.
- Customizable charts (labels, colors, legends).
- Integration with Pandas for quick plotting.
4. Seaborn
- Purpose: Statistical data visualization.
- Why Learn It: Built on top of Matplotlib, Seaborn simplifies the creation of attractive and informative statistical graphics.
- Key Features:
- High-level interface for drawing attractive statistical graphics.
- Easier to use for complex visualizations like heatmaps, pair plots, etc.
- Visualizations based on categorical data.
5. SciPy
- Purpose: Scientific and technical computing.
- Why Learn It: SciPy builds on NumPy and provides additional functionality for complex mathematical operations and scientific computing.
- Key Features:
- Optimized algorithms for numerical integration, optimization, and more.
- Statistics, signal processing, and linear algebra modules.
6. Scikit-learn
- Purpose: Machine learning and statistical modeling.
- Why Learn It: Scikit-learn provides simple and efficient tools for data mining, analysis, and machine learning.
- Key Features:
- Classification, regression, and clustering algorithms.
- Dimensionality reduction, model selection, and preprocessing utilities.
7. Statsmodels
- Purpose: Statistical analysis.
- Why Learn It: Statsmodels allows users to explore data, estimate statistical models, and perform tests.
- Key Features:
- Linear regression, logistic regression, time series analysis.
- Statistical tests and models for descriptive statistics.
8. Plotly
- Purpose: Interactive data visualization.
- Why Learn It: Plotly allows for the creation of interactive and web-based visualizations, making it ideal for dashboards and presentations.
- Key Features:
- Interactive plots like scatter, line, bar, and 3D plots.
- Easy integration with web frameworks.
- Dashboards and web applications with Dash.
9. TensorFlow/PyTorch (Optional)
- Purpose: Machine learning and deep learning.
- Why Learn It: If your data analysis involves machine learning, these libraries will help in building, training, and deploying deep learning models.
- Key Features:
- Tensor processing and automatic differentiation.
- Building neural networks.
10. Dask (Optional)
- Purpose: Parallel computing for data analysis.
- Why Learn It: Dask enables scalable data manipulation by parallelizing Pandas operations, making it ideal for big datasets.
- Key Features:
- Works with NumPy, Pandas, and Scikit-learn.
- Handles large data and parallel computations easily.
Focusing on NumPy, Pandas, Matplotlib, and Seaborn will set a strong foundation for basic data analysis.
8 notes
·
View notes
Text
How to Become a Data Scientist in 2025 (Roadmap for Absolute Beginners)

Want to become a data scientist in 2025 but don’t know where to start? You’re not alone. With job roles, tech stacks, and buzzwords changing rapidly, it’s easy to feel lost.
But here’s the good news: you don’t need a PhD or years of coding experience to get started. You just need the right roadmap.
Let’s break down the beginner-friendly path to becoming a data scientist in 2025.
✈️ Step 1: Get Comfortable with Python
Python is the most beginner-friendly programming language in data science.
What to learn:
Variables, loops, functions
Libraries like NumPy, Pandas, and Matplotlib
Why: It’s the backbone of everything you’ll do in data analysis and machine learning.
🔢 Step 2: Learn Basic Math & Stats
You don’t need to be a math genius. But you do need to understand:
Descriptive statistics
Probability
Linear algebra basics
Hypothesis testing
These concepts help you interpret data and build reliable models.
📊 Step 3: Master Data Handling
You’ll spend 70% of your time cleaning and preparing data.
Skills to focus on:
Working with CSV/Excel files
Cleaning missing data
Data transformation with Pandas
Visualizing data with Seaborn/Matplotlib
This is the “real work” most data scientists do daily.
🧬 Step 4: Learn Machine Learning (ML)
Once you’re solid with data handling, dive into ML.
Start with:
Supervised learning (Linear Regression, Decision Trees, KNN)
Unsupervised learning (Clustering)
Model evaluation metrics (accuracy, recall, precision)
Toolkits: Scikit-learn, XGBoost
🚀 Step 5: Work on Real Projects
Projects are what make your resume pop.
Try solving:
Customer churn
Sales forecasting
Sentiment analysis
Fraud detection
Pro tip: Document everything on GitHub and write blogs about your process.
✏️ Step 6: Learn SQL and Databases
Data lives in databases. Knowing how to query it with SQL is a must-have skill.
Focus on:
SELECT, JOIN, GROUP BY
Creating and updating tables
Writing nested queries
🌍 Step 7: Understand the Business Side
Data science isn’t just tech. You need to translate insights into decisions.
Learn to:
Tell stories with data (data storytelling)
Build dashboards with tools like Power BI or Tableau
Align your analysis with business goals
🎥 Want a Structured Way to Learn All This?
Instead of guessing what to learn next, check out Intellipaat’s full Data Science course on YouTube. It covers Python, ML, real projects, and everything you need to build job-ready skills.
https://www.youtube.com/watch?v=rxNDw68XcE4
🔄 Final Thoughts
Becoming a data scientist in 2025 is 100% possible — even for beginners. All you need is consistency, a good learning path, and a little curiosity.
Start simple. Build as you go. And let your projects speak louder than your resume.
Drop a comment if you’re starting your journey. And don’t forget to check out the free Intellipaat course to speed up your progress!
2 notes
·
View notes
Text
Beginner’s Guide to Ridge Regression in Machine Learning
Introduction
Regression analysis is a fundamental technique in machine learning, used to predict a dependent variable based on one or more independent variables. However, traditional regression methods, such as simple linear regression, can struggle to deal with multicollinearity (high correlation between predictors). This is where ridge regression comes in handy.
Ridge regression is an advanced form of linear regression that reduces overfitting by adding a penalty term to the model. In this article, we will cover what ridge regression is, why it is important, how it works, its assumptions, and how to implement it using Python.
What is Ridge Regression?
Ridge regression is a type of regularization technique that modifies the linear
click here to read more
https://datacienceatoz.blogspot.com/2025/02/a-beginners-guide-to-ridge-regression.html
#artificial intelligence#bigdata#books#machine learning#machinelearning#programming#python#science#skills#big data
4 notes
·
View notes
Text
What are the skills needed for a data scientist job?
It’s one of those careers that’s been getting a lot of buzz lately, and for good reason. But what exactly do you need to become a data scientist? Let’s break it down.
Technical Skills
First off, let's talk about the technical skills. These are the nuts and bolts of what you'll be doing every day.
Programming Skills: At the top of the list is programming. You’ll need to be proficient in languages like Python and R. These are the go-to tools for data manipulation, analysis, and visualization. If you’re comfortable writing scripts and solving problems with code, you’re on the right track.
Statistical Knowledge: Next up, you’ve got to have a solid grasp of statistics. This isn’t just about knowing the theory; it’s about applying statistical techniques to real-world data. You’ll need to understand concepts like regression, hypothesis testing, and probability.
Machine Learning: Machine learning is another biggie. You should know how to build and deploy machine learning models. This includes everything from simple linear regressions to complex neural networks. Familiarity with libraries like scikit-learn, TensorFlow, and PyTorch will be a huge plus.
Data Wrangling: Data isn’t always clean and tidy when you get it. Often, it’s messy and requires a lot of preprocessing. Skills in data wrangling, which means cleaning and organizing data, are essential. Tools like Pandas in Python can help a lot here.
Data Visualization: Being able to visualize data is key. It’s not enough to just analyze data; you need to present it in a way that makes sense to others. Tools like Matplotlib, Seaborn, and Tableau can help you create clear and compelling visuals.
Analytical Skills
Now, let’s talk about the analytical skills. These are just as important as the technical skills, if not more so.
Problem-Solving: At its core, data science is about solving problems. You need to be curious and have a knack for figuring out why something isn’t working and how to fix it. This means thinking critically and logically.
Domain Knowledge: Understanding the industry you’re working in is crucial. Whether it’s healthcare, finance, marketing, or any other field, knowing the specifics of the industry will help you make better decisions and provide more valuable insights.
Communication Skills: You might be working with complex data, but if you can’t explain your findings to others, it’s all for nothing. Being able to communicate clearly and effectively with both technical and non-technical stakeholders is a must.
Soft Skills
Don’t underestimate the importance of soft skills. These might not be as obvious, but they’re just as critical.
Collaboration: Data scientists often work in teams, so being able to collaborate with others is essential. This means being open to feedback, sharing your ideas, and working well with colleagues from different backgrounds.
Time Management: You’ll likely be juggling multiple projects at once, so good time management skills are crucial. Knowing how to prioritize tasks and manage your time effectively can make a big difference.
Adaptability: The field of data science is always evolving. New tools, techniques, and technologies are constantly emerging. Being adaptable and willing to learn new things is key to staying current and relevant in the field.
Conclusion
So, there you have it. Becoming a data scientist requires a mix of technical prowess, analytical thinking, and soft skills. It’s a challenging but incredibly rewarding career path. If you’re passionate about data and love solving problems, it might just be the perfect fit for you.
Good luck to all of you aspiring data scientists out there!
#artificial intelligence#career#education#coding#jobs#programming#success#python#data science#data scientist#data security
9 notes
·
View notes
Text

Econometrics Demystified: The Ultimate Compilation of Top 10 Study Aids
Welcome to the world of econometrics, where economic theories meet statistical methods to analyze and interpret data. If you're a student navigating through the complexities of econometrics, you know how challenging it can be to grasp the intricacies of this field. Fear not! This blog is your ultimate guide to the top 10 study aids that will demystify econometrics and make your academic journey smoother.
Economicshomeworkhelper.com – Your Go-To Destination
Let's kick off our list with the go-to destination for all your econometrics homework and exam needs – https://www.economicshomeworkhelper.com/. With a team of experienced experts, this website is dedicated to providing high-quality assistance tailored to your specific requirements. Whether you're struggling with regression analysis or hypothesis testing, the experts at Economicshomeworkhelper.com have got you covered. When in doubt, remember to visit the website and say, "Write My Econometrics Homework."
Econometrics Homework Help: Unraveling the Basics
Before delving into the intricacies, it's crucial to build a strong foundation in the basics of econometrics. Websites offering econometrics homework help, such as Khan Academy and Coursera, provide comprehensive video tutorials and interactive lessons to help you grasp fundamental concepts like linear regression, correlation, and statistical inference.
The Econometrics Academy: Online Courses for In-Depth Learning
For those seeking a more immersive learning experience, The Econometrics Academy offers online courses that cover a wide range of econometrics topics. These courses, often led by seasoned professors, provide in-depth insights into advanced econometric methods, ensuring you gain a deeper understanding of the subject.
"Mastering Metrics" by Joshua D. Angrist and Jörn-Steffen Pischke
No compilation of study aids would be complete without mentioning authoritative books, and "Mastering Metrics" is a must-read for econometrics enthusiasts. Authored by two renowned economists, Joshua D. Angrist and Jörn-Steffen Pischke, this book breaks down complex concepts into digestible chapters, making it an invaluable resource for both beginners and advanced learners.
Econometrics Forums: Join the Conversation
Engaging in discussions with fellow econometrics students and professionals can enhance your understanding of the subject. Platforms like Econometrics Stack Exchange and Reddit's econometrics community provide a space for asking questions, sharing insights, and gaining valuable perspectives. Don't hesitate to join the conversation and expand your econometrics network.
Gretl: Your Free Econometrics Software
Practical application is key in econometrics, and Gretl is the perfect tool for hands-on learning. This free and open-source software allows you to perform a wide range of econometric analyses, from simple regressions to advanced time-series modeling. Download Gretl and take your econometrics skills to the next level.
Econometrics Journal Articles: Stay Updated
Staying abreast of the latest developments in econometrics is essential for academic success. Explore journals such as the "Journal of Econometrics" and "Econometrica" to access cutting-edge research and gain insights from scholars in the field. Reading journal articles not only enriches your knowledge but also equips you with the latest methodologies and approaches.
Econometrics Bloggers: Learn from the Pros
Numerous econometrics bloggers share their expertise and experiences online, offering valuable insights and practical tips. Follow blogs like "The Unassuming Economist" and "Econometrics by Simulation" to benefit from the expertise of professionals who simplify complex econometric concepts through real-world examples and applications.
Econometrics Software Manuals: Master the Tools
While software like STATA, R, and Python are indispensable for econometric analysis, navigating through them can be challenging. Refer to comprehensive manuals and documentation provided by these software platforms to master their functionalities. Understanding the tools at your disposal will empower you to apply econometric techniques with confidence.
Econometrics Webinars and Workshops: Continuous Learning
Finally, take advantage of webinars and workshops hosted by academic institutions and industry experts. These events provide opportunities to deepen your knowledge, ask questions, and engage with professionals in the field. Check out platforms like Econometric Society and DataCamp for upcoming events tailored to econometrics enthusiasts.
Conclusion
Embarking on your econometrics journey doesn't have to be daunting. With the right study aids, you can demystify the complexities of this field and excel in your academic pursuits. Remember to leverage online resources, engage with the econometrics community, and seek assistance when needed. And when the workload becomes overwhelming, don't hesitate to visit Economicshomeworkhelper.com and say, "Write My Econometrics Homework" – your trusted partner in mastering econometrics. Happy studying!
13 notes
·
View notes
Text
a Basic Linear Regression Model
What is linear regression?
Linear regression analysis is used to predict the value of a variable based on the value of another variable. The variable you want to predict is called the dependent variable. The variable you are using to predict the other variable's value is called the independent variable.
This form of analysis estimates the coefficients of the linear equation, involving one or more independent variables that best predict the value of the dependent variable. Linear regression fits a straight line or surface that minimizes the discrepancies between predicted and actual output values. There are simple linear regression calculators that use a “least squares” method to discover the best-fit line for a set of paired data. You then estimate the value of X (dependent variable)
n statistics, simple linear regression (SLR) is a linear regression model with a single explanatory variable.[1][2][3][4][5] That is, it concerns two-dimensional sample points with one independent variable and one dependent variable (conventionally, the x and y coordinates in a Cartesian coordinate system) and finds a linear function (a non-vertical straight line) that, as accurately as possible, predicts the dependent variable values as a function of the independent variable. The adjective simple refers to the fact that the outcome variable is related to a single predictor.
It is common to make the additional stipulation that the ordinary least squares (OLS) method should be used: the accuracy of each predicted value is measured by its squared residual (vertical distance between the point of the data set and the fitted line), and the goal is to make the sum of these squared deviations as small as possible. In this case, the slope of the fitted line is equal to the correlation between y and x corrected by the ratio of standard deviations of these variables. The intercept of the fitted line is such that the line passes through the center of mass (x, y) of the data points.
Formulation and computation
[edit]
This relationship between the true (but unobserved) underlying parameters α and β and the data points is called a linear regression model.
Here we have introduced
x¯ and y¯ as the average of the xi and yi, respectively
Δxi and Δyi as the deviations in xi and yi with respect to their respective means.
Expanded formulas
[edit]
Interpretation
[edit]
Relationship with the sample covariance matrix
[edit]
where
rxy is the sample correlation coefficient between x and y
sx and sy are the uncorrected sample standard deviations of x and y
sx2 and sx,y are the sample variance and sample covariance, respectively

Interpretation about the slope
[edit]
Interpretation about the intercept
Interpretation about the correlation
[edit]
Numerical properties
[edit]
The regression line goes through the center of mass point, (x¯,y¯), if the model includes an intercept term (i.e., not forced through the origin).
The sum of the residuals is zero if the model includes an intercept term:∑i=1nε^i=0.
The residuals and x values are uncorrelated (whether or not there is an intercept term in the model), meaning:∑i=1nxiε^i=0
The relationship between ρxy (the correlation coefficient for the population) and the population variances of y (σy2) and the error term of ϵ (σϵ2) is:[10]: 401 σϵ2=(1−ρxy2)σy2For extreme values of ρxy this is self evident. Since when ρxy=0 then σϵ2=σy2. And when ρxy=1 then σϵ2=0.
Statistical properties
[edit]
Description of the statistical properties of estimators from the simple linear regression estimates requires the use of a statistical model. The following is based on assuming the validity of a model under which the estimates are optimal. It is also possible to evaluate the properties under other assumptions, such as inhomogeneity, but this is discussed elsewhere.[clarification needed]
Unbiasedness
[edit]
Variance of the mean response
[edit]
where m is the number of data points.
Variance of the predicted response
[edit]
Further information: Prediction interval
Confidence intervals
[edit]
The standard method of constructing confidence intervals for linear regression coefficients relies on the normality assumption, which is justified if either:
the errors in the regression are normally distributed (the so-called classic regression assumption), or
the number of observations n is sufficiently large, in which case the estimator is approximately normally distributed.
The latter case is justified by the central limit theorem.
Normality assumption
[edit]


Asymptotic assumption
[edit]
The alternative second assumption states that when the number of points in the dataset is "large enough", the law of large numbers and the central limit theorem become applicable, and then the distribution of the estimators is approximately normal. Under this assumption all formulas derived in the previous section remain valid, with the only exception that the quantile t*n−2 of Student's t distribution is replaced with the quantile q* of the standard normal distribution. Occasionally the fraction 1/n−2 is replaced with 1/n. When n is large such a change does not alter the results appreciably.
Numerical example
[edit]
See also: Ordinary least squares § Example, and Linear least squares § Example
Alternatives
[edit]Calculating the parameters of a linear model by minimizing the squared error.
In SLR, there is an underlying assumption that only the dependent variable contains measurement error; if the explanatory variable is also measured with error, then simple regression is not appropriate for estimating the underlying relationship because it will be biased due to regression dilution.
Other estimation methods that can be used in place of ordinary least squares include least absolute deviations (minimizing the sum of absolute values of residuals) and the Theil–Sen estimator (which chooses a line whose slope is the median of the slopes determined by pairs of sample points).
Deming regression (total least squares) also finds a line that fits a set of two-dimensional sample points, but (unlike ordinary least squares, least absolute deviations, and median slope regression) it is not really an instance of simple linear regression, because it does not separate the coordinates into one dependent and one independent variable and could potentially return a vertical line as its fit. can lead to a model that attempts to fit the outliers more than the data.
Line fitting
[edit]
This section is an excerpt from Line fitting.[edit]
Line fitting is the process of constructing a straight line that has the best fit to a series of data points.
Several methods exist, considering:
Vertical distance: Simple linear regression
Resistance to outliers: Robust simple linear regression
Perpendicular distance: Orthogonal regression (this is not scale-invariant i.e. changing the measurement units leads to a different line.)
Weighted geometric distance: Deming regression
Scale invariant approach: Major axis regression This allows for measurement error in both variables, and gives an equivalent equation if the measurement units are altered.
Simple linear regression without the intercept term (single regressor)
[edit]
2 notes
·
View notes
Text
Unlock the Power of Data Analysis with STAT Data Modeling Software - LabDeck's Stat Studio
In today's data-driven world, having the right tools to analyze and interpret vast amounts of data is essential for researchers, data scientists, and analysts. LabDeck’s Stat Studio stands out as a premier STAT Data Modeling Software, designed to meet the diverse needs of professionals who work with complex datasets. This robust software offers an intuitive interface combined with powerful analytical features, enabling users to perform advanced statistical modeling with ease.
Why Choose Stat Studio for Your Data Analysis Needs?
Stat Studio is more than just another statistical software; it's an all-in-one solution that helps you unlock deeper insights from your data. Here's why it's a top choice for anyone looking to elevate their data modeling capabilities:
1. Advanced Regression Analysis
One of Stat Studio's most powerful features is its regression analysis toolset. Whether you are performing basic linear regression or more complex methods, Stat Studio gives you the flexibility to choose the right model for your data. Key statistical measures, such as Mean Squared Error (MSE) and R-squared values, are automatically calculated and displayed, providing instant insight into your model's performance. This makes it easy to interpret relationships between variables, ensuring accurate and reliable results.
2. Comprehensive Data Handling
Stat Studio excels in data handling by supporting a wide range of file formats and data sources. With its flexible import options, users can seamlessly integrate and analyze datasets from various origins. Whether your data comes from spreadsheets, databases, or other statistical software, Stat Studio ensures that you can work with it efficiently.
3. Customizable Visualizations
Data visualization is an integral part of any analysis, and Stat Studio’s advanced plotting capabilities make it simple to create professional-grade charts and graphs. Users can easily generate scatter plots, line graphs, bar charts, and more, with a full range of customizable options like marker styles, line types, and color schemes. Additionally, the software allows you to overlay regression lines and add trend lines, giving your visualizations deeper analytical value.
4. Tailored Analysis and Presentation
Customization doesn’t end with visuals. Stat Studio offers extensive options to tailor every aspect of your analysis to meet specific presentation or publication requirements. You can adjust parameters for data scaling, clean your datasets, and fine-tune the presentation of your results to suit your audience, whether you are presenting to a boardroom or preparing for publication.
Advanced Features for Complex Analyses
For users who require more than just basic analysis, Stat Studio offers an array of advanced features. A dedicated “Tests” tab hints at the software’s ability to run a wide variety of statistical tests, including hypothesis testing, ANOVA, and more. These features make Stat Studio a versatile tool for users in fields like academia, market research, healthcare, and beyond.
Additionally, the software includes tools for data cleaning and scaling, which are essential for preparing large and complex datasets for accurate analysis. These pre-processing steps ensure that your data is ready for in-depth statistical modeling, leading to more reliable and meaningful results.
Conclusion: Empower Your Data with LabDeck's Stat Studio
LabDeck’s Stat Studio offers a complete package for anyone looking to perform STAT Data Modeling software. With its combination of advanced analysis features, flexible data handling, and customizable visualization options, Stat Studio is a powerful tool for both novice and experienced statisticians alike. Whether you're conducting regression analysis, creating intricate data visualizations, or preparing your data for publication, Stat Studio provides the precision, efficiency, and versatility you need to succeed.
To learn more about how Stat Studio can revolutionize your data analysis process, visit the official page here.
Embrace the power of Stat Studio and take your data modeling to new heights!
2 notes
·
View notes
Text
Machine Learning Project Ideas for Beginners

Machine Learning (ML) is no longer something linked to the future; it is nowadays innovating and reshaping every industry, from digital marketing in healthcare to automobiles. If the thought of implementing data and algorithms trials excites you, then learning Machine Learning is the most exciting thing you can embark on. But where does one go after the basics? That answer is simple- projects!
At TCCI - Tririd Computer Coaching Institute, we believe in learning through doing. Our Machine Learning courses in Ahmedabad focus on skill application so that aspiring data scientists and ML engineers can build a strong portfolio. This blog has some exciting Machine Learning project ideas for beginners to help you launch your career along with better search engine visibility.
Why Are Projects Important for an ML Beginner?
Theoretical knowledge is important, but real-learning takes place only in projects. They allow you to:
Apply Concepts: Translate algorithms and theories into tangible solutions.
Build a Portfolio: Showcase your skills to potential employers.
Develop Problem-Solving Skills: Learn to debug, iterate, and overcome challenges.
Understand the ML Workflow: Experience the end-to-end process from data collection to model deployment.
Stay Motivated: See your learning come to life!
Essential Tools for Your First ML Projects
Before you dive into the ideas, ensure you're familiar with these foundational tools:
Python: The most popular language for ML due to its vast libraries.
Jupyter Notebooks: Ideal for experimenting and presenting your code.
Libraries: NumPy (numerical operations), Pandas (data manipulation), Matplotlib/Seaborn (data visualization), Scikit-learn (core ML algorithms). For deep learning, TensorFlow or Keras are key.
Machine Learning Project Ideas for Beginners (with Learning Outcomes)
Here are some accessible project ideas that will teach you core ML concepts:
1. House Price Prediction (Regression)
Concept: Regression (output would be a continuous value).
Idea: Predict house prices based on given features, for instance, square footage, number of bedrooms, location, etc.
What you'll learn: Loading and cleaning data, EDA, feature engineering, and either linear regression or decision tree regression, followed by model evaluation with MAE, MSE, and R-squared.
Dataset: There are so many public house price datasets set available on Kaggle (e.g., Boston Housing, Ames Housing).
2. Iris Flower Classification (Classification)
Concept: Classification (predicting a categorical label).
Idea: Classify organisms among three types of Iris (setosa, versicolor, and virginica) based on sepal and petal measurements.
What you'll learn: Some basic data analysis and classification algorithms (Logistic Regression, K-Nearest Neighbors, Support Vector Machines, Decision Trees), code toward confusion matrix and accuracy score.
Dataset: It happens to be a classical dataset directly available inside Scikit-learn.
3. Spam Email Detector (Natural Language Processing - NLP)
Concept: Text Classification, NLP.
Idea: Create a model capable of classifying emails into "spam" versus "ham" (not spam).
What you'll learn: Text preprocessing techniques such as tokenization, stemming/lemmatization, stop-word removal; feature extraction from text, e.g., Bag-of-Words or TF-IDF; classification using Naive Bayes or SVM.
Dataset: The UCI Machine Learning Repository contains a few spam datasets.
4. Customer Churn Prediction (Classification)
Concept: Classification, Predictive Analytics.
Idea: Predict whether a customer will stop using a service (churn) given the usage pattern and demographics.
What you'll learn: Handling imbalanced datasets (since churn is usually rare), feature importance, applying classification algorithms (such as Random Forest or Gradient Boosting), measuring precision, recall, and F1-score.
Dataset: Several telecom-or banking-related churn datasets are available on Kaggle.
5. Movie Recommender System (Basic Collaborative Filtering)
Concept: Recommender Systems, Unsupervised Learning (for some parts) or Collaborative Filtering.
Idea: Recommend movies to a user based on their past ratings or ratings from similar users.
What you'll learn: Matrix factorization, user-item interaction data, basic collaborative filtering techniques, evaluating recommendations.
Dataset: MovieLens datasets (small or 100k version) are excellent for this.
Tips for Success with Your ML Projects
Start Small: Do not endeavor to build the Google AI in your Very First Project. Instead focus on grasping core concepts.
Understand Your Data: Spend most of your time cleaning it or performing exploratory data analysis. Garbage in, garbage out, as the data thinkers would say.
Reputable Resources: Use tutorials, online courses, and documentation (say, Scikit-learn docs).
Join Communities: Stay involved with fellow learners in forums like Kaggle or Stack Overflow or in local meetups.
Document Your Work: Comment your code and use a README for your GitHub repository describing your procedure and conclusions.
Embrace Failure: Every error is an opportunity to learn.
How TCCI - Tririd Computer Coaching Institute Can Help
Venturing into Machine Learning can be challenging and fulfilling at the same time. At TCCI, our programs in Machine Learning courses in Ahmedabad are created for beginners and aspiring professionals, in which we impart:
A Well-Defined Structure: Starting from basics of Python to various advanced ML algorithms.
Hands-On Training: Guided projects will allow you to build your portfolio, step by-step.
An Expert Mentor: Work under the guidance of full-time data scientists and ML engineers.
Real-World Case Studies: Learn about the application of ML in various industrial scenarios.
If you are considering joining a comprehensive computer classes in Ahmedabad to start a career in data science or want to pursue computer training for further specialization in Machine Learning, TCCI is the place to be.
Are You Ready to Build Your First Machine Learning Project?
The most effective way to learn Machine Learning is to apply it. Try out these beginner-friendly projects and watch your skills expand.
Contact us
Location: Bopal & Iskcon-Ambli in Ahmedabad, Gujarat
Call now on +91 9825618292
Visit Our Website: http://tccicomputercoaching.com/
0 notes
Text
Master Probability, Regression & More with an Expert Online Statistics Tutor
Probability, regression analysis, and data modeling are key concepts in statistics that often trip up even the brightest students. If you’re struggling with these, a qualified Online Statistics Tutor can help you master them with step-by-step support.
At My Engineering Buddy, each session is customized. Tutors walk you through problems using practical, easy-to-understand methods while also connecting concepts to real-life applications. This helps build a deeper understanding and stronger retention of knowledge.
Their approach focuses on clarity and application rather than rote memorization. Whether it’s simple linear regression or advanced inferential techniques, you’ll learn how to interpret and analyze data like a pro.
You’ll also get access to downloadable materials, practice questions, and homework support to ensure you’re constantly improving. Tutors assess your progress and adapt their strategy accordingly for best results.
Don’t just learn—master the subject with a professional Online Statistics Tutor: https://www.myengineeringbuddy.com/online-tutoring/online-statistics-tutor/
0 notes
Text
Did R0 go up?
R0, which is the reproductive number, is a measure of how fast a virus replicates. Reducing the risk of infection and transmission both lower R0 leading to lower peaks and a longer infection time which doesn’t overwhelm medical care. That was the goal of these shots.
Here’s your answer, courtesy of Israel, one of the most vaccinated places on earth.
A spike like the one above to 60,000 cases per million people is a clear signal that means R0 was increased relative to the 75% vaccinated US.
The slope and the height are dead giveaways of a higher R0.
There is no hiding from this data. It’s been in plain sight for years if anyone looks.
How R0 affects the shape of a virus outbreak
As the Israel data clearly shows, R0 was increased by heavy vaccination.
Because the infection fatality rate went up too as I showed earlier by looking at case fatality rates (CFR) in the nursing home before vs. after vaccine rollout (a “longitudinal analysis”), all these countries KILLED people.This is how a virus spreads. The higher R0, the higher the peak, the more people who are infected and the sharper the shape. This is why the Omicron spike in Israel was a crystal clear signal that the vaccine increased R0. Israel should have had the flattest curve in the world if the vaccine worked.
Other studies
The Cleveland Clinic (CC) study and the second CC study showed the vaccines increased your risk of contracting COVID. Other studies found the same effect: here, here, here, here, here, here, here.
A new Japan study confirmed the CC results that more vaccines→more cases: “The odds of contracting COVID-19 increased with the number of vaccine doses: one to two doses (OR: 1.63, 95% CI: 1.08-2.46, p = 0.020), three to four doses (OR: 2.04, 95% CI: 1.35-3.08, p = 0.001), and five to seven doses (OR: 2.21, 95% CI: 1.07-4.56, p = 0.033).” This is consistent with Table 2 in the CC study.
I’ve done simple linear regression on the US data as well and the slopes are all positive (meaning it increases your risk of getting infected).
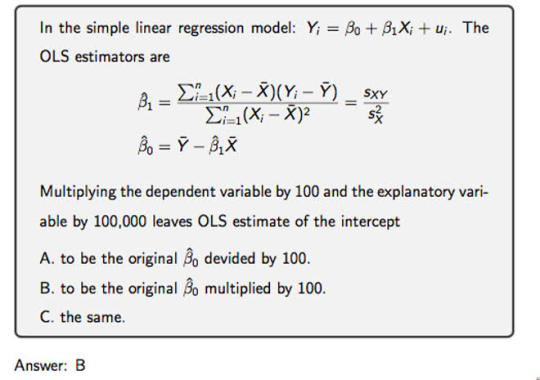
The answer to the poll was B
Choice B was the data from all the sites in the least 5 highly vaccinated states in the US. The peaks are lower.
You can click each image to see the states included in the image.
Summary
The Phase 3 clinical trials were a fraud.
Your government lied to you.
The wastewater data is dispositive: the vaccine did not lower R0. If anything, it increased it as you can clearly see from the Israel data. If the vaccine worked, they wouldn’t have the highest peak in the world; they’d have the lowest.
Isn’t it great what you can learn if you can read the wastewater tea leaves?
Now you know why all the health authorities avoid this topic.
6 notes
·
View notes
Text
Machine Learning for Beginners: Best Classroom & Online Courses in Chennai
In the era of automation and data-driven decision-making, Machine Learning (ML) has evolved from a niche skill to a mainstream career path. Whether you're a recent graduate, a software engineer looking to upskill, or a non-tech professional transitioning into data science, starting with the right Machine Learning Course in Chennai can make a significant difference.
This article is your go-to guide for understanding what Machine Learning entails for beginners and where you can find the best classroom and online ML courses in Chennai to kick-start your journey in 2025.
What is Machine Learning?
Machine Learning is a subset of Artificial Intelligence that enables systems to learn patterns from data and improve over time without being explicitly programmed. In simple terms, it’s the technology behind recommendation engines (like Netflix), virtual assistants (like Siri), fraud detection, chatbots, self-driving cars, and much more.
Is Machine Learning Right for Beginners?
Absolutely. Many beginners assume Machine Learning is too complex to grasp without a PhD in computer science. But thanks to modern teaching techniques and structured beginner-friendly courses, anyone with basic programming knowledge and logical thinking can learn ML.
Ideal for:
Fresh graduates in CS, IT, or Math
Working professionals with analytical roles
Career switchers from non-tech backgrounds
Entrepreneurs or managers wanting to understand ML for business growth
Why Choose a Machine Learning Course in Chennai?
Chennai, one of India’s top IT and education hubs, offers a vibrant ecosystem for learning and applying Machine Learning.
Here’s why Chennai is a great choice:
Access to experienced faculty and industry mentors
Availability of both classroom and online training
Proximity to tech companies hiring for ML roles
Budget-friendly, high-quality education compared to metros like Bengaluru
Best Classroom Machine Learning Courses in Chennai
For those who prefer structured learning, real-time interaction, and hands-on mentorship, classroom training is ideal.
1. Boston Institute of Analytics – Machine Learning Certification Course
Why it stands out:
Beginner-friendly curriculum
Focus on hands-on projects and real-world datasets
Weekday and weekend classroom batches available
Certification recognized by industry employers
Modules Covered:
Python for ML
Supervised & Unsupervised Learning
Model Building & Evaluation
Capstone Project with Placement Assistance
Duration: 3–6 months Ideal for: Freshers, working professionals, and career switchers
What You’ll Learn as a Beginner?
A well-designed Machine Learning Course in Chennai for beginners usually includes:
Foundations of Python Programming
Data Preprocessing & Cleaning
Exploratory Data Analysis
Supervised Learning (Linear Regression, Decision Trees)
Unsupervised Learning (K-Means, PCA)
Model Evaluation Techniques
Mini-projects & Real-Time Datasets
Advanced topics like neural networks, NLP, and deep learning may be introduced at a later stage.
Career Opportunities After an ML Course in Chennai
Machine Learning (ML) is transforming industries worldwide, and Chennai is emerging as a major tech hub in India. Completing an ML course in Chennai can open the door to a wide range of career opportunities across various domains. Whether you're a fresh graduate or an experienced professional, acquiring ML skills can significantly enhance your career trajectory.
1. Data Scientist
One of the most in-demand roles, a Data Scientist uses ML algorithms to analyze and interpret complex data. Companies in Chennai, especially in sectors like fintech, healthcare, and e-commerce, are hiring data scientists to drive data-driven decision-making. ML skills are essential for building predictive models, natural language processing, and computer vision systems.
2. Machine Learning Engineer
This role focuses on designing, building, and deploying ML models into production. ML engineers need a strong foundation in programming, mathematics, and ML theory. Tech companies, research labs, and startups in Chennai offer lucrative roles for professionals who can create scalable ML systems.
3. AI/ML Researcher
For those interested in academic or cutting-edge research, becoming an AI/ML researcher is a viable path. Institutions like IIT Madras and companies with R&D wings are actively investing in AI research. This role involves publishing papers, developing novel algorithms, and contributing to open-source ML projects.
4. Business Intelligence Analyst
Chennai's growing corporate landscape requires BI analysts who can use ML to enhance reporting and forecasting. With ML, BI analysts can uncover hidden trends and offer more accurate insights. Sectors such as banking, logistics, and retail frequently hire professionals with ML skills.
5. AI Product Manager
If you have a mix of technical and managerial skills, becoming an AI Product Manager could be ideal. In this role, you bridge the gap between technical teams and business stakeholders, defining product strategies based on AI and ML capabilities.
6. Freelancer or Consultant
Chennai's vibrant startup ecosystem offers opportunities for freelance ML experts or consultants. You can work on diverse projects ranging from chatbot development to predictive maintenance solutions.
Final Thoughts
Whether you choose a classroom course or an online one, starting your journey in Machine Learning as a beginner in Chennai is a smart and future-proof decision. The city offers the perfect combination of quality education, tech exposure, and career opportunities.
By enrolling in a top-rated Machine Learning Course in Chennai, you're not just learning algorithms—you’re building the foundation for a high-impact career in data science, AI, and intelligent automation.
#Best Data Science Courses in Chennai#Artificial Intelligence Course in Chennai#Data Scientist Course in Chennai#Machine Learning Course in Chennai
0 notes
Text
Master Data Like a Pro: Enroll in the 2025 R Programming Bootcamp for Absolute Beginners!!

Are you curious about how companies turn numbers into real-world decisions? Have you ever looked at graphs or reports and wondered how people make sense of so much data?
If that sounds like you, then you’re about to discover something that could completely change the way you think about numbers — and your career. Introducing the 2025 R Programming Bootcamp for Absolute Beginners: your all-in-one launchpad into the exciting world of data science and analytics.
This isn’t just another course. It’s a bootcamp built from the ground up to help beginners like you master R programming — the language trusted by data scientists, statisticians, and analysts across the world.
Let’s break it down and see what makes this course the go-to starting point for your R journey in 2025.
Why Learn R Programming in 2025?
Before we dive into the bootcamp itself, let’s answer the big question: Why R?
Here’s what makes R worth learning in 2025:
Data is the new oil — and R is your refinery.
It’s free and open-source, meaning no costly software licenses.
R is purpose-built for data analysis, unlike general-purpose languages.
It’s widely used in academia, government, and corporate settings.
With the rise of AI, data literacy is no longer optional — it’s essential.
In short: R is not going anywhere. In fact, it’s only growing in demand.
Whether you want to become a data scientist, automate your reports, analyze customer trends, or even enter into machine learning, R is one of the best tools you can have under your belt.
What Makes This R Bootcamp a Perfect Fit for Beginners?
There are plenty of R programming tutorials out there. So why should you choose the 2025 R Programming Bootcamp for Absolute Beginners?
Because this bootcamp is built with you in mind — the total beginner.
✅ No coding experience? No problem. This course assumes zero background in programming. It starts from the very basics and gradually builds your skills.
✅ Hands-on learning. You won’t just be watching videos. You’ll be coding along with real exercises and practical projects.
✅ Step-by-step explanations. Every topic is broken down into easy-to-understand segments so you’re never lost or overwhelmed.
✅ Real-world applications. From day one, you’ll work with real data and solve meaningful problems — just like a real data analyst would.
✅ Lifetime access & updates. Once you enroll, you get lifetime access to the course, including any future updates or new content added in 2025 and beyond.
Here's What You'll Learn in This R Bootcamp
Let’s take a sneak peek at what you’ll walk away with:
1. The Foundations of R
Installing R and RStudio
Understanding variables, data types, and basic operators
Writing your first R script
2. Data Structures in R
Vectors, matrices, lists, and data frames
Indexing and subsetting data
Data importing and exporting (CSV, Excel, JSON, etc.)
3. Data Manipulation Made Easy
Using dplyr to filter, select, arrange, and group data
Transforming messy datasets into clean, analysis-ready formats
4. Data Visualization with ggplot2
Creating stunning bar plots, line charts, histograms, and more
Customizing themes, labels, and layouts
Communicating insights visually
5. Exploratory Data Analysis (EDA)
Finding patterns and trends
Generating summary statistics
Building intuition from data
6. Basic Statistics & Data Modeling
Mean, median, standard deviation, correlation
Simple linear regression
Introduction to classification models
7. Bonus Projects
Build dashboards
Analyze customer behavior
Create a mini machine-learning pipeline
And don’t worry — everything is taught in plain English with real-world examples and analogies. This is not just learning to code; it’s learning to think like a data professional.
Who Should Take This Course?
If you’re still wondering whether this bootcamp is right for you, let’s settle that.
You should definitely sign up if you are:
✅ A student looking to boost your resume with data skills ✅ A career switcher wanting to break into analytics or data science ✅ A marketer or business professional aiming to make data-driven decisions ✅ A freelancer wanting to add analytics to your skill set ✅ Or just someone who loves to learn and try something new
In short: if you’re a curious beginner who wants to learn R the right way — this course was made for you.
Real Success Stories from Learners Like You
Don’t just take our word for it. Thousands of beginners just like you have taken this course and found incredible value.
"I had zero background in programming or data analysis, but this course made everything click. The instructor was clear, patient, and made even the complicated stuff feel simple. Highly recommend!" — ★★★★★ "I used this bootcamp to prepare for my first data internship, and guess what? I landed the role! The hands-on projects made all the difference." — ★★★★★
How R Programming Can Transform Your Career in 2025
Here’s where things get really exciting.
With R under your belt, here are just a few of the opportunities that open up for you:
Data Analyst (average salary: $65K–$85K)
Business Intelligence Analyst
Market Researcher
Healthcare Data Specialist
Machine Learning Assistant or Intern
And here’s the kicker: even if you don’t want a full-time data job, just knowing how to work with data makes you more valuable in almost any field.
In 2025 and beyond, data skills are the new power skills.
Why Choose This Bootcamp Over Others?
It’s easy to get lost in a sea of online courses. But the 2025 R Programming Bootcamp for Absolute Beginners stands out for a few key reasons:
Updated content for 2025 standards and tools
Beginner-first mindset — no jargon, no skipping steps
Interactive practice with feedback
Community support and Q&A access
Certificate of completion to boost your resume or LinkedIn profile
This isn’t just a video series — it’s a true bootcamp experience, minus the high cost.
Common Myths About Learning R (and Why They’re Wrong)
Let’s bust some myths, shall we?
Myth #1: R is too hard for beginners. Truth: This bootcamp breaks everything down step by step. If you can use Excel, you can learn R.
Myth #2: You need a math background. Truth: While math helps, the course teaches everything you need to know without expecting you to be a math whiz.
Myth #3: It takes months to learn R. Truth: With the right structure (like this bootcamp), you can go from beginner to confident in just a few weeks of part-time study.
Myth #4: Python is better than R. Truth: R excels in statistics, visualization, and reporting — especially in academia and research.
Learning on Your Own Terms
Another great thing about this course?
You can learn at your own pace.
Pause, rewind, or skip ahead — it’s your journey.
No deadlines, no pressure.
Plus, you’ll gain access to downloadable resources, cheat sheets, and quizzes to reinforce your learning.
Whether you have 20 minutes a day or 2 hours, the course fits into your schedule — not the other way around.
Final Thoughts: The Best Time to Start Is Now
If you’ve been waiting for a sign to start learning data skills — this is it.
The 2025 R Programming Bootcamp for Absolute Beginners is not just a course. It’s a launchpad for your data journey, your career, and your confidence.
You don’t need a background in coding. You don’t need to be a math genius. You just need curiosity, commitment, and a little bit of time.
So go ahead — take that first step. Because in a world where data rules everything, learning R might just be the smartest move you make this year.
0 notes
Text
Pushing Past the Competence Ceiling
I’ve been programming for a few years now, and I wonder if this is a common thing, or if this is just me getting a little burnt out.
I started learning to program after living with a Chemical Engineer and a Computer Systems Engineer. Pursuing a dual degree in Geography and Political Science, I would often joke about how I was the “only scientist around.” My training in Political Science was the same as I understand many experiences are at a state school. I realized that I was getting drawn more and more to quantitative work in political geography (stuff by Ron Johnston & John O’Loughlin stands out as initial passions). But, I felt that there was more quantitative modelling that could be done. I was vaguely aware of Simon Jackman’s work, but I didn’t have the quantitative skills to handle it.
This was partially because I spent all of my Political Statistics class making jokes with a close friend. But, that class was also bunk, and I think the teacher (herself a very knowledgeable prof), knew it. The point was to credential the student in basic statistics, which I’d understood since high school. There was no way I could walk out of that course and understand hierarchical linear modelling, or generalized linear regression. To make things worse, after talking with my roommates, I realized that there was no way that I could solve the math problems I wanted to solve by manually entering data into the TI-83 I used in that intro statistics course.
And, at some point it dawned on me: my undergraduate training in statistics gave me tools and skills useful to solve problems that weren’t applicable or interesting to me. Indeed, the tools and skills it gave me were those that could never actually solve the applicable or interesting problems...
That was tough.
Dejected, I wandered around the internet, through a few IRC channels, and ended up starting to learn Haskell. I also started getting into spatial Operations Research in geography, really hitting linear algebra and some basic vector calculus on the way. But, I couldn’t do what I wanted to do in Haskell (or the LP-solvers I started using). The ecosystem for spatial data analysis wasn’t there. I loved using it, but it was way too much work to get to the point where there were things I could use it on.
I ping around R and Python now, mostly trying to keep engaged with the cutting edge, as the furrow I till as an academic gets deeper and narrower. But, that core idea never really left: we should strive to teach undergraduates using tools that are capable of solving the problems they’re interested in—no toy environments, no “at this level, it’s simple enough to do in Excel.”
It’s not quite the two-language problem, but it kind of is---academics have an ethical obligation to students (and society) to teach open, free, and accessible frameworks that are capable of solving real-world problems. No toys, no "the first hit is free."
0 notes
Text
10 Job-Ready Projects You Should Complete After Taking a Machine Learning Course

Beginner machine learning projects are a necessary part of your machine learning portfolio. If you want to pursue a career in machine learning, it's important that you prepare your portfolio first.
It's the first step toward impressing potential employers who might hire you in your desired job role.
10 Beginner Machine Learning Projects
In this article, we have listed ten machine learning courses for beginners. You can complete these projects on your own and get ready for your potential employer to hire you.
1. Kaggle Titanic Prediction
If you want to take on beginner machine learning projects right after completing your machine learning course, you can start with Kaggle Titanic Prediction. The project is available at Kaggle Titanic.
This project has a dataset about the passengers who were travelling on the Titanic. The data set includes different information like the age, cabin, ticket fare, and gender of each of the passengers travelling.
The data set presents a simple binary classification problem. The learner has to predict the particular passenger who survived the crash.
2. House Price Prediction
House prices data is a great course to start with. If you're looking for beginner machine learning projects, you can try this dataset available at Kaggle. The price of a specific house is the target variable of this project.
As a machine learning expert, you'll have to predict information such as house area, number of bedrooms, number of bathrooms, and utilities, which are some of the data. It's a regression problem where you can use linear regression to create the model. You can also take other advanced approaches if you want to.
3. Wine Quality Prediction
When taking machine learning portfolio projects for beginners, it's best to go with popular projects that include fixed and volatile acidity, alcohol, and density to predict the quality of red wine.
You can treat this as a regression or classification problem. The quality variable you must predict inside the dataset ranges between 0 and 10. So you must build a regression model for prediction.
On the other hand, you can take another project and build a regression model for prediction. You can also take another approach to break down the values into discrete intervals and then convert them into diverse variables.
4. Heart Disease Prediction
When looking for beginner machine learning projects, you can start with Heart Disease Predictions. It's a dataset that is used to predict the 10-year risk of CHD.
The risk factors of heart disease in this dataset are the dependent variables. These things include heart disease, diabetes, smoking, high blood pressure, high cholesterol levels, etc.
5. MNIST Digit Classification
Machine learning enthusiasts who want to take on deep learning after finishing their course can try the MNIST dataset.
This is a dataset with grayscale images of handwritten numbers from 0 to 9. If you complete this task, your task will be to identify the digit using a deep learning algorithm. This is a multi-class classification problem with ten different output classes. You can also use CNN to perform this classification.
The MNIST dataset is prepared in Python inside the Keras library. You'll only have to install Kera's to get started with this.
6. Stock Price Prediction Model
If you were looking for real-world machine learning examples you can use for things like stock price prediction, try this one. You can predict stock prices based on historical data and other market indicators present in the course.
It's a challenging area due to the volatility and unpredictability of financial markets in stocks if you want to start a stock market analysis. This machine learning project will also teach you how to predict investment directions.
7. Fraud Detection
The fraud detection course is a beginner machine learning course. There, you'll have to identify fraudulent activities in different domains. You'll find these activities in the insurance claims, online servies, and several different types of card transactions.
8. Recommendation System
Another worth mentioning beginner-friendly machine learning project is the idea recommendation system. Here you'll have to use recommendation systems.
These are algorithms suggesting relevant items to different consumers/users (such as books, movies, and products). These are widely used in e-commerce and entertainment platforms.
9. Fake News Detection
Machine learning resume projects that really make you stand out during job hunts are like these ones. The fake news detection project is a Recommendation system.
These are based on the preferences and past behaviors of the creators. These are widely used in e-commerce platforms and for entertainment as well.
10. Write an ML algorithm from Scratch
Many learners are interested in job-ready ML projects with code. If that's what you're looking for, start with this ML project.
You can start coding a machine learning project where you'll also learn about different tools, along with a good understanding of translating mathematical instructions into working code.
Conclusion
Whether starting out or already finished your first year in the industry, these projects are among the best machine learning works you can start with. Also, most are beginner-friendly.
So, you don't have to worry much about struggling with finishing these projects. These are also easy to self-assess. So, you'll have extra confidence in completing something substantial.
0 notes
Text
Beginner’s Guide to Data Science: What You’ll Learn at Advanto
If you're looking to break into the world of data, the Data Science Course in Pune offered by Advanto Software is your perfect starting point. Designed for complete beginners and career-switchers, this course equips you with all the essential skills needed to thrive in today’s data-driven world.
In this beginner’s guide, we'll walk you through what data science really is, why it matters, and most importantly, what you’ll learn at Advanto that makes our course stand out in Pune’s competitive tech landscape.
What is Data Science?
Data Science is the art and science of using data to drive decision-making. It involves collecting, cleaning, analyzing, and interpreting data to uncover patterns and insights that can help businesses make smarter decisions. From predicting customer behavior to optimizing supply chains, data science is everywhere.
If you're fascinated by numbers, patterns, and technology, then a Data Science Course in Pune is a fantastic career move.
Why Choose Advanto for Your Data Science Training?
At Advanto, we believe in practical learning. Our Data Science Course in Pune combines theoretical foundations with hands-on experience so that students don’t just learn — they apply. Whether you're from a coding background or completely new to tech, our structured modules and expert mentors help you build skills step by step.
Key Topics You’ll Learn in the Data Science Course at Advanto
Here’s a breakdown of the essential concepts covered in our program:
1. Python Programming
Python is the backbone of modern data science. You'll learn:
Variables, loops, and functions
Data structures like lists, tuples, and dictionaries
Libraries like NumPy, Pandas, and Matplotlib
By the end of this module, you'll be able to write scripts that automate data analysis tasks efficiently.
2. Statistics and Probability
Understanding the math behind data science is crucial. Our course simplifies:
Descriptive statistics
Inferential statistics
Probability distributions
Hypothesis testing
This foundation helps in making sense of real-world data and building predictive models.
3. Machine Learning
Here, you’ll explore how machines can learn from data using algorithms. The course covers:
Supervised and unsupervised learning
Algorithms like Linear Regression, Decision Trees, and K-Means
Model evaluation and tuning
You’ll build your first ML models and see them in action!
4. Data Visualization
Data is only as good as how you present it. Learn to use:
Matplotlib, Seaborn, and Plotly
Dashboards using Power BI or Tableau
Storytelling with data
You’ll turn complex datasets into simple, interactive visuals.
5. SQL and Databases
Learn how to work with structured data using:
SQL queries (SELECT, JOIN, GROUP BY, etc.)
Database design and normalization
Connecting SQL with Python
This is an essential skill for every data scientist.
6. Capstone Projects and Real-world Use Cases
At the end of your Data Science Course in Pune, you’ll work on real industry projects. Whether it’s predicting house prices, customer churn, or sales forecasting — your portfolio will show employers what you’re capable of.
Career Support and Certification
Our job-ready curriculum is backed by placement assistance, resume workshops, and mock interviews. Once you complete the course, you’ll receive a globally recognized certification that adds weight to your resume.
Who Can Enroll?
Our course is beginner-friendly, and anyone can join:
College students
Working professionals
Engineers and IT professionals
Career switchers
Whether you're in marketing, finance, or HR, learning data science opens new career opportunities.
Why Data Science is the Future
Data Science isn't just a trend — it’s the future. With industries increasingly relying on data, the demand for skilled professionals is skyrocketing. Pune, being a major tech hub, offers vast opportunities in this space. That’s why enrolling in a Data Science Course in Pune now can fast-track your career.
Conclusion: Take Your First Step with Advanto
The Data Science Course in Pune at Advanto Software is more than just a training program — it’s a career-launching experience. With expert faculty, hands-on projects, and strong placement support, Advanto is the right place to begin your journey into the exciting world of data science.
Visit Advanto Software to learn more and enroll today. Don’t just learn data science — live it with Advanto.
#best software testing institute in pune#classes for data science#software testing classes in pune#advanto software#data science and analytics courses#full stack web development#software testing courses in pune#software testing training in pune#software testing course with job guarantee#data science course in pune
1 note
·
View note