#sp: 1.06
Photo


JI CHANG WOOK as NOH JI WOOK
SUSPICIOUS PARTNER 수상한 파트너 (2017)
#kdramaedit#kdramadaily#kdramasource#ji chang wook#suspicious partner#kdrama#ji changwook#sp: 1.06#.gif#me: i am not going to gif#him: *puts on glasses*#me: ok i'll gif
437 notes
·
View notes
Text
hew quick question who still leads the league in points per game? i'm just curious
#[the only thing that makes me feel better]#1.06 bitches 1.06 points per game#i'll give you a hint it doesn't start with sp and end with ooner#oh and sorry who leads the top 3 points leaders in +/- [by a substantial amount] im just curious#say it one more time for me thank you#we're getting a little specific i'll give you that but i will never stop doing this type of thing
1 note
·
View note
Photo


SHADOW BONE APPRECIATION WEEK
↳ day 2: favorite episode → 1.06 (in | sp)
#shadow and bone#sabweek#dailyshadowandbone#sabedit#shadowandboneedit#userbecca#usermarcy#usernums#userfleur#userhella#tuserssam#underbetelgeuse#tusersammy#usermoira#usergeo#userlyra#bbelcher#userkd#**#sab*
404 notes
·
View notes
Text
Regal Pest Control Co. - Strategic Management Paper (part 2)
b. STRATEGIC POSITION AND ACTION EVALUATION MATRIX
The matching tool Strategic Position and Action Evaluation (SPACE) Matrix is a four-quadrant framework that suggests which strategies are most appropriate for the organization or company. This matrix indicates whether the organization should implement defensive, aggressive, conservative, or competitive strategies. The first quadrant is aggressive, the second quadrant is conservative, the third quadrant is defensive, and the fourth quadrant is competitive. The axes of this matrix represent two dimensions in the internal strategic position and two dimensions in the external strategic position. The Financial Position (FP) and Competitive Position (CP) belong to the internal strategic position, while the Stability Position (SP) and Industry Position (IP) belong to the external strategic position. These factors are the most critical determinants of the company or organization’s overall strategic position (David & David, 2017).


x-axis: (IP + CP) y-axis: (FP+SP)
3.57 + (-2.71) 3.38 + (-4.44)
x-axis = 0.86 y-axis = -1.06
After selecting variables that will fall under FP, CP, IP, and SP, a numerical value must be assigned to each variable depending on the comparison of Regal Pest Control Company to its competitors and Pest Control Industries to other industries. Next is to find the average of each position. To determine the coordinates that will be plotted, find the x-axis: add the average of industry position and competitive position. To find the y-axis: add the average of financial position and stability position.

Strategic Position and Action Evaluation Matrix Analysis
The value calculated for the x-axis is 0.86, and for the y-axis, it is -1.06. Plotting the coordinates to the cartesian plane, the accumulated result is that the directional vector falls in quadrant IV, meaning that Regal Pest Control Company must consider competitive strategies. Being situated in quadrant IV means that Regal Pest Control Company competes reasonably well in a quite unstable industry. Therefore, the strategies the company must consider are market penetration, market development, product development, and horizontal, backward, and forward integration.
c. GRAND STRATEGY MATRIX
The Grand Strategy Matrix Analysis is a famous instrument for creating alternative strategies for either small or large companies (Johnston, n.d.). The analysis will be based on the strengths and weaknesses data of the Regal Pest Control Company, where it would help determine the standing of the company, whether its market is rapidly or slowly growing, and also to know a competitive position. With this, the company would learn the appropriate alternative strategies and help them improve and boost the company’s overall operations.

Grand Strategy Matrix Analysis
Based on the figure shown above, the Regal Pest Control Company is situated in Quadrant II, which signifies that the company is in rapid market growth but has a weak competitive position. Although the company has maintained its financial stability and management, it must also work on its competitive edge, particularly in advertising its products and services and increasing market share. To establish a solid competitive position, they must consider adopting the strategy of market penetration, market development, product development and horizontal integration to increase market share that would help the company promote their products and services to their target market. These strategies will help Regal Pest Control to have a competitive advantage in the growing industry of Pest Control.
d. INTERNAL – EXTERNAL MATRIX
According to Strategy Hubbub (n.d.) the Internal – External Matrix is a tool that can be use by any company or firms in examining the current standing or position of the company. The result will be based on the Regal Pest Control Company's internal and external factors in creating this matrix. Moreover, this plays a pivotal role because it recommends strategies that could be very helpful for the company in planning for its future.

Internal – External Matrix Analysis
Based on the findings on the table shown in Internal Factor Evaluation Matrix (IFE) and External Factor Evaluation Matrix (EFE). The IFE falls in Cell I, which has a total weighted score of 2.68, while on the other hand, the EFE falls in Cell V, which has a total weighted score of 2.65. This exemplifies that the outcome of the total weighted scores of the IFE and EFE is described into two categories which are the Grow and Build also Hold and Maintain strategies. The strategies under Grow and Build specifically need market penetration, market development, forward and horizontal strategies that are appropriate to improve the company's growth internally and externally. On the other hand, the company is also under the Hold and Maintain; particularly the strategy underlying this division are product development and market penetration, which is suitable and would give an edge to the company.
e. STRENGTH – WEAKNESSES – OPPORTUNITIES – THREATS ANALYSIS


According to Bonnici and Galea (2015), SWOT Analysis is an analysis that assesses the business's existing strengths and weaknesses and potential opportunities and threats. Internal analysis is used to identify the business finances, skills, key competencies, and strategic advantages. The external analysis identifies business prospects and risks by examining the capabilities of rivals, the industry market, and the overall economy. There are three (3) strategies formulated: Market Penetration, Market Development, and Product Development. Market Penetration will increase the market share or Regal Pest Control by trying different marketing strategies. Market Development will help Regal pest Control in branching out and opening new stores locally to provide services more in the rural areas. Lastly, Product Development will be an essential aspect to consider because this will be used to improve the current product and services that Regal Pest Control provides. These strategies formulated while doing SWOT analysis will be used to improve the overall performance of Regal Pest Control.
INTERNAL STRENGTHS
Client relationship
Every business needs to establish a relationship with their target market because this will serve as a way to know their wants and demands. Regal Pest Control is a company that always puts the customers first and aims to make more frequent customers, the reason why all their services and products are created according to the current needs of the target market. All client relationships of Regal Pest Control are built on trust and experience.
Contract completion on time
Legal certainty is a critical component in promoting profitable business transactions. Contracts are meant to offer stable results and legal clarity to companies (Berger-Walliser et al., 2011). Regal Pest Control always provides a contract to all their business transactions especially to a service purchased by a customer. The contract will be followed, and the services are finished on the time that was written on the contract. This shows how committed Regal Pest Control is and how they built their client relationship by providing an exemplary service.
Financial Stability
Financial stability is a part of overall business stability, including cash flow management, supply of assets allowing the agency to run its operations over a long period of time, effective management of its equity and loan capital, and provision for product manufacturing (Cernavskis, n.d.). This is an essential part of a business because this will ensure that the business has the capability to stay afloat and invest in things that will improve the business. Regal Pest Control is financially stable; with this, the company can grab the opportunities and minimize the impact of unforeseen threats that Regal Pest Control may encounter.
Reliable work
All the business owners know the importance of every encounter and outcome of the services and products that were produced in the company. There are a lot of strategies that were created and implemented to achieve the level of demands of the target market. That is the purpose of all business operations, to provide and produce a reliable product and services because this will be the basis of success in a business. Regal Pest Control is a business that will always put an effort in all of its operations and strategies to provide high-quality products and services.
Product and Service portfolio
Regal Pest Control provides a product and service portfolio used when a customer personally visits the branches. This serves to showcase the products and services that Regal Pest Control provides, and all the information needed to know before purchasing. In a company, it is important to connect the demand of the customers and the company; a service and product portfolio is an example of having that connection in order for the transaction to be less hassle. This strategy is a competitive advantage of Regal Pest Control from other businesses under the pest control industry.
INTERNAL WEAKNESSES
Lack of company website
Companies like Regal pest control experience a lack of a company website that may affect their sales and relationship with their clients. In today’s generation, a business needs to adapt to the demand changes of their customers. Since the generation today is more inclined to technology, many businesses are creating their own websites to connect with the newer generation. There are a lot of benefits of having a company website, especially that it connects the company and the consumers. According to Rasli et al. (2018), consumers benefit from the price comparison, outstanding customer statistics, a broader selection of goods and services, and the convenience of shopping at any time and from anywhere. Customers will be more likely to use and be happy with an online website if they like how it works as a marketplace and the variety of products available. This only shows that Regal Pest Control may experience a decline in customers without a good quality company website.
Mode of transportation
There is no question that transportation is critical in the operation of the business, but much remains to be learned about how an efficient transportation system will increase operational productivity. According to Milewski (2013), time and time savings are crucial for businesses because they enable them to boost their competitive position by lowering costs and improving market access. Investments in transportation development will thereby increase the economic performance of businesses and, in turn, the overall business productivity. Without investing in a more advanced transportation mode, a company like Regal Pest Control may face late deliveries or service due to this problem. The workers and most especially their customers may experience a delay to Regal's services that can be the source of service problems and complaints. If this will be disregarded, then it may cause significant loss for the Regal Pest Control.
Price Competition
A company like Regal pest control has a minimal competitor in the area where the company is located. If there were no competition in the market or industry within the area, companies like Regal would neglect technological development and cost reduction efforts, especially their product and the different services that the company provides. According to Lovering (2019), selling a well-established product at a similar price to competitors is an option for small retailers who want to draw customers to their businesses. It is also essential to know who the competitor is and what they can provide to make a difference according to the consumer's wants. Regal Pest Control needs to have a strategy that will be beneficial for the company if there will be a time where the pest control industry is at its peak.
Lack of modern advertisement mode
Advertising showcases products and services. Regal pest control experience inadequate in the form of modern advertisement. They cannot pace on what is new or trend so that the company can get the same time as other companies in the same industry. If the business lacks modern advertisement, it cannot experience sales growth and cannot promote its business identity. One of the disadvantages of limited advertisement strategies is being unable to promote all the strengths and reach a new target market. According to Bashir and Malik (2010), businesses now face tremendous competition in improving the influence of their advertising to create awareness, drive their sales, and maintain the market. The most important is that advertising will help Regal Pest Control company establish its brand identity.
Limited Partnership
One of the disadvantages of a limited partnership is the extensive paperwork required upfront. It is crucial forming partnerships with different companies, especially a big company that is part of the chemical industry. This is an excellent idea for incorporating the skills and expertise of more than one individual into building a business team that would benefit a small business like Regal Pest Control. According to Ward (2020), business partnerships have many benefits as they allow capitalists to pool complementary skill sets and share start-up costs and risks. It can slow the rate in the business industry of Regal Company due to lack of partnership with others, and this can be a big problem in Regal Pest Control to gain sales, profit, and identity.
EXTERNAL OPPORTUNITIES
Increased demand for services
The principle of demand is vital to the sustainable growth of a company. Growth businesses emerge in areas of the economy where demand is increasing. Demand is a function of both price and quantity. It predicts the amount of a good that will be requested at different price points (Hofstrand, 2019). This will be an opportunity to boost the supplies and improve the services and products of the Regal Pest Control in order to achieve the demands of the customer.
Provide Online Reservations for Services
Prior to making a transaction, everybody conducts some kind of details check. The online websites necessarily entail the buyer to consciously remember something from their previous experience or values about a product from the website which guides them in completing the transaction. This is the reason why a lot of consumers seek knowledge from the website to reduce risk in the event of confusion about the result of an operation (Smith, n.d.). The value of a website in marketing applies to all aspects of Regal Pest Control’s digital marketing campaign. Any form of conversation, piece of content, or advertising that the company posts online will bring the user back to the company's website, which serves as the foundation of its digital platform.
New agreements
It is a collaborative project with shareholders that includes a vertical relationship comprising partnerships with customers and retailers and a horizontal relationship comprising lateral and internal alliances (Purnomo et al., 2018). A partnership is a collaboration between a small business and a medium or large corporation based on shared needs, power, and earnings. This generates new agreements between small businesses like Regal Pest Control and established distributor companies that will collaborate to improve both companies. This will affect Regal Pest Control because there will be some changes in how the company initially operates.
Decreased tax rate
The corporate tax rate, according to data, is perhaps the most detrimental to economic development of all the various forms of taxes. The fact that capital is highly mobile is one of the main reasons for its sensitivity to taxation. Some assets would be stifled by a higher tax rate, resulting in less capital formation and therefore less employees with lower salaries (York, 2018). The decrease in tax rate will be a big opportunity for the Regal Pest Control to make more investments, purchase updated machines and hire more employees. This action will increase the productivity rate and when productivity increases the company’s income increases. According to York (2018) higher productivity contributes to more production and, in turn, higher wages for the company.
Environment
The environment wherein the companies work is a fluid, multi-faceted system and has a lot of consequences. According to Eruemegbe (2015), The term business environment refers to everything that affects a company. It has an effect on the organization's decisions, plans, processes, and overall success. It is important to know the impact of the environment, especially with a small business like Regal Pest Control, because this will help the company generate new strategies like building new branches to broaden the target market and creating a lot of environmentally friendly options to minimize the impact of the chemicals used in the environment.
EXTERNAL THREATS
New Competitors
The threat of new entry business has a significant impact on existing businesses' ability to make a profit, and it can influence the strategic decisions of the business. A company's leading advantage is jeopardized as new entrants join a market selling the same goods or services. As a result, the possibility of potential competitors applies to a company's willingness to penetrate a market. In addition, some new competitors are very territorial, such as within the exact location or zone, where one company wants to compel other businesses to close by lowering its rates or making deals that other businesses cannot match.
Natural Disaster
Natural disasters have an effect on Regal Pest Control because they will throw a business's carefully laid plans and forecasts into disarray, whether the catastrophe is a storm, tsunami, earthquake, mudslides, or something else. Regal Pest Control models may be disrupted, workers may be unable to show up to work, and critical infrastructure or assets may be destroyed. Also, natural disasters can damage physical resources such as structures and infrastructure, and human capital, reducing a business's ability to generate.
New laws
Small companies like Regal Pest Control are expected to be less diverse and much less able to capitalize on economies of scale or reach capital markets. As a result, small companies can meet a threat and are less capable of responding to unpredictable incidents than larger businesses (Dixon et al., 2006). The cost of dealing with a certain law can be roughly equal for smaller and larger companies, putting any undue pressure on the smaller business. To regulate how Regal Pest Control works, rules and regulations have been enacted. Compliance is critical for any business, whether it likes regulations or not. Maintaining a competitive advantage requires staying on top of the rules. Failure to comply could result in fines and possible regulatory problems, causing any business to slip behind its competitors.
Increase of dollar vs. peso for materials
The growing dollar harms businesses with a significant foreign presence because they would trade in a weaker domestic currency. The effect of exchange rate fluctuations on the competition of Regal Pest Control is also possible. Importing commodities becomes more costly as the domestic currency depreciates, potentially reducing the rate of imports. This type of threat can trigger inflation, which can harm businesses who are unable to lift their own costs to keep up with increasing supply rates and employee salaries.
Increase taxes
A tax increase has an effect on a business's costs. When the government collects more taxes than it spends, discretionary revenue is reduced, and business growth is hindered. Furthermore, when an increase in Regal Pest Control tax has the same impact as an increase in costs, higher prices within the business can be passed to the customers.
f. QUANTITATIVE STRATEGIES PLANNING MATRIX
The Quantitative Strategic Planning Matrix (QSPM) is the third stage of the Strategy-Formulation Analytical Framework known as the Decision Stage. This matrix objectively evaluates and indicates which of the alternative strategies are the best. The QSPM consists of both stage 1 and stage 2 of the Strategy-Formulation Analytical Framework, meaning the key external opportunities and threats and the internal strengths and weaknesses from stage 1 or the input stage are listed in the columns along with their weight. The alternative strategies that are resulted from the matching stage or second stage will be examined or analysed to determine which of the alternative strategies are the best or most attractive (David & David, 2017).


Based on the Quantitative Strategic Planning Matrix or QSPM, the market penetration strategy has a Sum Total Attractiveness Score (STAS) of 6.12, market development has 6.72, and product development has 6.96. This indicates that product development strategy has the highest score; therefore, it is the best, most attractive, or more desirable to be implemented. On the other hand, market development’s score came in second, but it is still high, and near the highest score, the reason why it can also be implemented. Therefore, the Regal Pest Control Company should implement specific strategies under product development and market development to increase the company's overall performance.
V. STRATEGY RECOMMENDATION
The following strategies below are the recommended strategies that Regal Pest Control needs to implement based on the results of conducted matrices to improve the overall performance of the company:
Strategy 1 – Market Penetration
Market penetration is a strategy that will help Regal Pest Control to broaden its business horizon by creating and implementing new marketing strategies. Regal Pest Control is a small company, and compared to its competitors, and it lacks proper promotion of their services and products that the company provides. It is best for Regal Pest Control to implement market penetration strategies such as creating an official website to establish a virtual business identity, develop connections to advertising company as well as hiring a famous person in order to help the business promotion to a broader set of audience, and it is also best to create promo bundle service where it will help the business attract new customers and increase the market position of the company.
Strategy 2 – Market Development
Regal Pest Control is a company operating primarily in Metro Manila. It needs to implement market development because this is a strategy that will help the company introduce its products and services to a new business environment. The first step that the Regal Pest Control should do is to branch out outside Metro Manila; creating more store branches will increase the opportunities and expand the scope of business. It is also best for Regal Pest Control to provide an online and delivery of products to make business transactions from all over the Philippines more efficient.
Strategy 3 – Service and Product Development
Service and product development is a strategy that Regal Pest Control will need to create and improve the current products and services they have. Regal Pest Control needs to hire pest control professionals to provide more efficient work in terms of services. Having a partnership with a big chemical company will be a strength to give high-quality pest control products as well as having a more advanced machine to make the business transactions more convenient and lastly, it is best to have feedback from the people who purchased the services and products because this will be a way to know the points of strength and weaknesses that needs to improve.
VI. ACTION PLAN
Despite having a strong internal position and effective strategies, Regal Pest Control also has a lot of things to improve by implementing new strategies that will help the company acquire that competitive position in the pest control industry. These are the action plan for Regal Pest Control according to the recommended strategies:
Strategy 1 – Market Penetration
This is a strategy that is used to improve and increase the performance of small companies like Regal Pest Control by investing and involving the company in different marketing strategies. It is a strategy that entails a far more aggressive marketing campaign to reach further into its existing market and capitalize on all possible prospects for revenue growth in that market.
A. Create an official website for Regal Pest Control
In having an official website, Regal Pest Control will be able to showcase all the services and products that they offer from a wide-range audience. People today are inclined with technology and there is no doubt that with having an official website, Regal Pest Control will attract and gain more customers from different parts of the Philippines. This will also be a way to promote and have that sense of credibility because all the transactions that were made from previous customers will be shown on the official website.
B. Hire Influencers or Celebrities
Now, that there are a lot of people who were given a public platform it is best to use this as an opportunity to connect with a new target market and be able to use their platform in showcasing the services and products by Regal Pest Control. This strategy will help Regal Pest Control to attract new target markets and improve their current services and products depending on the new demands of the target market.
C. Partnership with local TV Networks
In contrast with the influencers and celebrities that were hired to promote the company, improvement in the advertising department would also boost the popularity of the company. The best possible way of advertising the company besides billboards and phone book listings is TV Advertisement through paid partnerships with TV networks in the country. This is a strategy that will attract and inform a wide scope of audience that will be beneficial to the image of Regal Pest Control.
D. Loyalty Card Reward System
Loyalty Card Reward can build the customers' loyalty to the company. Having a Loyalty Card Reward as a strategy can be beneficial to the company to ensure its continued growth of sales and increase the customer's loyalty to the company; the company can choose what best rewards they can offer, such as having additional discounts or a free product. Small companies like Regal Pest Control need this type of marketing strategy to acquire new customers while also maintaining the loyalty of their previous customers.
Strategy 2 – Market Development
It is a strategic approach intended to assist businesses in introducing new goods to the market, expanding their existing scope, or expanding use of their existing products to do new experiences through a new business environment. This is the strategy that will be used in order for Regal Pest Control to branch out from a different area especially in a destination close to the target market of the company.
A. Create new store branches outside Metro Manila
For the first 18 years of the company's existence, Regal Pest Control solely managed all of its clients in the country through its former main branch in Quezon City and when the company moved to its new main branch in Mandaluyong city the company had struggled to provide the service that the customers from other parts of the country wanted from them. This means that the creation of brand new branches outside the NCR would be a big step for the company as it will open more immense opportunities in expanding the range of services that the company would be able to provide to its valued customers. Building more store branches is the primary strategy to expand the scope of the business, especially with Regal Pest Control, because this will serve as a way to grab new target markets from different locations.
B. Online reservations and delivery of products
Regal Pest Control sells different chemicals to eradicate adverse effects of pest infestation, but they need to improve or enhance their marketing skills, such as their online reservation on their website and delivery of products. By this, it can help the company magnetize potential customers and will make the process of transaction more efficient and convenient.
Strategy 3 – Service and Product Development
It is a strategy used to explain the whole process of introducing a new product or service to the market. It is an ongoing strategy in which the entire business is searching for an opportunity as new technologies offer potential growth to businesses, allowing them to enhance their competitive position. This is a strategy that will be used to improve the current services and products that Regal Pest Control provides.
A. Hiring pest control professionals
Hiring pest control professionals during the company's expansion is essential not only to increase the workforce of the company but also to provide a much better and efficient service to the company's customers. This would also increase the number of services that the company would be able to accommodate at a short amount of time during a given time period.
B. Investing to new technology
All the things that we are using today are a product of technological breakthroughs. In fact, today's world is somewhat dependent on the things created by these technological advancements. A small company like Regal Pest Control needs to invest in technology because it will make the service and production more efficient and will serve as a way to increase the production rate of the company.
C. Feedback System
A company needs to know the wants and needs of their target in order for the company to know their next strategies. A feedback system is a strategy that can be beneficial for the company and the customers because, at the end of every purchase the customer is required to send feedback according to their experience in the company. In this way, the customer can share their opinions and be able to acquire their demand for their future transaction with Regal Pest Control. As for the company, this strategy will be a manual for them to know their strengths and weaknesses and implement strategies that will solve the concerns.
D. Partnership with International chemical suppliers
Regal Pest Control has provided an environmentally sustainable chemical product for a long time, but the services and goods offered by the company must improve. It is beneficial for a small business like Regal Pest Control to form a relationship with an international chemical supplier in order to offer an advanced and good quality product, provide better services, increase sales and market share. Collaborating or partnering with foreign suppliers will help the company become more well-known, gain and attract a larger market.
VII. CONCLUSION
The following results have been drawn based on the mathematical outcomes of the various matrices:
Based on the Internal Factor Evaluation Matrix or the IFE Matrix, Regal Pest Control has a rating of 2.68. It scored above average on the IFE Matrix, indicating that it has a decent reputation and a solid internal standing. Nonetheless, this demonstrates that there is still more need for development to strengthen and adequately function without drawbacks. In the External Factor Evaluation Matrix or the EFE Matrix, Regal Pest Control earned a combined weighted score of 2.65. This shows that the company's response significantly affects its current opportunities and threats in the pest control market.
Based on the CPM or Competitive Profile Matrix, Regal Pest Control Company received a weighted score of 2.96, Entech Philippines received a weighted score of 3.67, and TermaxPro Pest Control Services received a weighted score of 3.69. Regal Pest Control Company should boost its strategic advantage and make additional adjustments for factors with low ratings to stay competitive in the future. This is important for the company to keep operating and compete in the pest control industry market.
In the Boston Consulting Group Matrix or the BCG Matrix, Regal Pest Control has four (4) divisions: Termite Control Services, Pest and Termite Control Chemicals and Equipment, Non-Structural Account, and Structural Account. Division 1 or the Termite Control Services and division 2 or the Pest Control Products are situated in the stars quadrant, showing a high relative market share and a high industry growth rate. While divisions 3 and 4 or the non-structural account and structural account are both on the question marks quadrant, which explains that both divisions have a low relative market share position, yet they compete in a high-growth industry.
In the SPACE Matrix or Strategic Position and Action Evaluation Matrix, Regal Pest Control falls in Quadrant IV, which means that the company should consider having competitive strategies. Some strategies must be considered when a company falls in Quadrant IV, such as market penetration, market development, product development, and horizontal, backward, and forward integration. Regal Pest Control is situated in Quadrant II, which signifies that the company is in rapid market growth but has a weak competitive position based on the GSM Matrix or Grand Strategy Matrix. This shows that there should be strategies to be implemented such as market penetration, market development, and horizontal integration to increase their competitive advantage. In the Internal – External Matrix, the Regal Pest Control should implement strategies under Grow and Build such as market penetration, market development, forward and horizontal strategies. It is also essential to use market penetration which is under Hold and Maintain. These were formulated based on the position of the weighted score of both the Internal Factor Evaluation Matrix (IFE) and External Factor Evaluation Matrix (EFE).
The SWOT or Strength – Weaknesses – Opportunities – Threats Analysis formulated three (3) strategies that will benefit Regal Pest Control to improve the company's overall performance and ensure that the company will stay competitive in the pest control industry. These strategies are Market Penetration, Market Development, and Product Development. The market penetration strategy has a Sum Total Attractiveness Score (STAS) of 6.12 on the Quantitative Strategic Planning Matrix (QSPM), market development has a STAS of 6.72, and product development has a STAS of 6.96. As a result, the Regal Pest Control Company should incorporate unique product development and market development plans to improve the overall company results.
In conclusion, Regal Pest Control needs to adapt strategies under Market Penetration, Market Development, and Product Development. This includes creating an updated website with online reservations of products, new partnerships, marketing strategies, investing in new technology, hiring professionals and business systems that will help Regal Pest Control to improve and innovate the company in establishing a solid competitive position in the pest control industry.
VIII. FINANCIAL PROJECTION
The importance of Financial Projection is to know the revenue and expenses and other financial statements of the company from previous years and to project for the upcoming years on what would be the company's finances (Score, 2020). It is a vital part of developing a strategy because this will serve as a gateway to make improvements to the company and provide an allocation to different divisions of the company to strengthen the company’s position.
ACTUAL: REGAL PEST CONTROL CO. (Income Statement)
2019 2020
Service Revenue 5,811,716.69 5,927,951.02
Direct Costs 2,646,019.39 2,698,939.78
Gross Profit 3,165,697.30 3,229,011.25
Less: Administrative &
Operating expenses 2,594,027.96 2,645,908.52
Net Income Before Tax 571,669.34 583,102.73
Tax Due 171,500.81 174,930.82
Net Income After-Tax 400,168.53 408,171.91
The first table shown above is the actual financial statement of the Regal Pest Control company in the year 2019 and 2020. After-tax, the net income is the overall result of the earnings in a period of time that the company has managed to acquire after the deductions from the company's expenses. The Net Income After-Tax result from 2019 to 2020 has only 2% growth due to the Covid -19 pandemic. Since the Philippines' economy is gradually opening, small and big companies are progressively starting to operate once again in their total capacity along with safety measures.
FINANCIAL PROJECTION: REGAL PEST CONTROL CO.
2021 2022
Service Revenue 7,113,541.23 8,749,655.71
Direct Costs 3,238,727.73 3,983,635.11
Gross Profit 3,874,813.50 4,766,020.60
Less: Administrative &
Operating expenses 3,175,090.22 3,905,360.97
Net Income Before Tax 699,723.27 860,659.62
Tax Due 209,916.98 258,197.89
Net Income After-Tax 489,806.29 602,461.74
On the second table shown above is our projected financial statement for the Regal Pest Control company. In which based on the historical data of the previous years. The company would still manage to plan and project the earnings and expenses that the company could obtain from the year 2021 to 2022. And based on the result of the 2021 and 2022 net income after-tax, that increasing amount from these years would help the company decide where to allocate the earnings to invest and enhance its division, such as in marketing strategy; the company could start with developing an official website; improvements on the service of the company to operate efficiently.
I. REFERENCES
Alihodžić, S., & Burcher, C. U. (2013, September). The Guide on Factors of Election-related Violence External to Electoral Processes. International IDEA. Retrieved April 23, 2021, from https://www.idea.int/sites/default/files/tools/ERMT-Guide-on-External-Factors.pdf
Bashir, A., & Malik, N. (2010, April). Effects of Advertisement on Consumer Behavior of University Students. Research Gate. Retrieved April 19, 2021, from https://www.researchgate.net/publication/328233388_Effects_of_Advertisement_on_Consumer_Behavior_of_University_Students
Berger-Walliser, G., Bird, R. C., & Haapio, H. (2011, January). Promoting Business Success Through Contract Visualization. ResearchGate. Retrieved April 26, 2021, from https://www.researchgate.net/publication/228185535_Promoting_Business_Success_Through_Contract_Visualization
Bhattacharjee, D. & Dey, M. (2015, December). Competitive Profile Matrix: A Theoretical Review. ResearchGate. Retrieved April 23, 2021, from https://www.researchgate.net/publication/308706961_Competitive_Profile_Matrix_A_Theoretical_Review
Bonnici, T. S., & Galea, D. (2015, January). SWOT Analysis. ResearchGate. Retrieved April 20, 2021, from https://www.researchgate.net/publication/272353031_SWOT_Analysis
Boston Consulting Group (n.d) What Is The Growth Share Matrix?.Retrieved April 24, 2021, from https://www.bcg.com/about/our-history/growth-share-matrix
Bruijl, G. (2018, June 7). The Relevance of Porter’s Five Forces in Today’s Innovative and Changing Business Environment. ResearchGate. Retrieved April 19, 2021, from https://www.researchgate.net/publication/326026986_The_Relevance_of_Porter’s_Five_Forces_in_Today’s_Innovative_and_Changing_Business_Environment
Cernavskis, K. (n.d.). Financial Stability of Enterprise as the Main Precondition for sustainable development of Economy. University of Latvia. Retrieved April 26, 2021, from https://core.ac.uk/download/pdf/233177068.pdf
Cranshaw, W. (2011, July). A Review of Nuisance InvaderHousehold Pests of the United States. ResearchGate. Retrieved April 30, 2021, from https://www.researchgate.net/publication/263175657_A_Review_of_Nuisance_Invader_Household_Pests_of_the_United_States
David, F., & David, F. (2017). Strategic Management: A Competitive Advantage Approach Concepts (16th ed.) [E-book]. Pearson education Limited. Retrieved April 21, 2021, from https://pdf4pro.com/amp/view/strategic-management-sixteenth-edition-concepts-e0346.html
David, F. R. & David, F. R. (2017). Chapter 8: Strategy Generation and Selection. Strategic Management: a competitive advantage approach, concepts and cases. (16th ed., pp. 261 – 264). Pearson. Retrieved April 21, 2021, from https://pdf4pro.com/amp/view/strategic-management-sixteenth-edition-concepts-e0346.html
Dixon, L., Gates, S., Kapur, K., Seabury, S., & Talley, E. (2006, February). The Impact of Regulation and Litigation on Small Business and Entrepreneurship. RAND. Retrieved April 24, 2021, from https://www.rand.org/content/dam/rand/pubs/working_papers/2006/RAND_WR317.pdf
Entech Philippines. (2021). Total Care System. Entech. Retrieved April 25, 2021, from https://www.entech.com.ph/
Eruemegbe, G. O. (2015, November). IMPACT OF BUSINESS ENVIRONMENT ON ORGANIZATION PERFORMANCE IN NIGERIAA STUDY OF UNION BANK OF NIGERIA. European Scientific Journal. Retrieved April 22, 2021, from https://core.ac.uk/download/pdf/236409557.pdf
Ganguly, D. (n.d.). Environmental Aspects: The Basics. USDA. Retrieved April 27, 2021, from https://www.ars.usda.gov/ARSUserFiles/20320000/EMS/EnvironmentalAspectsTheBasics.pdf
Grand View Research (2019, September) Home & Garden Pesticides Market Size, Share & Trends Analysis Report By Type (Herbicides, Insecticides, Fungicides, Fumigants), By Application (Garden, Household), By Region, And Segment Forecasts, 2019 - 2025. Retrieved April 27, 2021, from https://www.grandviewresearch.com/industry-analysis/home-garden-pesticides-market
Grand View Research (2020, August) Pest Control Service Market Size, Share & Trends Analysis Report By Application (Residential, Commercial), By End Use (Insect, Termite), By Region, And Segment Forecasts, 2020 - 2027. Retrieved Retrieved April 27, 2021, from https://www.grandviewresearch.com/industry-analysis/pest-control-services-market
Hantsbarger, W. (1981, January 15). Household insect, pests characteristics and control. Mountain Scholar. Retrieved April 30, 2021, from https://mountainscholar.org/bitstream/handle/10217/182936/AEXT_ucsu206225523.pdf?sequence=1
Hofstrand, D. (2019, March). Demand. Iowa State University. Retrieved April 30, 2021, from https://www.extension.iastate.edu/agdm/wholefarm/pdf/c5-204.pdf
Johnston, K. (n.d.). How to develop a Grand Strategy Matrix. Chron. Retrieved April 30, 2021, from https://smallbusiness.chron.com/develop-grand-strategy-matrix-37514.html
Lim, J. A. (2020, September 8). The Philippine Economy During the COVID Pandemic. Ateneo de Manila University. Retrieved April 30, 2021, from http://ateneo.edu/sites/default/files/downloadable-files/ADMU%20WP%202020-16.pdf
Lovering, C. (2019, January 25). Competitive Pricing Strategy. Small Business- Chron. Retrieved April 30, 2021, from https://smallbusiness.chron.com/competitive-pricing-strategy-59220.html
Masovic, A. (2018). SOCIO-CULTURAL FACTORS AND THEIR IMPACT ON THE PERFORMANCE OF MULTINATIONAL COMPANIES. Ecoforum. Retrieved April 20, 2021, from https://core.ac.uk/download/pdf/236086764.pdf
Michigan Government. (n.d.). Define Goals and Objectives. Retrieved April 8, 2021, from https://www.michigan.gov/documents/8-pub207_60743_7.pdf
Milewski, D. (2013, January). Economic and social effects of transport development. ResearchGate. Retrieved April 18, 2021, from https://www.researchgate.net/publication/316044351_Economic_and_social_effects_of_transport_development
Purnomo, D. S., Suryana, Y., & Sari, D. (2018). THE EFFECT OF BUSINESS PARTNERSHIP AND INNOVATION MANAGEMENT TO BUSINESS PERFORMANCE OF BUSINESS UNITS OF MULTIPLAY PROVIDER IN INDONESIA. Academy of Strategic Management Journal. Retrieved April 23,2021, from https://www.abacademies.org/articles/The-effect-of-business-partnership-and-innovation-management-193-6104-17-2-202.pdf
Rasli, S., Khairi, N., Ayathuray, H., & Syafiq, M. (2018, December). THE IMPACT OF E-BUSINESS WEBSITE QUALITY ON CUSTOMER SATISFACTION.ResearchGate. Retrieved April 26, 2021, from https://www.researchgate.net/publication/329916119_THE_IMPACT_OF_E-BUSINESS_WEBSITE_QUALITY_ON_CUSTOMER_SATISFACTION
Score. (2020, February 20). Financial Projections Template. Retrieved April 28, 2021, from https://www.score.org/resource/financial-projections-template
Smith, R. (n.d.). The Impact of Online Reservation Systems: For Chain Restaurants. Scholarworks. Retrieved April 24, 2021, from https://scholarworks.umass.edu/cgi/viewcontent.cgi?article=1278&context=gradconf_hospitality
Strategy Hubbub. (n.d). Internal External Matrix. Retrieved April 30, 2020. https://www.strategyhubbub.com/our-services/bscspmt/internal-envrionment/internal-external-matrix/
Termaxpro Pest Control Services. (2021). TermaxPro Pest Control Services Philippines. TermaxPro. Retrieved April 18, 2021, from https://www.termaxpro.com/about-us-2/?fbclid=IwAR1BK5WEm2TQqvbTKZua65MpB7ttTYfUGBySBn1RI9pVC8ALFJK0-LUmipQ
Vail, K., Chandler, J., Hensley, D., & Williams, H. (2020). Managing Pests Around the Home. Institute of Agriculture. Retrieved April 26, 2021, from https://extension.tennessee.edu/publications/Documents/pb1303.pdf
Ward, S. (2020, January 29). Why Most Business Partnerships Fail (and How to Succeed). The Balanced Small Business. Retrieved April 28, 2021, from https://www.thebalancesmb.com/why-business-partnerships-fail-4107045
York, E. (2018, August). The Benefits of Cutting the Corporate Income Tax Rate. The Tax Foundation. Retrieved April 25, 2021, from https://files.taxfoundation.org/20180813165516/The-Benefits-of-Cutting-the-Corporate-Income-Tax_FF606.pdf
0 notes
Photo

Nissan GT-R NISMO: 11th Place – 2017 Motor Trend Best Driver’s Car
Last year, the Nissan GT-R R35 went through its biggest update in its nearly nine-year life to date. This year, the hardcore GT-R NISMO version gets the update. As with many previous GT-R updates, it’s a series of incremental improvements rather than a major redo. The showpiece is an updated interior featuring a new infotainment system with fewer buttons and better materials. Outside, the GT-R NISMO gets minor styling updates in the nose to improve cooling and aerodynamics. Underneath, the chassis is stiffened on all GT-Rs, and the NISMO gets extra adhesive in the bonded layers to tighten it up. It’s Best Driver’s Car week! Keep it on MotorTrend.com this week as we count down the finishing order of our contenders this year and share bonus content you’ll only find right here. Unlike the standard car, the NISMO receives no changes under the hood. Its twin-turbo V-6 continues to make 600 horsepower and 481 lb-ft of torque. The six-speed dual-clutch automatic remains, as does the sophisticated all-wheel-drive system. The brakes remain steel, and the dampers still have three modes, though the suspension tuning has been adjusted to exploit the stiffer chassis and better aero. Weighing in at 3,904 pounds, the GT-R NISMO slingshots to 60 mph in just 2.9 seconds and through the quarter mile in 11 seconds flat at 126.8 mph. Stopping from 60 mph takes 104 feet, and the tires hang on for 1.02 average lateral g on the skidpad. It needs just 22.9 seconds to lap the figure eight and does it at 0.92 average g. We Say “On at least three occasions, after an unsettling bump, the steering would not be on center despite the car going straight. It fixed itself, but it was an unusual electro-mechanical anomaly. “I started with the transmission in automatic, but it wasn’t as responsive—especially for downshifts—as I wanted, so switch to manual mode. The brakes were very good and easy to modulate. They were a bit abrupt on initial bite, but I could drag them into a corner and ease them off. This NISMO version reminded me of the very first time I drove a GT-R. It really shouldn’t be able to do the things it is doing, but it does so without fail.” – Chris Walton Read about other 2017 Best Driver’s Car contenders: Aston Martin DB11 Mazda MX-5 Miata RF McLaren 570GT “The problem with associating a car with a video game is that technology moves fast. This thing feels like a video game circa 2007—that is to say, it’s now a bit quaint. Even though it was refreshed a few years back, it still feels like a PS2 in an era of Xbox Ones. “Still, 600 hp and all-wheel drive are great ingredients for a rally-climb special, and going up 198 made it the perfect recipe. The power kept coming, and the surprisingly slow steering made it predictable in the corners. Point, squirt, shoot. “The steering was anything but predictable on the way down. In fact it was scary. At one point I was headed toward the photographers on the shoulder, and when I went to turn, the steering rack made a CLUNK and the front wheels stayed straight even though I was turning the steering wheel.” – Derek Powell “This is one of the best GT-R’s I’ve driven in a while. It still feels old and pretty dated, but it drives like a GT-R should. This is a car defined by physically improbable levels of grip. It hooks up and launches like no other and grips hard through corners—the GT-R remains a car that you just chuck into corners, mash the gas, and let the trick AWD system and tire grip sort things out. “Has some of the same issues GT-Rs have long suffered. The ride is far better than it used to be, but it’s a punishing car to drive over bumps in ways that few other cars are. Steering is heavy, but truthfully there isn’t a ton of actual feel—the feedback you get is of the car being upset by every single impact and bump in the road.” – Christian Seabaugh Randy Says “It has three issues holding it back. It’s the best handling of the GT-Rs. But it’s just not brake-capable like it ought to be. They stop pretty darn well once or twice and then immediately start getting hot. By the end of the lap, I’m worried about them. One lap, I cooled them off and did it again, but there’s a lack of precision in braking. The fade and whatever else is going on makes it difficult to enter the corners accurately. “The other issue was the throttle. It’s not linear, and it drove me nuts. Maybe it would be better out of Race mode. You want to land on the throttle like a butterfly landing on a leaf. When you first tip in, it gives you full power, and it’s this big whoosh and throws you completely off balance. To Nissan’s credit, they’re being honorable about tires, I guess—it’s more of a real street tire, but they’re leaving a lot of time on the table. They grip well, they’re just not at an R-compound level. “The car is stable. I didn’t have to correct much. It was a rotation not a snap oversteer. I love rotation. I hate snap oversteer, and that’s all about just how fast that happens. In the GT-R it doesn’t happen terribly fast. Most GT-Rs won’t rotate at all, and the NISMO does. I love that about it.” 2017 Nissan GT-R Nismo POWERTRAIN/CHASSIS DRIVETRAIN LAYOUT Front-engine, AWD ENGINE TYPE Twin-turbo 60-deg V-6, alum block/heads VALVETRAIN DOHC, 4 valves/cyl DISPLACEMENT 231.8 cu in/3,799 cc COMPRESSION RATIO 9.0:1 POWER (SAE NET) 600 hp @ 6,800 rpm TORQUE (SAE NET) 481 lb-ft @ 3,200 rpm REDLINE 7,000 rpm WEIGHT TO POWER 6.5 lb/hp TRANSMISSION 6-speed twin-clutch auto AXLE/FINAL-DRIVE RATIO 2.94:1(f); 3.70:1(r)/2.95:1 SUSPENSION, FRONT; REAR Control arms, coil springs, adj shocks, anti-roll bar; multilink, coil springs, adj shocks, anti-roll bar STEERING RATIO 15.0:1 TURNS LOCK-TO-LOCK 2.4 BRAKES, F; R 15.4-in vented, drilled disc; 15.0-in vented, drilled disc, ABS WHEELS, F;R 9.5 x 20 in; 10.5 x 20 in, forged aluminum TIRES, F;R 255/40R20 97Y; 285/34R20 100Y Dunlop SP Sport Maxx GT 600 DSST (Tread 200) DIMENSIONS WHEELBASE 109.4 in TRACK, F/R 62.6/63.0 in LENGTH x WIDTH x HEIGHT 186.0 x 74.6 x 53.9 in TURNING CIRCLE 36.6 CURB WEIGHT 3,904 lb WEIGHT DIST, F/R 55/45% SEATING CAPACITY 4 HEADROOM, F/R 38.1/26.4 in LEGROOM, F/R 44.6/26.4 in SHOULDER ROOM, F/R 54.3/50.0 in CARGO VOLUME 8.8 cu ft TEST DATA ACCELERATION TO MPH 0-30 1.2 sec 0-40 1.7 0-50 2.2 0-60 2.9 0-70 3.7 0-80 4.7 0-90 5.7 0-100 6.8 0-100-0 10.8 PASSING, 45-65 MPH 1.4 QUARTER MILE 11.0 sec @ 126.8 mph BRAKING, 60-0 MPH 104 ft LATERAL ACCELERATION 1.02 g (avg) MT FIGURE EIGHT 22.9 sec @ 0.92 g (avg) 2.2-MI ROAD COURSE LAP 1:35.01 sec TOP-GEAR REVS @ 60 MPH 2,100 rpm CONSUMER INFO BASE PRICE $176,685 PRICE AS TESTED $177,685 STABILITY/TRACTION CONTROL Yes/Yes AIRBAGS 6: Dual front, front side, front curtain BASIC WARRANTY 3 yrs/36,000 mi POWERTRAIN WARRANTY 5 yrs/60,000 mi ROADSIDE ASSISTANCE 5 yrs/60,000 mi FUEL CAPACITY 19.5 gal EPA CITY/HWY/COMB ECON 16/22/18 mpg ENERGY CONS, CITY/HWY 211/153 kW-hrs/100 miles CO2 EMISSIONS, COMB 1.06 lb/mile RECOMMENDED FUEL Unleaded premium The post Nissan GT-R NISMO: 11th Place – 2017 Motor Trend Best Driver’s Car appeared first on Motor Trend.
http://www.motortrend.com/news/nissan-gt-r-nismo-11th-place-2017-best-drivers-car/
0 notes
Photo


JI CHANG WOOK as NOH JI WOOK
SUSPICIOUS PARTNER 수상한 파트너 (2017)
#kdramaedit#kdramadaily#kdramasource#ji chang wook#suspicious partner#kdrama#ji changwook#sp: 1.06#.gif
568 notes
·
View notes
Text
New Post has been published on All about business online
New Post has been published on http://yaroreviews.info/2019/11/dow-sp-500-hit-record-closes-as-investors-digest-trade-news
Dow, S&P 500 hit record closes as investors digest trade news
NEW YORK (Reuters) – The Dow & S&P 500 notched record closing highs on Thursday as the latest signs of progress in U.S.-China trade relations relieved investors, yet a report raising fresh worries approximately the outlook for a deal limited the day’s gains.
FILE PHOTO: Traders work on the floor at the New York Stock Exchange (NYSE) in New York, U.S., November 6, 2019. REUTERS/Brendan McDermid
China said it had agreed with the United States to remove tariffs in phases, while state-owned Xinhua News Agency said Beijing was in addition considering removing restrictions on poultry imports.
But indexes pared gains in afternoon trading after a Reuters report, citing sources, said that the White House’s plan to roll back China tariffs faces internal opposition & that no final decision has been made yet.
An interim U.S.-China trade deal is expected to include a U.S. pledge to scrap tariffs scheduled for Dec. 15.
“Any kind of uncertainty there, with the market at all-time highs, & it’s effortless for traders & institutions to press the sell button & take some money off the table,” said Alan Lancz, president, Alan B. Lancz & Associates Inc, an investment advisory firm, based in Toledo, Ohio.
The latest batch of earnings offered some upbeat news.
The S&P 500 technology index .SPLRCT ended up 0.7%, with shares of Qualcomm Inc (QCOM.O) up 6.3% after it forecast current-quarter profit above analysts’ estimates.
Together with Qualcomm, other chipmakers, which have a sizeable exposure to China, in addition rose, propping the Philadelphia Semiconductor index .SOX up 0.7%.
The trade-sensitive industrials sector .SPLRCI finished up 0.2%.
The Dow Jones Industrial Average .DJI rose 182.24 points, or 0.66%, to 27,674.8, the S&P 500 .SPX gained 8.4 points, or 0.27%, to 3,085.18 & the Nasdaq Composite .IXIC added 23.89 points, or 0.28%, to 8,434.52.
The day’s gains resumed the recent record run for stocks, which have been bolstered, along with trade deal hopes, by some upbeat earnings.
“Corporate earnings, while down year over year, are better than many had expected, & that’s a plus,” said Oliver Pursche, chief market strategist of Bruderman Asset Management in New York.
Also on Thursday, Ralph Lauren Corp (RL.N) surged 14.7% after it topped second-quarter profit expectations, helped by a tighter control on expenses & strong demand for its Polo shirts & tweed jackets in China & Europe.
On the down side, Expedia Group Inc (EXPE.O) plunged 27.4% as the online travel booking company missed quarterly profit estimates.
Declining issues outnumbered advancing ones on the NYSE by a 1.06-to-1 ratio; on Nasdaq, a 1.09-to-1 ratio favored advancers.
The S&P 500 posted 54 new 52-week highs & five new lows; the Nasdaq Composite recorded 118 new highs & 85 new lows.
Volume on U.S. exchanges was 7.92 billion shares, compared with the 6.83 billion-share average for the full session over the final 20 trading days.
Additional reporting by Arjun Panchadar & Shreyashi Sanyal in Bengaluru; Editing by Shounak Dasgupta & Jonathan Oatis
Our Standards:The Thomson Reuters Trust Principles.
#affiiate marketing#article marketing#business online#businessNews#internet marketing#make money online#mobile marketing#video marketing#web marketing
0 notes
Text
As palavras mais usadas para deu no poste
deu no poste 3450000 0.25 3695767 1.07 15.24
resultado do jogo do bicho deu no poste 43000 0.06 47865 1.12 13.39
jogo do bicho deu no poste 41000 0.08 44375 1.07 9.18
o que deu no poste 26000 0.05 27036 1.05 10.76
ďeu no poste jogo do bicho de hoje 21000 21737 1.03 2.82
deu no poste hoje 20000 0.2 22382 1.14 7.68
resultado do bicho deu no poste 19000 0.07 20824 1.11 14.17
resultado deu no poste 19000 0.09 21291 1.11 7.04
deu. no poste 17000 17875 1.04 25.96
deu no poste rj 14000 0.1 15949 1.12 5.86
resultado jogo do bicho deu no poste 13000 0.15 13324 1.02 7.48
deu no poste jogo do bicho 10000 0.04 10586 1.03 7.52
que deu no poste 9500 0.04 11173 1.17 16.49
deu/no poste 4900 5212 1.06 26.39
deu no poste. 3700 4152 1.11 6.2
deu no poste resultado 3600 0.35 4310 1.2 5.76
deu no poste resultado do jogo do bicho 3500 0.1 3729 1.08 9.3
jogo de bicho deu no poste 3400 0.03 3804 1.13 10.82
deu no poste sp 3000 0. 3661 1.2 3.21
resultado do jogo do bicho deu no poste rj 2900 0.1 2976 1.04 77.42
deu no poste federal 2700 0.7 2831 1.03 1.94
deu no poste rio de janeiro 2600 0.3 3068 1.17 3.84
deu no poste de hoje 2600 0.07 2738 1.06 6.58
deu no poste hj 2400 2592 1.1 5.26
resultado do jogo de bicho deu no poste 2300 0.07 2354 1.03 7.1
resultado jogo bicho deu no poste 2300 0.1 2590 1.11 10.1
o deu no poste 2200 0.03 3363 1.51 46.65
com › deu_no_poste 2200 1867 0.86 1.82
deu no poste rio 2000 2387 1.17 6.02
oque deu no poste 1900 1913 1.01 3.98
deu no poste ontem 1900 0.2 1952 1.04 1.95
o que deu no poste hoje 1900 0. 2386 1.27 17.18
deu. no. poste 1800 1666 0.95 13.56
loteria deu no poste 1600 0.09 1729 1.05 6.77
resultados deu no poste 1600 1892 1.18 11.44
jogo do bixo deu no poste 1400 0.15 1265 0.89 5.07
pt rio deu no poste 1300 0.01 1436 1.14 24.06
deu no póste 1300 1360 1.02 2.03
deu no poste e 1300 1432 1.11 34.92
o'que deu no poste 1200
deu no poste pt 1100 0.03 1166 1.05 3.16
o q deu no poste 1100 1333 1.17 7.55
deu no poste 18 horas 1000 0.4 1184 1.23 2.68
resutado do jogo do bicho deu no poste 1000 0.05 825 0.86 12.46
deu no poste 14 horas 1000 0.01 1147 1.18 2.22
deu no poste deu no poste 1000 0.1 922 0.91 2.94
jogo bicho deu no poste 900 0.09 860 1.01 5.27
ok google resultado do jogo do bicho deu no poste 900 0.15
deu no. poste 900 953 1.02 4.22
jogo deu no poste 900 0.08 945 1.04 5.73
oq deu no poste 900 0.06 1011 1.08 6.08
deu no poste resultado do bicho 900 0.2 1000 1.08 5.41
resutado deu no poste 900 0. 955 1.1 8.95
loterias deu no poste 800 923 1.1 10.09
resultado jogo de bicho deu no poste 800 0.1 987 1.17 7.72
deu no poste lk 800 0.25 823 1.09 9.65
deu no poste de rua 800 0.15 1385 1.7 24.7
deu no poste resultado de hoje 700 0.05 739 1.1 5.32
deu/no/poste 700 712 1.03 5.28
deu no poste sao paulo 600 0.15 765 1.23 2.83
deu no poste corujinha 600 0.01 508 0.85 2.48
resultado do jogo do bicho do rio de janeiro deu no poste 600
resultados do jogo do bicho deu no poste 600 608 0.97 14.03
resultado das 11 horas deu no poste 600
deu no poste?trackid=sp-006 600 606 1.1 7.62
resultado deu no poste de hoje 600 0.07 621 1.07 7.39
deu no poste ptn 600 0.3 611 1.05 2.45
deu no poste goias 600 0.7 728 1.17 3.74
deu no poste às 14 horas 600 601 0.94 8.14
resultado do jogo bicho deu no poste 600 0.08 531 0.96 4.92
deu no poste resultado jogo do bicho 600 0.35 603 0.96 3.85
bicho deu no poste 600 0.06 690 1.12 3.74
deu no/poste 600 621 1. 2.67
deu no poste rs 600 0.45 758 1.24 3.73
ďeu no poste jogo do bicho federal 500 529 0.99 1.58
que bicho deu no poste 500 0.1
resultado bicho deu no poste 500 0.8 574 1.05 3.01
deu no poste] 500 498 1.02 1.51
resultado do jogo do bicho - deu no poste 500
deu no poste bicho 500 0.02 469 0.97 2.45
deu no poste hoje rj 500 488 0.93 10.5
paratodos deu no poste 450 0.
deu_no_poste 450 444 1. 12.52
deu no poste, 450 497 1.11 1.98
deu no ´poste 450 471 1.04 1.36
deu no poste jogo de bicho 450 0.2 433 0.99 3.02
deu no poste go 450
deu no poste 11 horas 450 0.02 542 1.15 2.05
resultado do jogo do bicho que deu no poste 450 0.15 470 1. 8.47
deu no poste[ 400 490 1.2 2.94
deu no poste resultados 400 370 0.92 3.43
deu no poste de hj 400 416 1.09 7.09
o jogo do bicho deu no poste 400 0.15 313 0.79 5.24
deu no poste coruja 400 391 1.02 2.39
resultado do bixo deu no poste 400 0.
resultado do jogo do bicho deu no poste rio de janeiro 400 440 1.1 12.38
que deu no poste hoje 400 0.03
deu no poste 21 horas 400 0. 519 1.22 2.65
jogo do deu no poste 400 0.07 476 1.21 15.85
quero saber o que deu no poste 400 0.03
ďeu no poste jogo do bicho 400 345 0.9 1.89
deu no poste dia 400 0.01 363 0.89 3.96
tado do jogo do bicho deu no poste 400 0.15 395 0.96 10.27
deu no poste de ontem 400 0.15 355 0.94 1.96
deu no poste 21hrs 400
resultado do bicho deu no poste hoje 350 0.
deu no poste 14 350 0. 442 1.27 2.28
deu no poste pt rio 350 0. 336 1.02 2.58
resultado do jogo do bicho deu no poste de hoje 350 0.09 411 1.26 5.58
deú no poste 350 163 0.48 8.15
deu no poste pt rj 350 426 1.3 4.73
resultado da federal deu no poste 350 0. 414 1.21 2.07
q deu no poste 350 414 1.14 11.24
resultado do deu no poste 350 0. 411 1.13 5.24
ďeu no poste 350 0.2 337 0.98 1.78
quero resultado do jogo do bicho deu no poste 350 0.2
deu no poste look 350 425 1.18 3.66
jogo dobicho deu no poste 350 402 1.14 6.36
jogo do bicho deu no poste rs 350
deu no poste loteria federal 350 0.05 359 1.06 1.83
.deu no poste 350 422 1.18 8.29
deu .no poste 300 338 1.04 4.59
deu no poste do jogo do bicho 300 0.15
deu no poste resultado da pt 300 0.15
resultado jogo do bicho deu no poste de hoje 300 0.02
deu no poste às 11 horas 300 243 0.88 6.63
resultado da pt de hoje deu no poste 300 0.2
resultado do jogo do bicho o que deu no poste 300 0.15
deu no poste as 14 horas 300 0. 315 1.06 3.37
deu no poste deu 300 0.
deu no poste das 18 horas 300 0.07 271 0.95 3.19
deu no poste jogo do bixo 300 0. 380 1.22 2.97
resutado jogo do bicho deu no poste 300 0.02 219 0.75 7.6
deu no poste 18h 300 344 1.17 1.65
resultado da coruja deu no poste 300 0.15
o bicho que deu no poste 300 0.01
deu no poste o resultado do jogo do bicho 300 0.09
resultado do jogo do bicho pt rio deu no poste 300
deu no poste as 14 hrs hoje 300 377 1.23 1.58
deu no poste no jogo do bicho 300 0.3
ver resultado do jogo do bicho deu no poste 250 0.15
ok google jogo do bicho deu no poste 250 0.06
resultado loteria deu no poste 250 0.15
deu no poste jogo 250 0.25 232 0.96 3.65
deu no poste 14h 250 305 1.14 1.57
resultado do bicho deu no poste rio de janeiro 250 0.05
ver o resultado do jogo do bicho deu no poste 250 0.06
deu no poste jogo do bicho deu no poste 250 0.15
deu no poste 14hs 250 0. 263 1.04 2.34
deu no poste são paulo 250 0.06 312 1.15 1.98
deu no poste jogo bicho 250 0.25 260 1.15 2.58
deu no poste agora 250
deu no poste do bicho 250 0.02
www o que deu no poste 250
deu no poste online 250 123 0.52 5.92
pesquisar deu no poste 250 0.2
resultado de bicho deu no poste 250 0.
deu no poste de 250 0.
resultado do jogo do bicho rio de janeiro deu no poste 250
ver deu no poste 250
deu no poste pt sp 250 0. 248 1.08 2.29
www deu no poste 250 0.9 230 0.99 4.08
deu no poste no rio 250
deu no poste 18 250 0. 268 1.06 1.73
deu no poste do rio de janeiro 250 0.25
deu nó poste 250 250 1.04 7.43
deu no poste às 18 horas 250 254 0.96 5.06
jogo do bicho de hoje deu no poste 250 0.2
estado do bicho deu no poste 200
deu no poste 21 200 0.01 243 1.16 2.47
jogo do bicho rj deu no poste 200 0.
resultado do jogo deu no poste 200 0.1 199 1.02 1.95
resultado deu no poste rio de janeiro 200 0.15
resultado do jogo do bicho de hoje deu no poste 200 0.2 224 1.13 2.43
ptn deu no poste 200 0.04 211 0.94 6.35
ogue deu no poste 200
deu no poste que bicho 200
deu bicho no poste 200
resultado deu no poste hoje 200 0. 276 1.31 3.7
deu no poste bandeirante 200 244 1.25 4.1
deu no poste do rio 200 0.02
deu no poste 11 200 270 1.21 1.93
deu no poste loterias 200 0.15 217 1.11 2.76
deu no no poste 200 227 1.07 1.86
resultado de jogo de bicho deu no poste 200 0.08
resultado do jogo do bixo deu no poste 200 0. 166 0.87 2.38
res deu no poste 200 0.4 190 1.02 5.76
deu no bicho deu no poste 200 0.
deu no poste das 14 horas 200 0.03 249 1.13 1.88
www ojogodobicho com deu no poste 200 0.
deu no poste as 14h 200
www.jogo do bicho deu no poste 200
deu no poste no rio de janeiro 200 0.15
deu no poste grupo 200
deu no poste domingo 200 0. 207 1.02 1.4
deu no poste deu no poste deu no poste 200 208 0.96 5.88
jogo do bicho deu no poste rj 200 0.7 215 1.06 4.13
deu no poste 14 hs 200 222 1.24 2.11
resultado pt rio deu no poste 200
quero saber o que deu no poste hoje 200
deu no poste ptn rj 200 192 1.02 4.88
deu no poste paraiba 200
o que deu no poste rio de janeiro 200 0.1
loteria federal deu no poste 200 0.02 213 1.2 1.92
deu no poste sabado 200 0. 235 1.07 1.26
deu no poste hoje 14 horas 200 245 1.18 2.93
deu no poste resultado do jogo de bicho 200 0.1 270 1.32 6.05
jogo do bicho deu no poste de hoje 200 0.09
deu no poste 14:00 200 230 1.13 1.65
resultado do jogo do bicho rj deu no poste 200 0.
deu no poste . 200
deu no poste resutado 150 0.15
look loterias deu no poste 150
resultado da corujinha deu no poste 150 0.09
deu no poste goiás 150 228 1.31 3.23
site deu no poste 150 0. 145 0.93 2.89
deu no poste 18hs 150 1.2 168 1.17 1.86
deu no poste 18:00 150 173 1.07 1.38
deu no poste 11horas 150 154 1.19 2.9
pt deu no poste 150 0. 133 0.98 2.1
resultadojogodobicho deu no poste 150 146 0.98 2.85
deu no poste de são paulo 150 0.06
deu no poste dia 19 150 0. 156 1.01 1.43
déu no poste 150 124 0.98 1.78
deu no poste 11h 150 157 0.99 1.63
deu no poste dia 21 150 0. 130 0.91 1.37
resultado deu no poste de ontem 150 0.1
deu no poste em são paulo 150 0.15
para todos deu no poste 150
jogo do bicho do rio de janeiro deu no poste 150 0.07
deu no poste mg 150 0. 138 1.02 1.87
federal deu no poste 150 0.01 168 1.02 1.65
deu no poste dia 17 150 0. 162 1.25 1.53
resultado jogo do bixo deu no poste 150 0. 142 0.94 1.88
deu no poste 11hs 150 191 1.25 2.91
deu no poste jogo do bicho resultado 150 0.15
deu no poste hoje as 14 horas 150 214 1.3 2.89
jogo do bicho deu no poste hoje 150 0.15
jogodo bicho deu no poste 150 0.1 128 0.98 2.3
poste deu no poste 150 0.15 126 0.82 2.56
o resultado do bicho deu no poste 150
deu no poste dia 15 150 0. 168 1.06 1.34
deu no poste/ 150 163 1.1 2.91
deu no poste l 150
o que deu no poste jogo do bicho 150 0.1
deu no deu no poste 150 0.09 137 1.01 2.75
resultado dojogo do bicho deu no poste 150 0.
jogo no bicho deu no poste 150 0.09 165 1.06 2.97
www.o que deu no poste 150
deu no poste 16 horas 150 176 1.09 1.84
deu no poste poste 150 0.2
loteria para todos deu no poste 150 0.25
deu no poste resultado da federal 150 0.01 166 1.27 2.07
deu no poste jogo do bicho de hoje 150 0.15 167 1.02 4.08
deu no pe do poste 150
www resultado jogo do bicho deu no poste 150 0.15
o resultado do jogo do bicho deu no poste 150 0.15
deu no poste 14 hrs 150 159 1.2 1.62
deu no poste?trackid=sp-006?trackid=sp-006?trackid=sp-006 150 127 0.83 4.2
deu no poste as 14hs 150
jogo do bicho deu no poste resultado 150 0.09
e deu no poste 150
jogo do bicho rio de janeiro deu no poste 150 0.08
deu no poste dia 24 de novembro 150 0.8
deu no poste loteria 150 153 1.18 1.79
deu no poste 14hrs 150 203 1.42 3.32
resultado de hoje deu no poste 100 133 1.23 2.59
deu no poste dia 25 100 0.2 138 1.16 1.43
resultado pt deu no poste 100 0.
deu no poste dia 24 100 113 1.06 1.28
jogo do bicho pt deu no poste 100
deu no poste dia 12 100 0. 119 1.1 1.37
resultado federal deu no poste 100 0.03 155 1.38 1.83
resultado do jogo dobicho deu no poste 100 0.
resultado do bicho deu no poste rj 100 0.
deu no:poste 100 114 0.91 2.79
deu no poste dia 22 100 0.02 104 1.02 1.2
deu no poste cantagalo 100 125 1.31 2.38
deu no poste federal hoje 100 139 1.17 1.97
deu no poste resultado do jogo 100 0.06
deu no poste dia 18 100 0. 115 0.93 1.4
deu com a cara no poste 100 0.
deu no poste m 100
deu no poste hoje 18 horas 100 141 1.25 2.52
deu no poste? 100 115 1.1 2.62
deu no poste dia 14 100 0.03 107 0.93 1.44
jogo do bicho o que deu no poste 100 0.05
deu no poste as 11hs 100
resutado do jogo de bicho deu no poste 100 0.
deu no poste jogo do bicho rj 100 0.
deu no poste .com 100 133 1.23 3.04
resultado da pt deu no poste 100 0.25
deu no poste dia 11 100 122 1.04 1.46
jogo do bicho resultado deu no poste 100 0.02 97 0.84 2.5
resultado do jogo do bicho deu no poste hoje 100 0.02 113 1.16 2.63
deu de cara no poste 100
deu no poste dia 27 100 0. 139 1.14 1.41
wwwjogo do bicho deu no poste 100 0.
quê que deu no poste 100 0.01
deu no poste dia 28 100 0.01 112 1.01 1.29
deu no poste dia 16 100 0. 122 1.2 1.22
deu no poste resultado das 11 horas 100 131 1.25 2.72
jogo do bicho que deu no poste 100 0.07
deu no poste das 11 horas 100 112 0.97 2.03
deu no poste bandeirantes 100 120 1.16 3.19
deu no poste dia 13 100 0. 99 1. 1.33
deu no poste das 14 horas de hoje 100
deu no poste carai 100 0.04
deu no poste hoje 11 horas 100 106 1.06 1.71
deu no poste pt hoje 100
deu no poste 23 100 126 1.11 3.08
deu no poste dia 26 100 0.01 109 1.04 1.33
resultadodo jogo do bicho deu no poste 100 98 0.94 2.62
resultado do que deu no poste 100 0.01
resutado do bicho deu no poste 100 0. 96 0.78 2.05
deu no poste resultado do jogo do bicho de hoje 100 0.2
o que deu no poste rj 100
resultado jogo do bicho rio de janeiro deu no poste 100 0.1
jogodobicho deu no poste 100
deu no poste hoje 14h 100
resultado do jogo do bicho deu no poste pt de ontem 100 100 1.05 2.47
deu no poste hoje 18h 100
google jogo do bicho deu no poste 100
deu no poste , 100 107 1.04 2.16
deu no poste ptm 100 108 1.06 1.83
deu no poste resultado jogo bicho 100
deu no poste de goias 100
deu no poste.. 100
resultado jogo do bicho de hoje deu no poste 100
o resultado do bicho que deu no poste 100 0.01
resultado paratodos deu no poste 100 0.
deu no poste dia 10 100 120 1.15 1.33
o que deu no poste no rio de janeiro 100
0 notes
Text
Share Market News
The Dow Jones Industrial Average rose 117.47 points, or 0.44%, to 26,717.43, the SP 500 gained 22.57 points, or 0.77%, to 2,964.33 and the Nasdaq Composite added 84.92 points, or 1.06%, to 8,091.16.
from Moneycontrol Latest News https://ift.tt/2ZYwxd2
from Blogger https://ift.tt/2RPIJtL
0 notes
Text
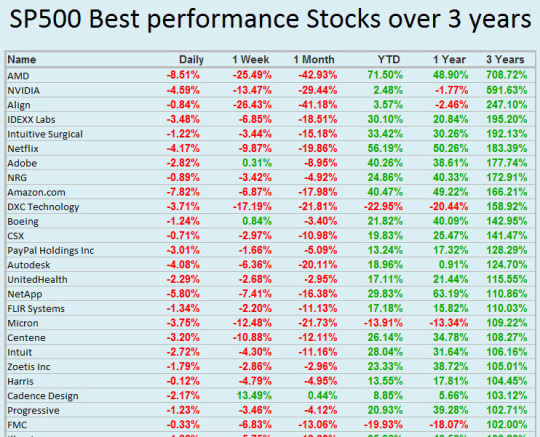
What Stock performed best over 3 years
What Stock performed best over 3 years
Here you have a list over the SP 500 Stocks. The list is sorted with the best persormers over 3 years periode.
No wonders, that Tech Stocks are well represented in this list, as the last three years have been great for this Sector.
The Winners are :
AMD with profit on more than 700%
NVIDIA nearly 600%
Align with profit on 250%
Well done, to investors having these Stocks in Port-folio.

Name
Daily
1 Week
1 Month
YTD
1 Year
3 Years
AMD
-8.51%
-25.49%
-42.93%
71.50%
48.90%
708.72%
NVIDIA
-4.59%
-13.47%
-29.44%
2.48%
-1.77%
591.63%
Align
-0.84%
-26.43%
-41.18%
3.57%
-2.46%
247.10%
IDEXX Labs
-3.48%
-6.85%
-18.51%
30.10%
20.84%
195.20%
Intuitive Surgical
-1.22%
-3.44%
-15.18%
33.42%
30.26%
192.13%
Netflix
-4.17%
-9.87%
-19.86%
56.19%
50.26%
183.39%
Adobe
-2.82%
0.31%
-8.95%
40.26%
38.61%
177.74%
NRG
-0.89%
-3.42%
-4.92%
24.86%
40.33%
172.91%
Amazon.com
-7.82%
-6.87%
-17.98%
40.47%
49.22%
166.21%
DXC Technology
-3.71%
-17.19%
-21.81%
-22.95%
-20.44%
158.92%
Boeing
-1.24%
0.84%
-3.40%
21.82%
40.09%
142.95%
CSX
-0.71%
-2.97%
-10.98%
19.83%
25.47%
141.47%
PayPal Holdings Inc
-3.01%
-1.66%
-5.09%
13.24%
17.32%
128.29%
Autodesk
-4.08%
-6.36%
-20.11%
18.96%
0.91%
124.70%
UnitedHealth
-2.29%
-2.68%
-2.95%
17.11%
21.44%
115.55%
NetApp
-5.80%
-7.41%
-16.38%
29.83%
63.19%
110.86%
FLIR Systems
-1.34%
-2.20%
-11.13%
17.18%
15.82%
110.03%
Micron
-3.75%
-12.48%
-21.73%
-13.91%
-13.34%
109.22%
Centene
-3.20%
-10.88%
-12.11%
26.14%
34.78%
108.27%
Intuit
-2.72%
-4.30%
-11.16%
28.04%
31.64%
106.16%
Zoetis Inc
-1.79%
-2.86%
-2.96%
23.33%
38.72%
105.01%
Harris
-0.12%
-4.79%
-4.95%
13.55%
17.81%
104.45%
Cadence Design
-2.17%
13.49%
0.44%
8.85%
5.66%
103.12%
Progressive
-1.23%
-3.46%
-4.12%
20.93%
39.28%
102.71%
FMC
-0.33%
-6.83%
-13.06%
-19.93%
-18.07%
102.00%
Illumina
-1.02%
-5.75%
-19.60%
35.06%
40.50%
100.80%
Best Buy
-1.04%
-3.31%
-13.75%
-0.03%
24.00%
99.91%
Norfolk Southern
-1.40%
-1.21%
-10.28%
11.76%
21.17%
98.46%
Microsoft
-1.24%
-1.56%
-6.48%
25.04%
27.62%
98.15%
Mastercard
-3.29%
-2.74%
-11.28%
30.48%
32.97%
97.31%
Applied Materials
-0.86%
-5.63%
-16.27%
-36.70%
-42.92%
95.65%
Activision Blizzard
-2.10%
-1.30%
-17.25%
8.72%
7.33%
95.12%
Boston Scientific
-1.54%
-1.94%
-6.94%
44.53%
25.72%
94.73%
Ross Stores
0.34%
2.15%
-2.39%
20.54%
51.57%
92.12%
CME Group
0.66%
-2.20%
4.95%
22.31%
29.87%
92.09%
Jacobs Engineering
-1.75%
2.26%
-3.39%
12.05%
25.89%
90.05%
ONEOK
-1.97%
-6.56%
-6.56%
18.50%
17.12%
88.29%
Anthem
-1.91%
-4.80%
-3.03%
18.11%
25.75%
87.41%
HCA
0.63%
-4.38%
-8.09%
45.56%
66.77%
85.36%
Cintas
-1.28%
-4.02%
-13.32%
10.04%
13.14%
84.42%
Lam Research
-2.43%
-4.20%
-8.31%
-24.43%
-33.13%
83.65%
Xylem
-0.49%
-3.97%
-16.71%
-2.46%
2.56%
82.85%
S&P Global
-3.25%
-8.99%
-12.27%
1.19%
5.70%
82.39%
HP Inc
-2.77%
-2.98%
-10.24%
10.09%
7.58%
82.13%
Edwards Lifesciences
-2.24%
-3.63%
-19.51%
24.34%
37.50%
81.93%
Apple
-1.59%
-1.37%
-4.18%
27.81%
32.66%
81.35%
ResMed
5.69%
1.09%
-9.75%
22.92%
23.31%
80.42%
Baxter
-1.09%
-3.40%
-12.96%
3.81%
2.16%
80.13%
Darden Restaurants
-2.37%
-2.28%
-6.55%
8.22%
24.70%
78.97%
Humana
-1.04%
-3.08%
-5.99%
28.29%
22.89%
78.79%
Thermo Fisher Scientific
-0.08%
1.25%
-5.77%
21.13%
19.53%
77.95%
Albemarle
-0.18%
-0.41%
-4.55%
-25.53%
-31.52%
77.75%
Comerica
-1.13%
-6.63%
-12.63%
-9.22%
-1.23%
77.54%
Aetna
-0.40%
-2.45%
-3.73%
8.26%
12.81%
75.76%
Garmin Ltd
-0.95%
-0.66%
-12.12%
3.34%
9.36%
75.23%
Visa
-1.98%
-1.67%
-8.23%
20.80%
25.55%
74.64%
Mettler-Toledo
-0.15%
-4.08%
-12.05%
-13.55%
-21.12%
74.25%
Synopsys
-2.38%
-0.67%
-11.26%
2.66%
0.37%
73.01%
Salesforce.com
-3.75%
-3.54%
-14.78%
32.56%
34.58%
72.57%
Walmart
-0.24%
1.84%
5.36%
0.19%
12.22%
71.65%
VeriSign
2.08%
-1.92%
-13.40%
21.17%
27.14%
71.41%
Motorola
-1.60%
-2.98%
-8.04%
32.48%
31.24%
70.07%
Deere&Company
-2.76%
-8.85%
-11.53%
-15.02%
-0.19%
68.46%
Arthur J Gallagher
1.45%
1.87%
-0.55%
16.99%
18.37%
68.06%
Sysco
-2.66%
-1.83%
-4.71%
14.93%
27.37%
67.91%
Broadcom
-4.09%
-6.63%
-13.61%
-17.03%
-15.72%
67.72%
Stryker
-2.96%
-5.07%
-9.74%
3.58%
0.40%
67.46%
Agilent Technologies
0.19%
-2.70%
-11.07%
-6.33%
-7.71%
67.19%
Total System Services
-2.33%
-1.54%
-7.35%
15.67%
29.74%
67.18%
Cooper
-1.08%
-2.50%
-10.57%
13.76%
1.40%
66.34%
Regions Financial
0.00%
-4.97%
-12.48%
-7.06%
2.16%
66.25%
IHS Markit Ltd
-0.29%
-2.52%
-5.97%
12.38%
17.13%
65.65%
NextEra Energy
-1.91%
-2.06%
1.37%
8.77%
9.02%
65.02%
E-TRADE
0.32%
-3.18%
-9.30%
-4.14%
9.77%
65.00%
PerkinElmer
-0.28%
-2.54%
-13.65%
14.87%
15.50%
64.72%
McCormick&Co
-0.92%
-1.61%
5.04%
35.80%
39.28%
64.16%
Corning
-2.42%
-0.29%
-13.06%
-4.06%
-2.60%
63.07%
Global Payments
-1.84%
-3.83%
-12.06%
11.77%
10.31%
63.04%
L3 Tech
-0.06%
-5.10%
-3.94%
3.23%
8.01%
62.63%
Kohl’s
-0.20%
3.54%
-1.03%
36.05%
73.27%
61.44%
Becton Dickinson
-1.06%
-3.82%
-12.26%
6.98%
9.00%
61.30%
Fiserv
-1.25%
-0.80%
-5.44%
18.82%
19.68%
61.28%
Ingersoll-Rand
-1.26%
0.52%
-7.80%
5.75%
3.48%
60.79%
Aon
1.55%
0.80%
-0.96%
13.66%
4.19%
60.68%
IPG Photonics
1.09%
1.89%
-13.65%
-37.07%
-35.30%
60.64%
Xilinx
-0.78%
6.32%
-1.73%
16.85%
8.27%
60.35%
Republic Services
2.31%
-3.00%
-3.74%
3.45%
6.97%
60.08%
Caterpillar
-0.50%
-12.39%
-24.55%
-26.99%
-16.52%
59.86%
Dollar General
-2.89%
-1.57%
-1.34%
15.93%
29.51%
59.80%
Gartner
-1.18%
-2.46%
-10.01%
15.83%
13.98%
59.05%
Ulta Beauty
0.97%
1.52%
-2.56%
22.91%
38.18%
58.93%
Zions
-1.25%
-0.87%
-7.16%
-8.40%
-1.17%
58.48%
Union Pacific
-0.98%
-4.01%
-12.34%
6.44%
21.92%
58.42%
CA
0.14%
0.00%
-0.43%
32.09%
33.74%
58.41%
JPMorgan
-1.37%
-4.16%
-8.35%
-3.29%
1.62%
57.89%
Verisk
-0.93%
-1.98%
-5.57%
18.58%
34.02%
56.67%
Newmont Mining
1.35%
-6.80%
-0.66%
-20.04%
-16.20%
56.66%
Amphenol
-1.08%
2.59%
-9.47%
-3.05%
-1.71%
56.38%
Quanta Services
-0.29%
-3.52%
-7.25%
-20.84%
-18.48%
56.05%
Waste Management
0.11%
-6.09%
-6.01%
-1.59%
3.18%
55.52%
Cboe Global
0.22%
1.93%
11.43%
-14.17%
-4.48%
55.42%
ADP
-2.95%
-4.92%
-9.50%
16.35%
15.31%
55.10%
Roper Technologies
7.55%
2.65%
-3.66%
10.19%
10.80%
54.93%
Constellation Brands A
-1.50%
-5.82%
-2.62%
-8.14%
-0.92%
54.83%
Qorvo Inc
-1.75%
-3.61%
-9.30%
4.71%
-5.40%
54.39%
Texas Instruments
-1.32%
-7.84%
-15.59%
-13.29%
-7.12%
54.35%
McDonald’s
-1.12%
3.49%
3.62%
0.71%
4.81%
53.48%
American Water Works
-1.89%
-4.04%
0.30%
-3.56%
0.64%
52.83%
Exelon
-0.52%
-1.16%
-0.09%
10.68%
8.37%
52.73%
Bank of America
-0.75%
-6.81%
-10.42%
-10.60%
-5.07%
52.72%
Cigna
-1.75%
-1.58%
-0.75%
1.77%
2.35%
51.92%
AbbVie
-1.15%
-8.16%
-14.58%
-16.46%
-12.12%
51.69%
Estee Lauder
-0.62%
0.14%
-13.56%
-1.27%
12.29%
50.89%
Cisco
-2.68%
-2.40%
-9.04%
15.54%
28.52%
50.72%
Alphabet C
-2.20%
-2.28%
-10.22%
2.40%
5.12%
50.29%
Sherwin-Williams
0.66%
-8.17%
-18.62%
-9.66%
-6.76%
50.12%
Praxair
-0.04%
3.18%
2.62%
6.63%
11.34%
50.07%
Twenty-First Century Fox A
-0.27%
-1.53%
-2.57%
30.73%
70.92%
49.82%
Abbott Labs
-1.00%
-0.89%
-8.68%
17.38%
20.99%
49.66%
Wynn Resorts
-2.63%
-8.79%
-20.90%
-40.38%
-29.79%
49.35%
ProLogis
-2.22%
1.32%
-4.96%
-0.12%
-0.40%
48.63%
Raytheon
0.21%
-7.39%
-14.41%
-5.83%
-1.88%
48.61%
Rockwell Automation
2.43%
-1.45%
-13.97%
-17.84%
-14.55%
48.38%
American Tower
-2.54%
-0.36%
2.97%
4.86%
7.61%
48.32%
Citizens Financial Group Inc
-0.08%
-1.40%
-7.03%
-14.58%
-6.74%
48.30%
Allstate
-0.56%
-5.13%
-6.45%
-11.82%
-1.49%
48.18%
ANSYS
-2.26%
-4.70%
-23.13%
-2.76%
5.69%
47.84%
Red Hat
-3.19%
-2.86%
-14.38%
-2.85%
-3.39%
47.55%
Fox Inc
0.02%
-1.60%
-2.23%
31.30%
73.98%
47.32%
Alphabet A
-1.80%
-1.94%
-10.22%
2.88%
4.84%
47.06%
CenterPoint Energy
-2.09%
-3.38%
-1.74%
-4.20%
-8.67%
46.63%
Marriott Int
1.07%
0.62%
-14.62%
-16.95%
-5.17%
46.61%
Ameren
-1.96%
-2.50%
1.87%
9.17%
4.21%
46.26%
United Rentals
-1.89%
-6.74%
-33.23%
-36.46%
-25.15%
46.24%
Digital
-9.24%
-5.84%
-5.75%
-6.93%
-9.04%
46.16%
Marsh McLennan
0.28%
1.85%
-0.93%
0.69%
1.17%
45.79%
TJX
0.04%
-0.67%
-4.89%
39.34%
51.03%
45.49%
Transdigm
-3.66%
-6.32%
-15.15%
15.03%
13.83%
45.18%
Charter Communications
-6.29%
-8.19%
-9.47%
-12.19%
-7.74%
44.89%
Alliant Energy
-1.52%
-2.70%
0.68%
0.59%
-2.03%
44.55%
Michael Kors
-2.20%
-4.15%
-18.83%
-11.60%
13.53%
44.40%
Rockwell Collins
-0.78%
-2.46%
-8.69%
-5.42%
-5.20%
44.35%
Varian
-2.30%
6.48%
-0.88%
-0.19%
4.32%
43.80%
Berkshire Hathaway B
-1.73%
-5.40%
-7.30%
0.14%
5.25%
43.67%
ICE
-0.51%
-0.74%
-1.54%
4.51%
12.61%
43.10%
United Continental
-1.13%
-3.20%
-4.97%
25.56%
40.46%
42.12%
Northrop Grumman
-0.05%
-12.30%
-14.98%
-12.08%
-9.35%
41.65%
Torchmark
-0.46%
-3.88%
-4.61%
-8.84%
-2.67%
41.52%
Waters
-0.52%
-1.47%
-6.16%
-5.44%
-8.54%
41.41%
Parker-Hannifin
-0.85%
-7.86%
-20.92%
-27.12%
-20.89%
41.25%
Vertex
2.34%
-3.53%
-12.07%
13.09%
12.90%
41.12%
Moodys
-8.67%
-11.35%
-15.29%
-4.05%
-3.26%
41.08%
Honeywell
-0.98%
-4.84%
-11.25%
-4.77%
-0.11%
40.99%
Nasdaq Inc
-0.10%
3.46%
-2.67%
8.69%
15.44%
40.87%
Accenture
-1.57%
-2.42%
-9.25%
0.89%
7.80%
40.75%
F5 Networks
-0.64%
2.81%
-14.56%
29.84%
40.60%
40.42%
JB Hunt
-0.83%
-4.59%
-10.45%
-7.37%
-2.83%
40.33%
SunTrust Banks
-1.34%
-5.14%
-10.82%
-7.79%
-1.75%
40.08%
Emerson
-1.27%
-8.33%
-13.49%
-4.94%
-1.68%
39.74%
The Charles Schwab
0.02%
-7.77%
-12.13%
-15.92%
-3.83%
39.59%
Facebook
-3.70%
-5.63%
-11.61%
-17.62%
-18.28%
39.51%
Fidelity National Info
-1.51%
-2.29%
-7.06%
7.74%
4.92%
39.26%
Home Depot
-3.82%
-4.24%
-16.86%
-9.13%
2.92%
39.10%
Costco
-3.63%
-5.00%
-7.11%
17.23%
34.37%
38.31%
Marathon Petroleum
-1.57%
-6.85%
-13.89%
4.36%
17.77%
38.16%
Lockheed Martin
-0.44%
-7.04%
-11.83%
-4.98%
-0.96%
38.01%
Quest Diagnostics
-0.46%
-10.76%
-15.23%
-7.13%
-4.40%
37.98%
DTE Energy
-1.91%
-0.08%
3.41%
3.10%
1.82%
37.34%
Avery Dennison
-0.99%
-9.69%
-18.67%
-23.28%
-16.95%
37.13%
J&J
-1.08%
-1.50%
-0.87%
-1.97%
-3.39%
36.32%
American Express
-2.27%
-5.13%
-4.92%
1.95%
5.70%
36.00%
CMS Energy
-2.96%
-2.82%
0.51%
4.12%
2.18%
35.86%
FedEx
-1.52%
-4.22%
-12.57%
-15.63%
-8.65%
35.59%
Valero Energy
-1.82%
-7.51%
-24.58%
-6.66%
10.34%
35.27%
Illinois Tool Works
1.16%
-2.31%
-12.06%
-25.62%
-21.98%
34.70%
Xcel Energy
-1.86%
-1.26%
2.75%
0.83%
-1.42%
34.60%
Tyson Foods
-1.96%
-3.14%
1.58%
-25.41%
-14.88%
34.47%
Alexandria RE
-2.86%
-1.09%
-3.74%
-7.27%
-0.88%
33.92%
Packaging America
1.54%
2.81%
-17.60%
-25.02%
-22.70%
33.65%
NiSource
-1.85%
0.16%
2.09%
-0.90%
-3.78%
33.19%
Eaton
-0.26%
-6.83%
-16.97%
-8.86%
-9.73%
33.15%
Tapestry
-0.67%
-2.99%
-17.96%
-6.76%
2.38%
33.03%
Duke
-2.43%
-0.11%
-2.36%
1.80%
-3.21%
32.85%
WEC Energy
-2.41%
-2.38%
3.19%
3.70%
1.55%
32.74%
Church&Dwight
-2.11%
-3.81%
-2.26%
15.67%
28.05%
32.67%
KLA-Tencor
-2.04%
-3.96%
-14.26%
-17.00%
-19.30%
32.52%
WW Grainger
1.28%
-0.57%
-23.14%
16.28%
37.52%
32.52%
Expeditors Washington
-1.34%
-1.40%
-11.15%
0.99%
10.04%
32.03%
Tiffany&Co
-0.34%
-0.07%
-17.09%
2.87%
13.69%
31.67%
Intel
3.11%
3.84%
-3.38%
-1.02%
2.91%
31.63%
Nucor
-2.75%
-3.87%
-11.54%
-11.72%
-5.65%
31.61%
Fifth Third
-0.04%
-1.79%
-7.38%
-14.77%
-11.04%
31.54%
Morgan Stanley
-1.30%
-5.28%
-5.58%
-16.20%
-14.05%
31.49%
Public Service Enterprise
-2.63%
-0.91%
3.01%
5.59%
9.88%
31.38%
The AES
-1.09%
-2.87%
3.93%
34.35%
34.97%
30.85%
Equinix
-6.49%
-7.02%
-11.01%
-15.00%
-15.62%
30.76%
PVH
-1.78%
-2.19%
-17.90%
-13.60%
-6.69%
30.72%
Raymond James Financial
-3.39%
-15.47%
-20.70%
-18.25%
-14.61%
30.26%
Dollar Tree
0.31%
-1.46%
2.12%
-22.39%
-10.65%
30.21%
PulteGroup
3.32%
10.89%
-3.39%
-28.03%
-20.42%
29.91%
SBA Communications
-3.15%
-2.05%
-5.86%
-7.44%
3.06%
28.85%
Hilton Worldwide
1.07%
-3.38%
-15.49%
-14.51%
-5.06%
28.71%
Dover
0.42%
-0.42%
-7.31%
-18.74%
-14.52%
28.60%
PNC Financial
-0.15%
-4.56%
-12.29%
-17.22%
-13.55%
28.55%
Microchip
-0.22%
-6.95%
-20.96%
-29.03%
-34.15%
28.44%
ConocoPhillips
0.68%
-5.53%
-11.52%
24.76%
33.72%
28.38%
Pinnacle West
-2.13%
-2.94%
4.38%
-2.97%
-7.04%
28.18%
Eli Lilly
-1.39%
-4.94%
-0.86%
25.96%
26.87%
28.07%
Merck&Co
0.63%
-2.70%
-0.76%
25.11%
20.88%
27.77%
Analog Devices
-0.06%
-4.01%
-14.53%
-11.23%
-13.35%
27.76%
Ball
0.16%
-5.53%
-1.36%
14.64%
1.45%
27.69%
American Electric Power
-1.09%
-0.71%
2.62%
-1.13%
-1.73%
27.46%
Textron
-0.41%
-5.89%
-25.27%
-5.62%
0.72%
27.23%
Allegion PLC
-0.28%
1.12%
-8.68%
3.96%
3.01%
26.86%
Cincinnati Financial
6.62%
0.25%
-0.40%
2.04%
7.70%
26.80%
CH Robinson
-1.40%
-5.14%
-11.98%
-3.26%
7.98%
26.77%
Lowe’s
-4.26%
-5.83%
-18.32%
0.90%
16.34%
26.70%
Fastenal
0.08%
-5.10%
-14.94%
-9.76%
4.58%
26.47%
M&T Bank
0.11%
-2.52%
-3.65%
-7.29%
-5.54%
26.26%
Booking
-1.87%
-1.93%
-10.75%
1.90%
-6.35%
26.08%
Laboratory of America
-1.35%
-10.47%
-11.03%
-3.12%
-0.56%
25.83%
EOG Resources
-0.52%
-9.44%
-16.47%
-1.25%
8.22%
25.68%
Electronic Arts
-2.45%
-5.77%
-20.14%
-8.41%
-17.68%
25.34%
T Rowe
-1.73%
-6.19%
-14.02%
-10.54%
-0.12%
24.76%
Cummins
0.31%
-8.00%
-11.84%
-27.10%
-28.26%
24.74%
Chevron
-0.04%
-5.60%
-8.79%
-10.91%
-1.77%
24.21%
United Technologies
-0.94%
-4.24%
-11.86%
-3.40%
3.49%
24.07%
O'Reilly
0.47%
-4.06%
-6.12%
35.56%
50.24%
23.97%
Northern Trust
-1.24%
-4.99%
-13.36%
-11.41%
-6.57%
23.87%
Ecolab
-1.84%
-0.81%
-6.02%
9.81%
11.63%
23.20%
Eversource Energy
-1.41%
-0.88%
2.16%
-0.65%
-0.03%
23.15%
Ametek
0.45%
-5.49%
-15.66%
-7.92%
-3.56%
23.07%
KeyCorp
-0.47%
-4.37%
-14.23%
-15.42%
-7.13%
22.73%
Loews
-1.20%
-3.83%
-10.01%
-9.65%
-5.74%
22.66%
Paychex
-1.40%
-5.78%
-13.09%
-5.98%
-2.13%
22.53%
Kansas City Southern
-1.40%
-3.65%
-9.74%
-2.82%
-1.93%
22.29%
BB&T
-1.13%
-4.99%
-4.24%
-6.52%
-4.64%
22.25%
Medtronic
-2.19%
-4.46%
-8.76%
11.15%
10.39%
22.04%
IFF
0.29%
0.73%
0.73%
-8.18%
-5.67%
21.80%
Hormel Foods
-1.29%
-1.34%
4.49%
13.14%
35.52%
21.77%
Oracle
-1.33%
-0.57%
-8.22%
0.08%
-7.00%
21.71%
Entergy
-1.28%
-2.01%
1.60%
1.28%
-5.00%
21.65%
CarMax
-0.86%
2.02%
-6.20%
9.22%
-5.81%
21.03%
Clorox
-2.49%
-3.11%
-1.72%
-0.62%
16.37%
20.54%
Crown Castle
-3.55%
-3.17%
-7.00%
-6.73%
0.34%
20.41%
Pfizer
-1.87%
-4.27%
-3.34%
17.61%
19.66%
20.17%
Huntington Bancshares
0.15%
-4.15%
-8.78%
-6.52%
-2.37%
19.91%
Citrix Systems
-1.41%
-0.09%
-9.49%
14.33%
21.66%
19.53%
Verizon
-1.63%
1.11%
3.97%
4.87%
13.59%
19.43%
FirstEnergy
-3.11%
-5.51%
-1.24%
19.89%
13.65%
19.03%
Hasbro
-0.84%
-5.44%
-11.81%
2.00%
-4.56%
18.59%
DR Horton
1.21%
0.36%
-14.53%
-29.41%
-18.62%
18.51%
TE Connectivity
-1.27%
-3.47%
-14.86%
-21.23%
-16.28%
18.39%
CBS
-1.55%
-5.89%
-6.30%
-8.76%
-5.15%
18.33%
US Bancorp
-0.70%
-3.03%
-3.60%
-4.98%
-6.48%
18.23%
Realty Income
-0.85%
2.10%
4.99%
4.75%
10.75%
18.04%
Concho Resources
-0.85%
-8.38%
-11.50%
-10.01%
2.12%
17.77%
Assurant
-0.39%
-9.72%
-11.21%
-4.95%
-4.20%
17.75%
Zimmer Biomet
-5.75%
-7.45%
-12.43%
-4.59%
-7.50%
17.64%
Yum! Brands
-1.31%
-4.05%
-5.64%
5.11%
14.01%
17.56%
Discover
-7.92%
-11.32%
-11.81%
-12.35%
0.96%
17.35%
Citigroup
-1.17%
-6.75%
-10.50%
-13.71%
-13.08%
17.32%
Phillips 66
0.97%
-3.23%
-11.77%
-1.68%
8.11%
17.15%
Willis Towers Watson
0.65%
-0.69%
-1.37%
-7.75%
-13.99%
17.14%
3M
-0.02%
-7.46%
-12.23%
-21.42%
-21.21%
17.00%
VF
-0.09%
1.99%
-15.13%
7.18%
11.86%
16.96%
Hershey
-0.31%
-3.81%
0.51%
-9.68%
-1.50%
16.18%
Consolidated Edison
-0.62%
-1.36%
0.18%
-10.15%
-11.16%
14.94%
Procter&Gamble
-1.28%
0.64%
5.56%
-4.38%
0.94%
14.83%
Mid-America Apartment
-2.16%
-1.55%
-2.31%
-2.68%
-2.67%
14.74%
MGM
-1.42%
-6.42%
-10.64%
-25.31%
-20.19%
14.61%
AO Smith
-3.19%
-3.19%
-18.04%
-28.62%
-26.61%
14.47%
Duke Energy
-2.09%
-1.04%
2.34%
-2.64%
-6.89%
14.45%
Amgen
-1.13%
-7.84%
-10.28%
6.95%
6.10%
14.33%
Comcast
-1.67%
-2.06%
-0.48%
-12.01%
-4.21%
13.79%
Robert Half
-1.99%
-5.17%
-16.84%
5.38%
10.77%
13.19%
Ralph Lauren A
0.14%
3.03%
-7.51%
22.69%
39.66%
13.15%
General Dynamics
-0.43%
-10.72%
-17.03%
-16.51%
-17.14%
12.65%
Everest
-1.21%
-5.16%
-10.26%
-7.34%
-13.47%
12.54%
Symantec
-1.79%
-5.19%
-12.36%
-33.54%
-41.88%
12.48%
Helmerich&Payne
-0.16%
-5.26%
-8.87%
-3.05%
19.12%
11.99%
Sempra Energy
-1.94%
-3.26%
-0.83%
5.51%
-2.45%
11.79%
BlackRock
-1.28%
-3.66%
-17.91%
-24.68%
-18.56%
11.73%
Edison
-1.86%
-3.04%
0.72%
7.80%
-14.22%
11.33%
Host Hotels Resorts
-1.50%
-3.51%
-12.65%
-7.15%
-5.20%
11.29%
Essex Property
-2.55%
0.92%
0.49%
2.71%
-5.52%
11.08%
Xerox
-1.26%
1.94%
1.52%
-6.04%
-10.14%
11.07%
Goldman Sachs
-0.77%
-6.43%
-5.30%
-16.64%
-12.14%
11.00%
United Dominion
-2.31%
-1.12%
-3.66%
1.12%
1.14%
10.40%
Express Scripts
-1.18%
-1.07%
-0.77%
26.31%
51.60%
10.15%
Nike
-1.41%
-2.88%
-14.93%
15.22%
28.79%
9.80%
Genuine Parts
-2.03%
-2.74%
-0.85%
3.74%
11.56%
9.39%
Southwest Airlines
-0.66%
-14.71%
-20.61%
-24.25%
-8.37%
9.18%
Lincoln National
-2.90%
-9.56%
-14.45%
-24.70%
-25.15%
8.78%
Pioneer Natural Resources
-2.57%
-10.27%
-14.08%
-13.42%
2.94%
8.71%
Extra Space Storage
-0.66%
0.58%
1.21%
0.27%
9.20%
8.59%
PepsiCo
-2.13%
0.15%
-1.21%
-7.90%
-0.14%
7.50%
Target
-2.25%
-0.10%
-7.11%
25.58%
35.98%
7.49%
Coca-Cola
-1.27%
-0.88%
-0.58%
0.09%
-0.33%
7.47%
Prudential Financial
-2.38%
-7.62%
-11.01%
-21.59%
-19.51%
7.38%
Chubb
-0.19%
-3.77%
-7.63%
-15.53%
-19.19%
7.07%
Apartment Invest
-1.85%
-1.73%
-3.74%
-2.81%
-4.26%
6.71%
Delta Air Lines
-0.80%
-0.21%
-7.87%
-4.86%
5.38%
6.26%
Travelers
0.04%
-3.79%
-6.49%
-10.58%
-7.45%
6.15%
Eastman Chemical
0.62%
-3.24%
-18.36%
-15.64%
-15.97%
6.07%
PACCAR
0.14%
-8.19%
-18.90%
-22.20%
-23.06%
6.02%
Henry Schein
-1.75%
-3.13%
-6.00%
14.38%
4.42%
5.90%
Marathon Oil
-0.53%
-9.58%
-19.72%
10.40%
35.34%
5.71%
Capital One Financial
-2.85%
-6.42%
-9.67%
-13.89%
-7.58%
5.68%
Royal Caribbean Cruises
-4.51%
-10.51%
-20.68%
-13.59%
-17.02%
5.64%
Bank of NY Mellon
-1.47%
-4.07%
-10.83%
-15.58%
-12.79%
5.57%
DuPont
-1.74%
-9.55%
-19.14%
-26.99%
-28.32%
5.20%
Ameriprise Financial
-3.32%
-10.20%
-17.38%
-28.01%
-24.04%
5.19%
Air Products
-1.35%
-3.84%
-10.55%
-8.93%
-7.12%
5.14%
Cabot Oil&Gas
7.10%
-4.38%
1.78%
-19.86%
-14.32%
5.04%
Danaher
-1.17%
-3.24%
-10.60%
4.65%
5.30%
4.90%
Skyworks
-0.95%
-4.79%
-10.62%
-14.61%
-24.86%
4.62%
Qualcomm
-1.14%
-4.41%
-13.26%
-2.41%
14.50%
3.67%
Ventas
-0.19%
1.52%
4.43%
-5.37%
-9.14%
3.40%
CBRE A
-1.45%
-1.97%
-12.09%
-10.48%
-1.52%
3.19%
Stanley Black Decker
-4.05%
-6.68%
-24.74%
-35.05%
-33.09%
2.87%
Altria
-0.11%
1.84%
4.61%
-11.65%
-2.82%
2.69%
United Parcel Service
-2.33%
-9.60%
-9.80%
-11.62%
-12.79%
2.61%
Martin Marietta Materials
-3.25%
-3.06%
-13.86%
-29.09%
-27.81%
2.53%
Biogen Inc
0.57%
-6.32%
-15.04%
-5.78%
-2.46%
2.21%
International Paper
2.49%
6.18%
-8.75%
-22.59%
-22.61%
2.09%
Discovery A
-2.62%
-9.79%
-5.84%
34.63%
57.91%
2.03%
Carnival
-2.83%
-5.17%
-14.90%
-18.23%
-19.25%
1.84%
Hess
-1.49%
-8.57%
-18.82%
22.41%
33.46%
1.82%
Jefferies Financial
1.50%
-5.04%
-7.29%
-23.14%
-20.96%
1.34%
Cognizant
-1.33%
-4.29%
-8.58%
-0.69%
-6.45%
1.12%
Unum
-0.32%
-8.34%
-11.67%
-37.13%
-34.20%
1.11%
Flowserve
-1.08%
-9.52%
-17.61%
6.95%
1.81%
0.81%
IPG
-1.97%
-7.22%
-0.00%
13.44%
16.27%
0.70%
Dominion Resources
-1.46%
-2.49%
1.98%
-11.58%
-10.98%
0.21%
Brighthouse Financial
-4.09%
-8.38%
-13.07%
-34.41%
-39.56%
-
Fortive
-4.28%
-8.43%
-13.23%
0.98%
-1.40%
-
Gap
1.73%
7.12%
-6.14%
-20.49%
1.50%
-0.33%
Philip Morris
-1.80%
0.19%
9.15%
-15.76%
-15.99%
-0.45%
Iron Mountain
-6.79%
-5.28%
-11.70%
-19.22%
-23.80%
-0.46%
Archer-Daniels-Midland
-3.01%
-6.22%
-7.58%
15.92%
7.87%
-0.73%
Tractor Supply
1.99%
4.58%
-0.04%
21.53%
55.92%
-0.81%
Discovery Communications C
-2.73%
-9.24%
-7.30%
29.52%
52.50%
-0.94%
Walt Disney
-0.85%
-4.80%
-3.21%
5.28%
15.14%
-1.01%
Southern
-0.91%
-0.47%
2.89%
-6.72%
-13.88%
-1.04%
AvalonBay
-1.57%
-1.73%
-3.46%
-1.97%
-3.72%
-1.23%
Seagate
-8.94%
-11.44%
-18.06%
-7.27%
5.15%
-1.37%
PPG Industries
-0.85%
1.42%
-5.77%
-11.98%
-12.80%
-1.44%
Akamai
-2.09%
-3.53%
-15.28%
-4.72%
16.92%
-1.49%
Arconic Inc
-0.55%
-9.32%
-9.86%
-27.19%
-19.38%
-1.88%
National Oilwell Varco
-3.03%
-11.16%
-16.69%
-0.36%
8.00%
-2.26%
Freeport-McMoran
2.22%
-4.33%
-17.39%
-39.35%
-18.61%
-2.38%
Kellogg
-1.97%
-2.82%
-1.23%
1.74%
14.77%
-2.48%
Welltower
-1.70%
1.05%
1.29%
2.16%
-2.99%
-2.50%
Hartford
-0.94%
-3.28%
-9.71%
-19.85%
-18.28%
-2.82%
LyondellBasell Industries
0.03%
-4.66%
-12.95%
-19.12%
-9.88%
-3.17%
eBay
-2.57%
-4.90%
-17.20%
-27.56%
-25.71%
-3.22%
Hologic
-1.95%
-6.39%
-6.73%
-10.60%
2.63%
-3.34%
Universal Health Services
-4.89%
-8.09%
-9.57%
1.99%
11.71%
-4.20%
Expedia
2.49%
1.84%
-7.65%
0.61%
-2.66%
-4.21%
AutoZone
0.48%
2.45%
-4.14%
4.53%
27.50%
-4.43%
Boston Properties
-1.75%
-1.74%
-6.65%
-11.63%
-5.21%
-5.05%
Omnicom
-1.18%
-7.82%
4.44%
-2.46%
3.62%
-5.08%
Masco
-8.29%
-10.54%
-24.43%
-37.05%
-31.13%
-5.44%
Nordstrom
-0.62%
2.83%
2.19%
29.00%
49.18%
-5.47%
State Street
-2.44%
-8.93%
-20.76%
-31.98%
-29.00%
-5.62%
Exxon Mobil
-1.00%
-5.42%
-8.81%
-7.31%
-7.38%
-5.77%
Regency Centers
-0.16%
1.01%
-0.90%
-7.36%
2.51%
-6.11%
Fluor
1.26%
-5.36%
-23.99%
-14.50%
3.32%
-6.48%
Vulcan Materials
-2.79%
-4.81%
-20.53%
-31.16%
-27.83%
-6.74%
General Motors
2.03%
4.65%
-3.03%
-20.35%
-26.86%
-7.30%
Wells Fargo&Co
-1.18%
-3.10%
-2.49%
-15.53%
-8.27%
-7.57%
Equity Residential
-1.85%
-0.05%
-2.14%
1.68%
-4.15%
-7.95%
Occidental
-1.08%
-5.92%
-17.35%
-7.81%
4.40%
-7.96%
Halliburton
1.15%
-6.39%
-13.30%
-28.09%
-17.18%
-8.18%
Starbucks
-1.51%
-1.01%
2.16%
1.11%
5.81%
-8.57%
Equifax
-1.14%
-21.34%
-25.56%
-17.58%
-11.15%
-9.04%
JM Smucker
-1.10%
0.36%
2.68%
-15.20%
1.59%
-9.45%
Weyerhaeuser
-8.50%
-7.18%
-17.91%
-24.87%
-25.40%
-9.53%
People’s United
-1.62%
-5.30%
-11.27%
-18.77%
-19.71%
-9.58%
Snap-On
-0.83%
-1.20%
-19.00%
-14.68%
-6.15%
-9.78%
Principal Financial
-6.98%
-14.15%
-21.52%
-34.84%
-32.48%
-9.84%
Western Union
-1.73%
-3.08%
-7.56%
-7.31%
-13.03%
-10.06%
Hewlett Packard
-3.43%
-5.25%
-10.30%
1.88%
2.45%
-10.14%
Anadarko Petroleum
-1.32%
-10.85%
-12.71%
9.69%
20.55%
-10.24%
Walgreens Boots
0.65%
-1.45%
4.57%
4.97%
18.22%
-10.26%
PPL
-1.87%
-4.04%
2.39%
-3.20%
-20.64%
-10.35%
LKQ
-0.83%
-4.97%
-16.70%
-35.14%
-28.20%
-10.49%
Synchrony Financial
-2.95%
-10.78%
-9.97%
-27.53%
-15.06%
-11.03%
Juniper
-1.71%
-0.95%
-6.11%
-1.26%
11.67%
-11.20%
IBM
-1.31%
-3.34%
-17.47%
-18.66%
-18.80%
-11.39%
ConAgra Foods
-2.61%
-1.17%
4.27%
-5.97%
5.14%
-12.41%
Pacific Gas&Electric
-2.28%
-5.24%
0.61%
3.26%
-18.97%
-12.58%
Simon Property
-0.59%
2.86%
1.70%
4.67%
14.75%
-12.61%
AT&T
-2.97%
-11.50%
-13.37%
-25.18%
-14.37%
-12.96%
AmerisourceBergen
-1.17%
-8.71%
-8.13%
-7.73%
10.92%
-13.11%
Public Storage
-0.45%
0.43%
-0.40%
-3.91%
-2.94%
-13.29%
Brown Forman
-0.53%
-3.08%
-7.79%
-15.16%
4.27%
-13.32%
Colgate-Palmolive
-6.64%
-7.66%
-11.01%
-21.03%
-15.37%
-13.44%
Mondelez
-2.17%
-4.04%
-6.63%
-6.29%
-1.40%
-13.56%
Mosaic
-0.60%
-10.07%
-8.19%
16.21%
42.41%
-13.72%
Aptiv
-0.54%
-0.75%
-12.12%
-13.08%
-10.84%
-14.43%
News Corp
-1.46%
-4.04%
-5.59%
-22.65%
-7.96%
-14.51%
Federal Realty
-0.56%
-0.31%
-3.12%
-7.75%
0.88%
-14.92%
CF Industries
-1.11%
-12.36%
-18.48%
4.33%
19.59%
-15.08%
Navient
-1.84%
-6.84%
-13.13%
-12.09%
-1.18%
-15.14%
Advance Auto Parts
0.85%
0.13%
-2.25%
65.06%
100.84%
-15.30%
Kimberly-Clark
-2.16%
-7.18%
-9.97%
-15.21%
-8.98%
-15.35%
News Corp A
-1.48%
-3.50%
-3.94%
-21.84%
-7.45%
-15.53%
DaVita
-0.40%
-3.80%
-9.14%
-9.92%
5.15%
-15.96%
BorgWarner
0.87%
3.74%
-11.06%
-25.52%
-28.03%
-16.43%
Johnson Controls
-2.43%
-4.89%
-10.51%
-17.82%
-26.15%
-16.99%
Cerner
-10.86%
-11.80%
-13.76%
-17.57%
-14.94%
-17.67%
Alaska Air
-2.52%
-1.77%
-10.73%
-16.38%
-7.67%
-18.25%
Lennar
3.98%
2.35%
-10.49%
-33.92%
-27.96%
-18.36%
Apache
-1.99%
-11.19%
-21.56%
-11.44%
-8.22%
-18.81%
Fortune Brands
-11.10%
-10.43%
-20.59%
-39.25%
-37.78%
-19.81%
TechnipFMC
-2.48%
-10.19%
-15.68%
-15.84%
-0.83%
-21.30%
Devon Energy
-1.43%
-7.33%
-18.93%
-21.79%
-9.75%
-22.09%
Leggett&Platt
-9.79%
-9.22%
-20.64%
-27.19%
-29.73%
-22.78%
MetLife
-2.97%
-9.76%
-15.33%
-21.76%
-27.13%
-22.81%
SL Green
-1.85%
-1.78%
-6.50%
-9.65%
-4.48%
-23.12%
WestRock Co
0.00%
-2.19%
-22.25%
-34.27%
-31.69%
-23.64%
Harley-Davidson
-3.54%
-9.05%
-20.55%
-29.26%
-24.77%
-24.60%
General Mills
-2.14%
-2.29%
1.40%
-26.60%
-15.61%
-25.12%
Bristol-Myers Squibb
2.48%
-7.13%
-18.77%
-17.71%
-15.87%
-25.39%
Baker Hughes A
-0.69%
-8.62%
-19.13%
-13.53%
-12.59%
-25.61%
Noble Energy
-3.57%
-12.18%
-17.73%
-11.94%
-8.19%
-26.35%
Franklin Resources
-0.10%
-1.51%
-3.62%
-32.36%
-31.65%
-26.67%
Kroger
-1.50%
0.07%
-5.26%
0.47%
34.08%
-26.84%
Campbell Soup
-3.21%
-3.16%
0.27%
-23.65%
-23.69%
-27.68%
Pentair
1.31%
2.45%
-9.23%
-44.28%
-43.89%
-28.26%
American Airlines
0.28%
1.31%
-21.46%
-37.61%
-31.75%
-29.22%
Cimarex Energy
-1.09%
-10.61%
-11.85%
-32.85%
-29.03%
-29.69%
Norwegian Cruise Line
-3.41%
-10.45%
-23.59%
-17.60%
-21.14%
-29.76%
Mylan
0.90%
-2.86%
-14.51%
-26.05%
-18.41%
-30.30%
HCP
-2.00%
0.34%
0.65%
1.57%
3.60%
-30.42%
Kraft Heinz
-2.38%
-5.06%
-0.83%
-29.72%
-29.30%
-30.98%
CenturyLink
-8.07%
-11.91%
-8.63%
16.13%
10.81%
-31.12%
H&R Block
-1.54%
-1.20%
-0.97%
-2.75%
-2.93%
-31.36%
CVS Health Corp
-0.78%
-5.47%
-10.92%
-3.28%
1.64%
-32.45%
Foot Locker
-0.37%
-3.76%
-10.53%
-2.71%
44.56%
-32.95%
Chipotle Mexican Grill
3.42%
2.30%
-3.55%
51.67%
58.76%
-33.06%
Schlumberger
-0.75%
-9.53%
-13.16%
-21.50%
-16.76%
-33.15%
Alliance Data Systems
-1.78%
-7.92%
-15.71%
-21.47%
-14.14%
-33.27%
Vornado
-1.54%
-1.90%
-8.19%
-14.27%
-8.09%
-33.46%
Whirlpool
-6.12%
-2.21%
-11.97%
-38.02%
-35.24%
-33.77%
Brookfield Property A
-2.28%
-4.21%
-9.84%
-19.32%
-5.41%
-34.11%
Alexion
-0.76%
-7.64%
-16.36%
-2.78%
-9.60%
-34.46%
Western Digital
-18.18%
-21.84%
-24.51%
-44.44%
-49.27%
-34.55%
Aflac
-1.16%
-6.23%
-11.41%
-4.99%
-0.64%
-34.82%
Macy’s Inc
-2.18%
0.09%
-6.80%
28.50%
64.40%
-35.09%
McKesson
-2.95%
-10.57%
-10.75%
-24.08%
-12.70%
-35.10%
Scana
-2.14%
-10.56%
-5.97%
-8.07%
-21.35%
-35.49%
Gilead
1.63%
-4.82%
-9.67%
-2.65%
-9.51%
-35.50%
AIG
-3.44%
-13.31%
-23.14%
-31.32%
-36.61%
-35.95%
Sealed Air
1.03%
-2.37%
-21.94%
-36.43%
-29.73%
-36.07%
Williams
-2.80%
-9.05%
-10.56%
-20.24%
-15.02%
-36.50%
Molson Coors Brewing B
-1.99%
-7.01%
-9.43%
-32.13%
-28.98%
-36.68%
Macerich
0.21%
0.04%
-6.75%
-21.50%
-8.84%
-36.76%
Affiliated Managers
-2.41%
-6.31%
-15.50%
-43.71%
-39.41%
-36.97%
Allergan
-1.71%
-6.51%
-6.97%
8.33%
-0.91%
-38.30%
Invesco
-2.27%
-4.23%
-8.00%
-42.39%
-42.94%
-38.72%
The Goodyear Tire&Rubber
-1.12%
0.35%
-13.04%
-37.05%
-36.79%
-39.10%
Viacom B
1.01%
-9.78%
-11.20%
-2.69%
21.57%
-39.62%
Cardinal Health
-1.42%
-6.15%
-7.56%
-18.52%
-19.50%
-39.73%
Ford Motor
-0.11%
5.65%
-2.92%
-28.10%
-25.54%
-40.01%
Kinder Morgan
0.06%
-7.73%
-6.43%
-8.19%
-7.99%
-40.19%
Hanesbrands
-2.61%
0.61%
-10.91%
-21.47%
-27.09%
-40.51%
Regeneron Pharma
-0.33%
-13.85%
-16.88%
-10.68%
-17.94%
-41.20%
Mohawk Industries
-23.86%
-23.47%
-34.40%
-58.31%
-56.48%
-41.43%
TripAdvisor
-2.69%
1.80%
-7.11%
37.67%
28.04%
-41.65%
Dentsply
-2.44%
-5.37%
-9.04%
-47.85%
-44.04%
-42.08%
Kimco
-1.83%
2.84%
-7.05%
-14.27%
-15.25%
-42.58%
Celgene
-0.37%
-12.09%
-19.04%
-30.58%
-26.20%
-43.02%
Acuity Brands
-0.68%
-4.41%
-24.63%
-32.68%
-25.34%
-44.43%
Mattel
-2.82%
-5.41%
-14.33%
-12.55%
-3.93%
-44.97%
Range Resources
-0.81%
-8.91%
-6.77%
-7.15%
-12.29%
-45.06%
Chesapeake Energy
-4.50%
-18.55%
-14.92%
-3.54%
1.33%
-45.19%
Incyte
-0.53%
-3.19%
-7.43%
-32.48%
-45.00%
-46.87%
Nielsen Holdings
-1.56%
-8.72%
-11.06%
-32.42%
-36.22%
-49.12%
EQT
-7.89%
-29.82%
-26.41%
-42.81%
-48.59%
-49.16%
Newfield Exploration
-2.95%
-15.11%
-30.45%
-36.41%
-33.39%
-49.70%
Patterson
-3.19%
-2.65%
-6.83%
-36.95%
-37.96%
-51.40%
DISH Network
-6.58%
-19.05%
-20.97%
-40.82%
-39.21%
-55.59%
Wyndham
-1.29%
-5.54%
-20.57%
-34.14%
-28.38%
-57.54%
Perrigo
-2.36%
-5.45%
-4.00%
-22.02%
-18.26%
-57.64%
Stericycle
-1.43%
-7.99%
-16.82%
-28.21%
-31.25%
-59.83%
General Electric
-4.24%
-10.03%
0.09%
-35.24%
-45.65%
-61.55%
Monster Beverage
-2.78%
-2.03%
-12.41%
-19.34%
-10.04%
-63.88%
Under Armour A
-2.86%
-1.21%
-15.27%
24.60%
12.09%
-63.95%
Newell Brands
-4.70%
-7.79%
-23.00%
-49.42%
-60.92%
-64.25%
Coty Inc
-3.95%
-5.41%
-20.70%
-49.92%
-33.20%
-65.32%
Signet Jewelers
-1.01%
-4.72%
-22.57%
-9.73%
-23.53%
-65.85%
Under Armour C
-2.82%
-1.49%
-14.95%
24.25%
14.93%
-66.81%
L Brands
-0.59%
2.63%
0.40%
-49.49%
-31.96%
-67.41%
KKR & Co
0.35%
-6.39%
-14.08%
15.40%
17.23%
-72.26%
Keurig Dr Pepper
0.21%
0.08%
4.01%
54.19%
74.51%
-73.50%
What Stock performed best over 3 years
Read the full article
0 notes
Text
طريقة تخطي حماية غوغل لهاتف كوندور Reset Frp Condor G4 PGN-513
كيفية حذف وتجاوز حساب غوغل google account لهاتف كوندور Remove Bypass FRP Condor G4 PGN-513
طريقة تخطي حماية غوغل لهاتف كوندور Reset Frp Condor G4 PGN-513
أصبحت مشكلة نيسان حساب غوغل بعد عملية فرمتة الهاتف أو إعادة ضبط المنصع من المشكلات التي يعاني منها أصحاب أجهزة الأندرويد انطلاقا من أندرويد 5.1 إلى الأحدث ، فيصعب عليه إيجاد حل لمشكلة حساب قوقل google account أو Bypass FRP
قد يهمك أيضا : أفضل أداة تجاوز حساب غوغل لهواتف الأندرويد Download Miracle FRP Tool 1.06
إن شاء الله ستحل مشكلة حماية غوغل Bypass FRP لهاتف كوندور Reset Frp Condor G4 PGN-513 بسهولة وبدون البحث عن الثغرات وتحميل التطبيقات لازالة الحماية ، وهي عن طريق تحميل ملف صغير جدا ، وتمرير هذا الملف عن طريق أداة التفليش المشهورة لهواتف Mediatek ميديا تيك SP FLASHTOOL.
قد يهمك أيضا : أقوى زأفضل أداة لحذف حساب غوغل 2018 Android Multi FRP Unlock Tool Download Free
تحميل أدوات تخطي حساب غوغل Bypass FRP لجهاز كوندور Reset Frp Condor G4 PGN-513 :
* تحميل ملف حذف حماية حساب غوغل من هنا
* تحميل DRIVER USB التعريفات الخاصة بهواتف Condor ليتعرف الحاسوب على الهاتف من هنا وفك الضغط عنها وتثبيتها.
* كلمة فك ضغط الملف : www.krimoflasher.com
* تحميل أداة التفليش SP FLASHTOOL من هنا
لمعرفة كيفية تخطي حساب غوغل Bypass FRP لجهاز كوندور Reset Frp Condor G4 PGN-513 بواسطة استخدام برنامج التفليش SP FLASHTOOL تابع الشرح بالصور من هنا
شرح كيفية التحميل من موقع file-upload
طريقة تخطي حماية غوغل لهاتف كوندور Reset Frp Condor G4 PGN-513
الرومات الرسمية للهواتف
from 1th3professiona https://ift.tt/2LIo5Ht
via IFTTT
0 notes
Text
Couche Tard
International conglomorate of gas stations and convenience store chains (Mack's, Circle K, etc.)
Overvalued by 38% with a current price of $62.56, and a present value of $45.23
People from my investing group have been raving about their holdings in Ailmentation Couche-Tard (ATD.B), so I've attempted to analyze the stock.
Financial Health
Profit margins around 3% (5y avg. and normal for competitive retail)
A current ratio of 1.06 (4,477 in current assets to 4,188 in current liabilities) means they're managing a level of debt that isn't too high.
Free Cash Flow growth rate of 3.25% (5y avg., inconsistent)
Valuation
With slim profit margins and little opportunity for revenue growth beyond acquiring more gas stations and convenience stores, Couche-Tard is not a particularly exciting investment, unless it's heavily underpriced. If we discount at 8%, the return I would expect from the market, we arrive at a present value of $15.4b:
Discounted Cash Flows in Millions Projected at 3.25% Discounted at 8% 2019 1,026 950 2020 1,059 907 2021 1,093 867 2022 1,128 829 2023 1,164 792 Terminal Value 16,315 11,103
Total 15,448Shares outstanding429mPresent value per share$36.00
This would imply a fair value of $36.00/share, way lower than the current market price of around $62. I can see 3 potential causes for the discrepency:
The stock market is over-excited about this company. This is generally true for the market as a whole, but unlikely for such an unglamourous business in the uneventful market of retail gum and gas.
Other investors used a higher growth rate. It could be that the 5y historical average growth rate is unreliable.
Other investors do not expect the stock to appreciate at the same rate as the market. They would have used a lower discount rate.
I looked at the stock's statistics to see if there's anything interesting that could factor into my valuation.
Negative Beta
Yahoo! Finance shows the stock beta as -0.37. That means that the stock price has a tendency to move only 37% when the market moves 100%, but in the opposite direction.
I don't know what this means.
Theorhetically, as the market reaches new heights, the stock should simultaneously reach new lows, and eventually hit zero, but obviously that hasn't been the case.
From what I've read about negative beta, assets that benefit from a down market are most likely to have negative ratios (eg. gold, bonds and stocks for companies that provide bankruptcy services). Perhaps this is what one might call a defensive stock?
I compared the 5-year performance of the stock to the S&P 500:
How is it that a stock that has gone up more than 200% in the last 5 years, compared to the 75% of the stock market, can have a negative beta?
It's beaten the S&P 500 over the last 5 years by a lot. Let's see what we get for a discount rate when I use the stock's beta in a Weighted Average Cost of Capital calculation.
WACC
Here is the equation and it's variables:
WACC = E/V × Re + D/V × Rd × (1 + Tc) Variable Description Value E Total equity 7,563 D Total debt 15,250 V E + D 22,813 Re Cost of equity (Market's expected return) - Rd Cost of Debt (avg. interest rate) 0.0322 Tc Corporate tax rate 0.22
The cost of equity can be calculated using the Capital Asset Pricing Model (CAPM) as follows:
Re = rf + β × (rm − rf) Variable Description Value rf Risk-free rate 2.883 β Stock beta -0.37 rm Market return 9.84
Therefore:
Re = 2.88 + -0.37 × (9.8 − 2.88) = 2.88 + -0.37 × 6.92 = 2.88 - 2.56 Re = 0.32
Our cost of equity is 0.32%, or, for the WACC equation, 0.0032.
WACC = E/V × Re + D/V × Rd × (1 + Tc) = 7,563/22,813 × 0.0032 + 15,250/22,813 × 0.032 × (1 + 0.22) = 0.33 × 0.0032 + 0.66 × 0.032 × 1.22 = 0.001 + 0.025 WACC = 0.026
The discount rate for our discounted cash flow, according to the Weighted Average Cost of Capital is 2.6%.
Discounting Cash Flows with WACC
Discounted Cash Flows in Millions Projected at 3.25% Discounted at 2.6% 2019 1,026 1,000 2020 1,059 1,006 2021 1,093 1,011 2022 1,128 1,017 2023 1,164 1,023 Terminal Value 16,315 14,349
Total 19,406Shares outstanding429mPresent value per share$45.23
Couche-Tard may be considered a defensive stock, but market speculation appears to have driven the stock up to dangerous levels (which it's hovered around for the last two years).
A higher beta would have produced a higher discount rate, which would have pushed my present value down even further, and made the stock more heavily overpriced. Using the beta as it's reported, we arrive at a discount rate of 2.6%, which is lower than the risk-free rate, meaning that one would receive a higher return from a 10-year U.S. treasury bond, and with less risk. Therefore, I see no reason to buy this stock, unless you are compelled for some reason to buy the absolute safest stocks around.
1 I've taken the number of floated shares from the Key Statistics section for the stock (ATD-B.TO) on Yahoo! Finance
2 Weighted average interest rate from 2018 fiscal year as stated in section c) of the Notes to the Consolidated Financial Statements in the 2018 annual statement (PDF)
3 The coupon, or return vs market cost, of the U.S. Treasury's 10-year bond was 2.88% at the time of writing (although I was unable to find the 10-year rate on treasury.gov. Could it be that they are no longer issuing 10-year notes?).
4 The 90-year average market return for the S&P 500 is 9.8%, as reported by CNBC
0 notes
Text
Trump, trade, Fed take sheen off S&P's longest bull run
New Post has been published on http://newsintoday.info/2018/08/22/trump-trade-fed-take-sheen-off-sps-longest-bull-run/
Trump, trade, Fed take sheen off S&P's longest bull run
(Reuters) – The S&P 500 marked its longest bull-market run with a dip on Wednesday as President Donald Trump’s political position was threatened by the legal woes of two former advisers and ahead of trade talks and the Federal Reserve’s minutes.
Traders work on the floor of the New York Stock Exchange (NYSE) in New York, U.S., August 22, 2018. REUTERS/Brendan McDermid
The index’s bull-market run turned 3,453 days old, making it the longest such streak by commonly-used definitions, and comes a day after it hit a record intraday high.
Nine of the 11 major S&P sectors fell, with the trade-sensitive industrial sector .SPLRCI down 0.71 percent ahead of Sino-U.S. trade talks. Energy stocks got a lift from higher oil prices and retailers gained on Target and Lowe’s results.
Former Trump campaign manager Paul Manafort was found guilty of tax and bank fraud charges on Tuesday evening, while Trump’s former personal lawyer Michael Cohen pleaded guilty to a range of charges and said he acted at the direction of Trump.
A trader works at his post on the floor of the New York Stock Exchange (NYSE) in New York, U.S., August 21, 2018. REUTERS/Brendan McDermid
Investors are considering whether the twin setback will hurt the Republican Party’s election prospects and widen a criminal probe that has overshadowed Trump’s presidency.
“There are some question marks on what the implications of yesterday’s news are on markets to the extent where they are slightly lower, but that’s not much of a move,” said Art Hogan, chief market strategist at B. Riley FBR in New York.
“The biggest driver in the market right now is around policy, and investors are certainly curious about what the minutes of the Fed will look like.”
The minutes of the Fed’s August policy meeting – due at 2:00 p.m. ET (1800 GMT) – are expected to reaffirm the central bank’s confidence in the economy and its commitment to future rate hikes, which Trump has been critical about.
At 9:58 a.m. EDT the Dow Jones Industrial Average .DJI was down 21.99 points, or 0.09 percent, at 25,800.30, the S&P 500 .SPX was down 4.30 points, or 0.15 percent, at 2,858.66 and the Nasdaq Composite .IXIC was down 6.61 points, or 0.08 percent, at 7,852.57.
The energy sector .SPNY rose 1.06 percent as oil prices jumped more than 2 percent. [O/R]
The consumer discretionary index .SPLRCD climbed 0.33 percent after strong results from retailers.
Target (TGT.N) rose 5.5 percent after beating quarterly estimates and raising its full-year profit forecast.
Home improvement chain Lowe’s (LOW.N) surged 7.9 percent, reversing losses from before the bell, as investors took positively new Chief Executive Marvin Ellison’s moves to reduce slow-moving product lines and shed unsuccessful businesses. Rival Home Depot (HD.N) rose 1 percent.
Urban Outfitters (URBN.O) jumped 7.3 percent and furniture maker La-Z-Boy (LZB.N) surged 12.4 percent after their results topped Wall Street estimates.
Declining issues outnumbered advancers for a 1.06-to-1 ratio on the NYSE, but advancing issues outnumbered decliners by a 1.13-to-1 ratio on the Nasdaq.
The S&P index recorded 15 new 52-week highs and no new lows, while the Nasdaq recorded 51 new highs and 13 new lows.
Reporting by Shreyashi Sanyal in Bengaluru; Editing by Anil D’Silva
Our Standards:The Thomson Reuters Trust Principles.
Source link
0 notes
Photo

New Post has been published on http://www.visionmp.com/15-more-bodies-fished-out-from-river-gadchiroli/
15 more bodies fished out from river, Gadchiroli toll now at 37
GADCHIROLI: The Gadchiroli police, which had earlier neglected to pull the corpses of slain Naxalites out of the Indravati river, retrieved 15 bodies on Tuesday after TOI reported it had seen 11 bodies floating in the water.
The bodies included those of eight women cadres. With Tuesday’s recoveries, the toll from Sunday’s encounter at Rale-Kasnasur forest, near the Maharashtra-Chhattisgarh border, has gone up to 31, including 15 women. Police claimed to have killed six more Naxalites in another encounter in Nainer forest on Monday.
By this count, the police have eliminated at least 37 Naxalites, including 17 women, in two days. Together, the Naxalites carried a reward of Rs 1.06 crore on their heads, including Rs 76 lakh for those killed in the first encounter.
The encounter on the banks of Indravati, conducted along with Central Reserve Police Force personnel, is the biggest success of any security agency against Communist rebels in the country. The previous highest for the Gadchiroli police was around eight Maoists killed in December 2017. Senior officials indicated the toll could be higher still as more bodies may float up in the river. “The presence of crocodiles in the waters had halted the recovery of some more weapons and bodies,” said an officer.
Gadchiroli SP Abhinav Deshmukh said the commandos had to abandon the search on Sunday as there were only two squads holed up in a critical location. “The search operations had to be called off in the dark as there was the question of the personnel’s safe return to headquarters,” he said.
At a press conference in Gadchiroli on Tuesday, Maharashtra police additional director general D Kanakratnam praised the forces and said this was a huge blow to the Naxalite movement.
According to a press release, the forces had come under heavy fire from 40-50 Maoists. It claimed similar circumstances for the second encounter involving 10-12 rebels. Of the 37 dead, 16 have been identified so far. Police said several senior cadres were among the dead.
0 notes
Text
GTA 5 money generator that actually works
Add Unlimited Money & RP using latest GTA 5 Hack online tool. This GTA 5 Money Generator is 100% working and it is 100% safe to use. You need to use this for Xbox, PS4 or Windows platforms with latest hacking algorithm. This online GTA V Hack is undetectable to Playstation or MS server with 100% ban protection. Enjoy!
GTA 5 Money Hack Online can create or crack the Money as significantly as you want for the Fantastic Robbery Vehicle 5 bill and we are not planning to cost you any simple penny. You'll nevertheless need certainly to fill out your Player ID/Username so that people may know on which GTA 5 account we've to crack Fantastic Robbery Car 5 Money and RP. That free GTA 5 generator-online takes advantageous asset of a programming drawback in the game that allows for unlimited introducing of free GTA 5 Money and RP on customers accounts. Be mindful to nevertheless maybe not overuse this tool so as in order to avoid detection.
The GTA Money hack is a boon for the players which has been considering for quite a while to become a the main sport but could not able to do so. Therefore be with winners and be described as a winner. Use the GTA 5 money generator free of charge and display your capabilities to everyone and show that you may also do so as others are doing. The GTA 5 online hack is analyzed by lots of people that can be checked online too how they have helped them in their game. Therefore, do contribute to them and provide an authentic evaluation to your associates such that it can be quite a great support for the others too.
GTA 5 MONEY HACK
Fantastic Theft Automobile V [GTA 5] is earth action gaming manufactured by Rockstar North and printed by Rockstar Activities & its on different programs,Microsoft Windows, PlayStation 3, PlayStation 4, Xbox 360, Xbox One, Android and iOS. Fantastic Robbery Car V is definitely an action-adventure game played from either a first-person or third-person view. Participants total missions—linear circumstances with collection objectives—to progress through the story. Beyond objectives, people may possibly freely roam the open world. Composed of the San Andreas start country place and the fictional city of Los Santos, the world is significantly greater in place than earlier items in the series. It could be fully investigated after the game's beginning without limitation, though history development opens more gameplay content.
gta 5 money hack online
gta 5 money generator for online
gta 5 money youtube
gta 5 money glitch garage
gta 5 money hack tool activation code
gta 5 money cheat code
gta 5 money glitch halloween
gta 5 money activation code
gta 5 online money generator xbox 360 download
gta 5 money hack online ps4
gta 5 money cheat in online
gta 5 money locations xbox one
gta 5 money rp glitch
gta 5 money generator xbox one
gta 5 money generator without verification
gta 5 money generator download mac
gta 5 money online cheat
gta 5 money hack social club
gta 5 money hack xbox 360 story mode
gta 5 money walkthrough
gta 5 money hack verification code
gta 5 bati 801 money glitch
gta 5 money generator-online free
gta 5 money hack and cheats online
gta 5 money xbox 360 cheats
gta 5 money app
gta 5 money hack tool no survey
gta 5 get money generator
gta 5 online money generator-gta v unlimited cash hack
gta 5 money glitch heist
gta 5 money website no human verification
gta 5 money generator no download
gta 5 money generator pc
gta 5 money hack xbox one story mode
gta 5 money generator ps4 no human verification
gta 5 money hack no human verification xbox one
gta 5 money cheat underwater
gta 5 money generator 2017 ps4
gta 5 money generator offline
gta 5 money hack glitch
gta 5 money hack may 2017
gta 5 money hack website
gta 5 money generator activation key
gta 5 money glitch heist xbox 360
gta 5 money cheat engine online
gta 5 money glitch 3/17/15
gta 5 money cheat online
gta 5 money from heists
gta 5 money mod usb
gta 5 money xbox 360 online
gta 5 money locations
gta 5 money hack xbox 360 offline
gta 5 money glitch executive
gta 5 money cheat billions
gta 5 online money hack v1 09.zip
gta 5 12 000 money cheat
gta 5 money glitch xbox 360
gta 5 money cheat gta 5
gta 5 money for free
gta 5 money generator 2017 no survey
gta 5 money glitch july
gta 5 money glitch 2017
gta 5 money generator no human verification or survey gta 5 money glitch
gta 5 money hack ps3
gta 5 money hack activation code
gta 5 money generator for ps4
gta 5 money generator no survey or offers
gta 5 rp and money generator xbox 360
gta 5 money glitch version 1.06
gta 5 online money generator no human verification
gta 5 money hack no download or survey
gta 5 ps4 money cheat youtube
gta 5 money cheat code xbox 360 offline
gta 5 360 money drops
gta 5 money generator code.txt
gta 5 money cheat yahoo
gta 5 money generator ps4 download
gta 5 money hack xbox one online no survey
gta 5 money hack activation key
gta 5 money generator ps3 no human verification
gta 5 money find
gta 5 money for xbox 360
gta 5 money glitch location
gta 5 online money generator ios
gta 5 money generator xbox 360 no verification
gta 5 money generator no survey mac
gta 5 money hack server
gta 5 money hack version 4.1
gta 5 money cheats xbox one
gta 5 money generator real or fake
gta 5 2x money
gta 5 money hack with activation code
gta 5 money 4u
gta 5 money glitch youtube
gta 5 money hack for ps3 and xbox 360
gta 5 money hack and rp
how to use gta 5 money generator
gta 5 money hack tool no survey xbox one
gta 5 money generator easy
gta 5 money for ps4
gta 5 money hack 4.1
gta 5 online money generator yahoo
gta 5 my money keeps disappearing
gta 5 money xbox 360 offline
gta 5 money cheat ps3
gta 5 money hack offline xbox 360
gta 5 money fast offline
gta 5 money 100 000
gta 5 money hack tool ps4
gta 5 youtube money glitch
gta 5 money glitch halloween update
gta 5 money locations online
gta 5 money generator does it work
gta 5 money glitch in story mode
gta 5 money for michael
gta 5 money generator-online no verification
gta 5 money generator for android
gta 5 money generator for ipad
gta 5 money tool download
gta 5 money glitch 7 million
gta 5 money locations map
gta 5 money glitch next gen
gta 5 money generator reddit
gta 5 yacht money
gta 5 money generator 1.39
gta 5 money hack tool ps3
gta 5 money generator no key
gta 5 money hack tool activation key
gta 5 money in story mode
gta 5 money hack legit
gta 5 money generator no survey legit
gta 5 money generator without human verification or survey
gta 5 money generator premium tools
gta 5 money rp
download gta 5 money generator code.txt
gta 5 money generator ipad
gta 5 money hack july 2017
gta 5 money hack on ps4
gta 5 money for missions
gta 5 money generator for xbox 360 no survey
gta 5 money hack apk
gta 5 money cheat pc
gta 5 money glitch after heist
gta 5 money keeps disappearing
gta 5 money generator work
gta 5 money generator without human verification 2017
gta 5 online money generator v2 download
gta 5 money cheat map
gta 5 money hack 2017 ps4
gta 5 money adder-cheat-hack-generator
gta 5 money and rp
gta 5 money hack without verification
gta 5 money generator ps4 online
gta 5 online money generator - link
gta 5 money glitch latest update
gta 5 money hack 4.2
gta 5 money generator ps3 no verification
gta 5 money hack ps4
gta 5 keep money safe
gta 5 money investment
gta 5 money hack no download
gta 5 money and rp generator no verification
gta 5 money generator real
gta 5 mod money generator
gta 5 money glitch unpatched
gta 5 online money jobs
gta 5 money glitch june 2017
is gta 5 money generator real
gta 5 money hack forum
gta 5 money hack for pc
gta 5 money hack story mode ps3
gta 5 money hack youtube
gta 5 money hack xbox 360 online no survey
gta 5 money online hack
gta 5 online money generator youtube
gta 5 jewelry money
gta 5 money generator download
gta 5 money glitch easy
gta 5 money generator ps4 no verification
gta 5 money hack xbox 360 no download
gta 5 money glitch xbox one generator
gta 5 money generator-online no survey xbox one
gta 5 money glitch jan 2017
gta 5 money hack for ps3
gta 5 money hack lobby ps4
gta 5 money cheat in ps4
gta 5 money cheat lester missions
gta 5 money generator apk
gta 5 money mod menu
gta 5 money glitch lowrider
gta 5 quick money stocks
gta 5 money generator setup
gta 5 money cheat in pc
gta 5 money generator xbox one download
99 laps gta 5 money
gta 5 money generator no human verification no survey
gta 5 money generator download pc
gta 5 money glitch in ocean
gta 5 money hack pc
gta 5 money glitch yacht
gta 5 money glitch generator
gta 5 money hack no survey ps3
gta 5 money generator no activation code
gta 5 easy money youtube
gta 5 money cheat code ps4
gta 5 money hack offline ps3
gta 5 money generator xbox 360 no offer
gta 5 money in bank
gta 5 money generator no verify
gta 5 money hack for ps4
gta 5 online money glitch generator
gta 5 money xbox one
gta 5 kifflom money
gta 5 money generator iphone
gta 5 money cheat june 2017
gta 5 money hack key
gta 5 money generator trackid=sp-006
gta 5 money generator no human verification
gta 5 money hack usb
gta 5 money hack without download
sifre za gta 5 money
gta 5 money xbox one cheats
gta 5 money hack xbox one
gta 5 money hack story mode pc
gta 5 money hack for android
gta 5 money generator for ios
šifre za gta 5 money
gta 5 money online
gta 5 money rain hack
gta 5 money glitch after patch 1.22
gta 5 money hack tool no survey no password no download
gta 5 money generator without human verification or survey ps4
gta 5 money cheat in story mode
gta 5 money lifeinvader
0 notes
Text
20 standout players of the MLB playoffs
The Major League Baseball postseason always produces superstars. Some of those who emerge are expected, while some are unlikely players who go from anonymity to household name overnight. That can happen thanks to a hot streak at the right time, a dramatic home run, a surprisingly great pitching performance, or some sterling defensive play.
Here is a list of 20 players who have been the standout players so far during the 2017 MLB playoffs.
Jose Altuve, 2B, Astros
The potential AL MVP had a great regular season, and that has carried over into the postseason. Altuve, for as well-known and well-respected as he is across baseball, has never really had that signature moment or stretch of performances to really establish himself as a major star. In his only previous playoff series — the 2015 ALDS against Kansas City — he went just 3-for-22.
This year, he promptly opened his postseason with a three-homer game, and he hasn’t looked back since. He hit an astonishing .533 against Boston, and has only slightly cooled in the ALCS, hitting a mere .357. He’s a superstar now, and everyone is taking notice.
Yasiel Puig, OF Dodgers
For much of his career, Puig has been better known for bat flips, off-field antics, and on-field mental errors than for star power on the field. Sure, he has always had spectacular plays in him, but it would be fair to say he had never put it all together. Not anymore.
Puig is having an absolutely dominant postseason, hitting .429 and driving in six runs in Los Angeles’s first six games. It’s too soon to say that he’s found something permanently — Puig has had hot stretches before — but if this keeps up, he’ll evolve into a superstar he once looked destined to become.
Didi Gregorius, SS, Yankees
Gregorius was never going to properly “replace” Derek Jeter, though he was given the near-impossible task of doing so. He has done as well as anyone reasonably could have, though, and his clutch performance in Game 5 of the ALDS had a near-Jeteresque quality to it: two at-bats and two home runs against one of the game’s elite pitchers in likely AL Cy Young winner Corey Kluber. Those homers ended up being the difference in the ballgame, and confirmed what many in New York already knew: Gregorius has quietly evolved into one of the game’s better shortstops. Gregorius also added a big two-hit game in his team’s comeback win in Game 4 against Houston.
Justin Turner, 3B, Dodgers
On a team with so many superstars and high-priced players, it’s Turner who is the heartbeat of the Dodger offense. After torching Arizona to the tune of a .462 batting average — including a Game 1 performance in which he homered and drove in five runs — Turner followed it up just as solidly in the NLCS. He has gone 3-for-11 with three walks, including a walk-off three-run home run in Game 2 that made him a cult hero in Los Angeles. Turner is a star — he played like it during the regular season and has proven it during the postseason.
Tommy Kahnle, RP, Yankees
The entire Yankee bullpen could qualify here, but Kahnle in particular is a name that has excelled. He very rapidly blossomed into an elite reliever while pitching for the White Sox in what is currently baseball purgatory. A trade to the Yankees was just what he needed, and he’s been every bit as good for them. In eight postseason innings, he has yet to give up a run. He’s only given up one hit and two walks, good for a microscopic 0.375 WHIP. The Yankee starters had their struggles at times, and they’ve needed to lean heavily on the bullpen. Kahnle has been up to the task.
Dallas Keuchel, SP, Astros
Keuchel is, of course, a former Cy Young winner, so it’s not as if he wasn’t on anyone’s radar. He had, however, fallen off it a bit after an underwhelming 2016 and struggled with injuries through parts of 2017. He’s firmly back on that radar.
While Justin Verlander has gotten much of the publicity, Keuchel has actually outpitched him in this postseason, giving up only one run in 12.2 innings, good for a 0.71 ERA. Opposing batters are hitting just .156 against him. Keuchel has always been an ace — we just needed a reminder.
Jose Quintana, SP, Cubs
Quintana has been really good for a long time — the problem was that it always came with the Chicago White Sox, who never made the playoffs during his tenure. A midseason trade to the Cubs came with some hiccups, but his numbers improved across the board, and his playoff debut has been as steady and assured as the rest of his career has been.
Though he’s yet to win a game, Quintana has only given up two runs in 11.1 innings of action. He’s kept the Cubs in every single game he’s been in — even giving them a brief relief stint in Game 5 of the NLDS against Washington.
Yuli Gurriel, 1B, Astros
The 33-year-old Cuban rookie proved himself to be a fine hitter and was one of Boston’s chief tormentors in the ALDS victory. Gurriel had nine hits in 17 at-bats, including a double and triple, putting constant pressure on the Red Sox. Though he didn’t drive in as many as he liked — he had no RBIs and proved more of a table-setter — he was a massive headache for Boston. His hot hitting continued in the ALCS. He drove in one of the team’s runs in a 2-1 Game 1 win, and he knocked in three in Game 4.
Kenley Jansen, RP, Dodgers
Kenley Jansen has used the big stage of the postseason to cement his status as the best closer in baseball this year. Jansen has pitched seven scoreless innings this postseason, recording a win and a save for the Dodgers. He’s allowed just two hits and one walk while striking out 12. He’s gone more than one inning for the save on two occasions this postseason, including Game 1 of the NLCS against the Cubs where he struck out all four batters he faced. Having Jansen to close out games gives Dave Roberts a Mariano Rivera-like option in the postseason.
Justin Verlander, SP, Astros
Verlander has given the Astros everything they could have asked for since being acquired in a trade, and then some. Not only did Verlander go 5-0 with a 1.06 ERA to finish out the regular season with Houston, but he has continued his hot pitching into the postseason.
Verlander has gone 3-0 in his three starts with a 2.04 ERA and 0.96 WHIP. His Game 2 start of the ALCS against the Yankees was particularly impressive — he struck out 13 in a complete game victory as Houston won 2-1. The Astros’ technology is said to have helped him.
Yu Darvish, SP, Dodgers
Yu Darvish’s time with the Dodgers involved some ups-and-downs during the regular season. His LA debut came with a 7-inning shutout, but then he had consecutive outings in early September where he allowed five runs. So far, it’s been the dominant Darvish who has shown up in the postseason.
Darvish looked nearly unhittable in a Game 3 NLDS win over the Diamondbacks. He went five-plus allowing just one run on two hits. He could have gone much longer, but Roberts used a quick hook in the game. In Game 3 of the NLCS against the Cubs, Roberts let Darvish work a little longer. He went 6.1 innings of one-run ball, picking up the win. Having him to supplement Clayton Kershaw has made a world of difference in the postseason for the Dodgers.
CC Sabathia, SP, Yankees
Sabathia established himself as the Yankees’ stopper during the regular season, as he was dominant following losses. He’s continued the same trend in the postseason. Sabathia came up huge in Game 5 of the ALDS against the Indians, pitching 4.1 innings of two-run ball, striking out 9. He gave the Yankees enough to turn the ball over to the bullpen, which kept Cleveland scoreless the rest of the game. Then with his team trailing 2-0 in the ALCS, Sabathia came out and shut the Astros out for six innings of Game 3 to get the win. He has become a trusted arm for the Yankees this postseason.
Stephen Strasburg, SP, Nationals
Ever since his dominant debut as a rookie, Strasburg has always felt like something of a disappointment — a good, but not great starter who has dealt with injuries and sat out an entire postseason — against his wishes, mind you. In this year’s postseason, though, he looked like the superstar pitcher that many had always dreamed he’d be.
Though the Nationals didn’t win the series, it was no fault of Strasburg. He didn’t give up an earned run in 14 innings, walking three and striking out 22. His second start came in the middle of huge questions about his health. Strasburg gave us the ace-level performance we’ve always wanted.
Jay Bruce, OF, Indians
A little-heralded waiver trade at the time of his acquisition, Bruce was a key reason the ALDS got to five games. He hit .278 with two key homers in the five-game series loss, including the game-tying blow in Game 2 that helped complete Cleveland’s remarkable comeback from 8-3 down in the eventual victory. Bruce is due to be a free agent after the season, and his postseason performances probably bought him a few extra suitors once he hits the open market.
Kenta Maeda, RP, Dodgers
Many starters see their stuff play well out of the bullpen, and that is exactly what has happened to Maeda in the 2017 postseason. An average enough starter during the regular season, manager Dave Roberts has reinvented Maeda as a righty specialist who dominated when thrown into the fray during the NLDS against Arizona. Maeda struck out four in two innings, serving as a vital bridge between the Dodgers’ starters and closer Kenley Jansen. He also threw a scoreless frame and picked up the win in Game 1 of the NLCS.
Maeda will probably wind up back in the starting rotation next year, but it’s easy to see how this relief stint could really give him a shot of confidence.
Masahiro Tanaka, SP, Yankees
Tanaka had taken a back seat to Luis Severino this year after struggling for much of the regular season, but he’s rediscovered his ace form just in time for the Yankees. He was outstanding in the ALDS against the Indians, throwing seven scoreless innings in a 1-0 Game 3 win that helped gives the Yankees confidence to begin their comeback. And, while he was not quite as great in his first ALCS start against Houston, Tanaka only gave up two runs in six innings and kept Houston right in the game. Opponents have hit just .159 against him in his two playoff starts so far.
Michael Taylor, OF, Nationals
Taylor is perhaps the most unlikely star to emerge from the playoffs so far. A career .243 hitter — though he had a fine season for Washington in 2017 — Taylor hit .333 in the NLDS, including a pair of massive home runs. One was a grand slam off Wade Davis to put Game 4 out of reach. For a while, it looked like his three-run homer early in Game 5 might have been the final nail in the Cubs’ coffin. It didn’t turn out that way, but Taylor can still hold his head high after a fantastic series.
Brandon Morrow, RP, Dodgers
Once an extremely highly-touted pitching prospect — the two players drafted after him in 2006 were Andrew Miller and Clayton Kershaw — injuries put Morrow in the baseball wilderness until he re-emerged as a reliever in 2016. The Dodgers picked up him for 2017 and he’s become an absolutely vital setup man for Kenley Jansen. He’s pitched 7.1 postseason innings thus far and given up just two hits and one run. Morrow is a huge reason the Dodgers are so much better-equipped to win in 2017; their bullpen depth is so much better.
Rafael Devers, 3B, Red Sox
For much of the season, Boston’s third base situation was pretty much awful. Devers stepped in and, while the Red Sox were eliminated much sooner than they would have liked in the ALDS, they can take heart from the performances of a young man who was just 20 when he made his postseason debut. Devers hit .364, went deep twice, and knocked in five runs against the Astros, making himself one of Boston’s standout offensive performers. This kid has a very bright future, and now everyone knows it.
David Price, RP, Red Sox
Many will scoff at the Red Sox having a $30 million reliever, but the truth is David Price came up big for Boston in the playoffs. Price entered Game 2 of the ALDS against Houston with the bases loaded and one out in a 4-1 game and was able to escape without allowing further damage. The score remained 4-1 by the time he left 2.2 innings later. In Game 3, he entered a 4-3 game and kept Houston off the board for four scoreless innings. It wasn’t until later that Boston’s offense broke out and exploded for a 10-3 win.
Price’s second season in Boston was derailed by injuries, but his performances in the playoffs gave him and Sox fans confidence that he may still be a valuable contributor over the life of his contract.
from Larry Brown Sports http://ift.tt/2gsI1op
0 notes
Last Seen Blogs

mining-rules
salt.rules.info

strangersim-blog1
totally tubular

salsadelisa98-blog
Untitled

yongsgarage
Yongsgarage

anthemode
anthemode