#sys.dm_exec_requests
Explore tagged Tumblr posts
Visit Tumblr Blog
Explore Tumblr blogs with no restrictions, modern design and the best experience.
Last Seen Tumblr Blogs


Fun Fact
Mobile Tumblr US users spend an average of 4.04 minutes per session on the app.
Text
Check long running queries in SQL Server
Check the SQL statements having high elapsed time in SQL Server SELECT text AS QueryText, total_elapsed_time / 1000 AS DurationMs FROM sys.dm_exec_requests r CROSS APPLY sys.dm_exec_sql_text(r.sql_handle) order by 2 desc; Identifies slow running queries in SQL…
0 notes
Text
Shrinking Tempdb in SQL Server won't work?
Shrinking Tempdb in SQL Server won’t work?
Problem statement
When I was working DML operation on the database, Tempdb has grown 80 GB. After the completion, It is noted that the tempdb has grown significantly larger and I didn’t have much space on this Server. I tried shrinking the mdf file of tempdb. It executes successfully but no space is released to OS. Is restarting the SQL Server the only way to release the space. Can you please…
View On WordPress
0 notes
Text
T-SQL: Find the currently running queries in sql server
T-SQL: Find the currently running queries in sql server
Hi Friends,
Hope, you are doing fine!
Please find below the T-SQL script to find the T-SQL batches/queries/statements, which is/are still running as on current time on a SQL Server instance!
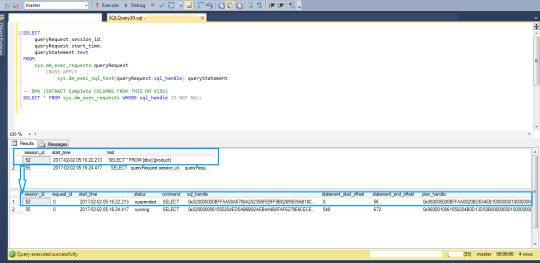
T-SQL Script:
SELECT queryRequest.session_id, queryRequest.start_time, queryStatement.text FROM sys.dm_exec_requests queryRequest CROSS APPLY sys.dm_exec_sql_text(queryRequest.sql_handle) queryStatement GO;…
View On WordPress
#DMVs#Dynamic Management Views#Find the currently running queries in sql server#sys.dm_exec_requests#sys.dm_exec_sql_text#T-SQL Scripts
0 notes
Text
SQL Server 2019 TempDB 配置为内存优化的数据库

要在 SQL Server 中启用 TempDB 功能,需要执行两���步骤,第三个步骤是可选的:
要更改服务器配置,请运行以下 T-SQL:
ALTER SERVER CONFIGURATION SET MEMORY_OPTIMIZED TEMPDB_METADATA=ON;
重新启动 SQL Service
您还可以使用 sp_configure 通过以下 T-SQL 设置内存优化的 TempDB 元数据参数:
EXEC sys.sp_configure N'show advanced options’, 1;
RECONFIGURE WITH OVERRIDE;
EXEC sys.sp_configure N'tempdb metadata memory-optimized’, 1;
RECONFIGURE WITH OVERRIDE;
可以用下面的代码查看TempDB 元数据内存优化参数是否启用:
SELECT SERVERPROPERTY('IsTempDBMetadataMemoryOptimized') AS IsTempDBMetadataMemoryOptimized;
输出 “1” 表示在 SQL Server 实例上启用了内存优化的 TempDB。
您还可以使用 sp_configure 和 sys.configuration 系统视图检查配置:
EXEC sp_configure ‘tempdb metadata memory-optimized’
select * From sys.configurations where name like ’%tempdb%’
让我们强调一下使用 OStress 实用程序 SQL Server。 在本节中,您可以看到使用 OStress 命令施加的繁重工作负载。
在这种情况下,将运行上述相同的 OStress 命令实用程序(重新执行批处理文件),并在下面的代码段中捕获输出。
下面的 T-SQL 脚本用于查找 SQL Server 实例上当前正在运行的查询。 在 T-SQL 中,您还可以看到使用了一个新的动态托管函数来查看页面分配和页面资源的 wait_types 详细信息。
SELECT
req.session_id,
req.wait_type,
req.wait_resource,
OBJECT_NAME(inf.[object_id], inf.database_id) as [object_name],
req.blocking_session_id,
req.command,
SUBSTRING(txt.text,
(
req.statement_start_offset / 2
)
+ 1,
(
(
CASE
req.statement_end_offset
WHEN
- 1
THEN
DATALENGTH(txt.text)
ELSE
req.statement_end_offset
END
- req.statement_start_offset) / 2
)
+ 1) AS statement_text, inf.database_id, inf.[file_id], inf.page_id, inf.[object_id], inf.index_id, inf.page_type_desc
FROM
sys.dm_exec_requests AS req
CROSS APPLY sys.dm_exec_sql_text(req.sql_handle) AS txt
CROSS APPLY sys.fn_PageResCracker (req.page_resource) AS pgc
CROSS APPLY sys.dm_db_page_info(pgc.[db_id], pgc.[file_id], pgc.page_id, 'DETAILED’) AS inf
WHERE
req.wait_type like ’%page%’
在以下代码片段中,我们可以看到管理 TempDB 表没有争执。
在以下代码段中,您看到具有 100 个用户连接和 30 个并发执行的 SP 执行仅花费了 31 秒即可完成。
To disable MEMORY_OPTIMIZED TEMPDB_METADATA run the following T-SQL:
要禁用 MEMORY_OPTIMIZED TEMPDB_METADATA,请运行以下 T-SQL:
ALTER SERVER CONFIGURATION SET MEMORY_OPTIMIZED TEMPDB_METADATA=OFF;
为了使更改生效,需要重新启动 SQL Service。
0 notes
Text
Kiểm tra Stored Proceduce trên SQL Server chạy quá lâu - Tutorials Blog
Kiểm tra Stored Proceduce trên SQL Server chạy quá lâu
Câu select để kiểm tra trên SQL Server xem Stored Proceduce đang chạy quá lâu
SELECT t.* FROM sys.dm_exec_requests AS r CROSS APPLY sys.dm_exec_sql_text(r.sql_handle) AS t WHERE database_id = 5 -- modify this value with your actual spid and r.sql_handle is not null
0 notes
Link
SQL blocking means that one or multiple SQL queries are waiting for resources that are locked by another SQL Query. SQL blocking can affect data throughput and SQL Server responsiveness significantly. SQL Server response time is a measure that shows how long the end user that has executed a query must wait until he gets a response. So, in case that a query is doing nothing while waiting on another query to release the lock on the target resource, the response time increases thus making the SQL Server less responsive.
At the other hand, when talking about the data throughput, the measure is the number of simultaneous users who are logged and execute their queries in parallel without slowing down the SQL Server. Moreover, this is the SQL Server performance parameter that could be severely affected when blocking chain occurs. In scenarios were complex blocking chains occurs where one SQL query blocks another, and that query then blocks the third one, and the third one blocks the fourth one, and so on the blocking of the critical SQL Server resources for a prolonged time could occur. That creates a sort of artificial serialization in accessing key resources to the level where only one or eventually two users are effectively using SQL Server at one time.
Both of these scenarios are something that should be avoided and prevented.
SQL Server blocking is hard to identify and troubleshoot as it is hard to predict such behavior during development when only a limited number of users, quite often only one or two, are executing and testing the queries against the SQL Server at the same time. It is even worse to predict the situations where a single rarely executed query can cause a lengthy and complex blocking chain, making the troubleshooting process of bad SQL Server performance caused by such a rare and complex blocking chain annoying and often without results.
For more information SQL Server blocking read the Techniques to identify blocking queries and causes of SQL Server blocks article.
As it can be seen in the article, establishing the SQL Server blocks monitoring and tracking of even simple SQL Server blocks is not an easy and straightforward process. Even when the significant time is invested, results could be vague in most cases.
The situation where blocking chain is the cause of the issue is even more complicated for monitoring and troubleshooting. It’s quite tough to pinpoint the head blocker of the blocking chain when there are a number of processes involved. Moreover, if we add the possibility that deadlocks could be involved in the blocking chain as well, there could be quite a mess that has to be resolved and tracked.
Just as an example of the blocking chain, the scenario where a chain of the three SQL blocking processes will be simulated. Simulating such a blocking chain requires four separate connections to the SQL Server database to be created. That means that each query must be executed from a separate query tab in the SQL Server Management Studio. The Adventure Works database will be used in the blocking chain example.
SSMS tab1:
In this window, the query will start a transaction that will select from the database table and then for the purpose of easier simulation the waitfor delay command will be executed to create the 15 seconds wait for more comfortable work and unambiguous results presentation. The query will force the locks just for the purpose of the presentation. Otherwise, that is not recommended without a very particular reason.
begin tran select * from [Person].[Person] with (tablock, holdlock, xlock) waitfor delay '00:00:15' commit tran
SSMS tab2:
The query in tab 2 should be executed immediately after the previous query in tab 1. The transaction will try to select from the same table, and that will conflict with the transaction in the tab1 that holds the lock.
select * from [Person].[Person]
SSMS tab3:
Finally, in tab 3 the select query will be executed after the tab 2 query, and it will conflict with the query in the tab 2.
select * from [Person].[Person]
SSMS tab4:
This query in tab 4 is designed to display the active SQL blocking and should be executed after the query in tab 3 is executed. In our example, SQL Server used for this example had a very few active processes, so we were able to get insight straight into results.
Select Session_ID,Blocking_Session_ID From Sys.DM_Exec_Requests Where Session_ID > 50 And Blocking_Session_Id <> 0
What we can see from this result is that session 65 is waiting for session 56 to release the lock it holds on the resource, and it can be seen that session 56 is waiting for session 55 to release the acquired lock. Moreover, it is evident that session 52 is not waiting for anything, so one could assume that session 52 is the root cause of the SQL blocking or the so-called head blocker.
While this could look like a simple to troubleshoot, it is not the case in the real world. Production servers might have hundreds or thousands processes where numerous blocks could occur and blocking chains could reach tens of levels. Analyzing such results manually and figuring out relations and connections between processes cod take a lot of time and are prone to mistakes or misinterpretations.
At the top of that, this is not the information that is stored somewhere, so it doesn’t allow any insight into the history and frequency of SQL blockings and blocking chains.
Use ApexSQL Monitor to resolve SQL blocking
ApexSQL Monitor SQL blocking and blocking chain tracks are parts of the Query waits feature, or to better say the sub-features of the Query wait feature.
To access the blocking chain section of the Query waits feature:
Select the SQL Server that should be checked for the blocking chain in the server explorer pane on the left
From the Instance dashboard, select the Waits link in the Query section
In the Query waits page, select the Blocking chain radio button
If SQL blocking exists in the selected SQL Server, the information about the blocking chains displays
ApexSQL Monitor displays each SQL Server block in a hierarchical form that allows displaying the relations between all blocked and blockers SPIDs in a SQL blocking chain. The head blockers are displayed by default as they consist of the top nodes in the blocking chain hierarchy. The blocked SPIDs are displayed as parts of the sub-nodes in the blocking chain.
To check the blocked SPIDs, expand the blocking chain using the arrow icon left of the head blocker grid row:
The blocked SPIDs are nested underneath the head blocker, and any subsequent SPID is nested beneath its blocker in the chain, and it can be drilled down the chain by expanding any new subsequent SQL blocking where exists. Such an approach ensures the complete insight in the blocking chain at a first glance.
For each blocker and blocked query, ApexSQL Monitor allows reviewing details about that particular query by expanding the table via the arrow icon on the far right of the row.
The information in the Query details tab contains information about the query involved in the blocking chain that includes the wait type involved, wait time as well as the wait resource.
To help understand the Wait resource details and the way to decipher those, check the article INF: Understanding and resolving SQL Server blocking problems
As SQL blocking is a situation where a process is forced to wait another process to release the acquired lock, SQL Server logs that via the LCK_M_XXX wait type. The adequate wait type will be displayed, in accordance with what lock type blocked queries are waiting to acquire. Click the wait type link to display the helper pop up window with details related to that wait type as well as advice on potential resolution and links to external resources where some additional information about the involved wait type could be researched.
The SQL Text tab contains the full T-SQL of the query.
An additional ability of the block chain feature is that it allows the user to decide whether to display or not the blocking chains where the deadlock as a unique form of SQL blocking is involved. Unticking the Deadlock check box displays only the blocking chains where deadlocks are not involved. By default, the ApexSQL monitor displays all blocking chains including the ones where the deadlock is involved. In addition, each such blocking chain is marked with red DEADLOCK marking, as all blocking chains where the deadlocks are involved requires the special attention.
Quick tip:
The information about the deadlock involvement and ability to filter out blocking chains where deadlock is involved is possible only if the deadlock monitoring is turned on. To learn how to enable deadlock monitoring and track the deadlocks, read How to configure and use deadlock monitoring
Another way to access the blocking chain of interest is via the Blocked section of the Query waits page. While analyzing the blocked queries, if there is a need for a particular query to get details about its involvement in the blocking chain and how it is involved, use the Blocking chain link in the details of that blocked query details.
That will drill down to the specific blocking chain in the Blocking chain section that involves that particular SQL blocking situation.
In this way, only the particular blocking chain related to that particular SQL blocking will be displayed. That could be very useful for reducing the noise that other blocking chains could cause when analysis of the particular blocking chain situation is required.
0 notes
Text
Check progress of shrink database
Its very simple. Open management studio create a new query on the instance where is the database that you are shrinking and paste this query:
Select percent_complete, status, command , estimated_completion_time from sys.dm_exec_requests
And find dbccfilescompact
View On WordPress
0 notes
Link
sys.dm_exec_requests sys.dm_tran_locks sys.dm_exec_sessions
0 notes
Text
Check running SQL queries in SQL Server
Check running SQL queries in SQL Server
Check running SQL queries in SQL Server Check the currently running SQL Queries in SQL Server SELECT sqltext.TEXT, req.session_id, req.status, req.command, req.cpu_time, req.total_elapsed_time FROM sys.dm_exec_requests req CROSS APPLY sys.dm_exec_sql_text(sql_handle) AS sqltext OR select text, SUBSTRING(st.text, (qs.statement_start_offset/2)+1, ((CASE qs.statement_end_offset WHEN -1 THEN…
View On WordPress
0 notes
Text
Find current long SQL Queries in MS SQL Server
Find current long SQL Queries in MS SQL Server
Find current long SQL Queries in SQL Server Find the current running long SQL Queries in MS SQL Server SELECT r.session_id, st.TEXT AS batch_text, r.start_time, r.status, r.total_elapsed_time FROM sys.dm_exec_requests AS r CROSS APPLY sys.dm_exec_sql_text(r.sql_handle) AS st WHERE DB_NAME(r.database_id) = 'AdventureWorks2022' ORDER BY cpu_time DESC; Find the current long-running SQL Queries in…
View On WordPress
0 notes