#sys.dm_exec_sql_text
Explore tagged Tumblr posts
Visit Tumblr Blog
Explore Tumblr blogs with no restrictions, modern design and the best experience.
Last Seen Tumblr Blogs


Fun Fact
The KCSC sent more than 20K requests to delete posts related to prostitution and porn to Tumblr from January to June 2017.
Text
Check long running queries in SQL Server
Check the SQL statements having high elapsed time in SQL Server SELECT text AS QueryText, total_elapsed_time / 1000 AS DurationMs FROM sys.dm_exec_requests r CROSS APPLY sys.dm_exec_sql_text(r.sql_handle) order by 2 desc; Identifies slow running queries in SQL…
0 notes
Text
T-SQL: Find the currently running queries in sql server
T-SQL: Find the currently running queries in sql server
Hi Friends,
Hope, you are doing fine!
Please find below the T-SQL script to find the T-SQL batches/queries/statements, which is/are still running as on current time on a SQL Server instance!
T-SQL Script:
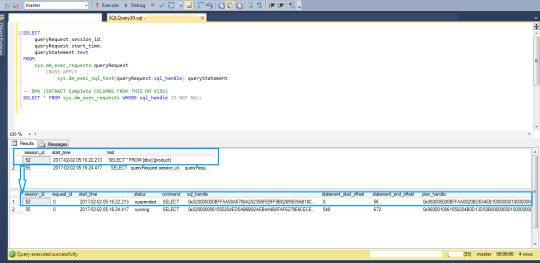
SELECT queryRequest.session_id, queryRequest.start_time, queryStatement.text FROM sys.dm_exec_requests queryRequest CROSS APPLY sys.dm_exec_sql_text(queryRequest.sql_handle) queryStatement GO;…
View On WordPress
#DMVs#Dynamic Management Views#Find the currently running queries in sql server#sys.dm_exec_requests#sys.dm_exec_sql_text#T-SQL Scripts
0 notes
Text
SQL Server 2019 TempDB 配置为内存优化的数据库

要在 SQL Server 中启用 TempDB 功能,需要执行两个步骤,第三个步骤是可选的:
要更改服务器配置,请运行以下 T-SQL:
ALTER SERVER CONFIGURATION SET MEMORY_OPTIMIZED TEMPDB_METADATA=ON;
重新启动 SQL Service
您还可以使用 sp_configure 通过以下 T-SQL 设置内存优化的 TempDB 元数据参数:
EXEC sys.sp_configure N'show advanced options’, 1;
RECONFIGURE WITH OVERRIDE;
EXEC sys.sp_configure N'tempdb metadata memory-optimized’, 1;
RECONFIGURE WITH OVERRIDE;
可以用下面的代码查看TempDB 元数据内存优化参数是否启用:
SELECT SERVERPROPERTY('IsTempDBMetadataMemoryOptimized') AS IsTempDBMetadataMemoryOptimized;
输出 “1” 表示在 SQL Server 实例上启用了内存优化的 TempDB。
您还可以使用 sp_configure 和 sys.configuration 系统视图检查配置:
EXEC sp_configure ‘tempdb metadata memory-optimized’
select * From sys.configurations where name like ’%tempdb%’
让我们强调一下使用 OStress 实用程序 SQL Server。 在本节中,您可以看到使用 OStress 命令施加的繁重工作负载。
在这种情况下,将运行上述相同的 OStress 命令实用程序(重新执行批处理文件��,并在下面的代码段中捕获输出。
下面的 T-SQL 脚本用于查找 SQL Server 实例上当前正在运行的查询。 在 T-SQL 中,您还可以看到使用了一个新的动态托管函数来查看页面分配和页面资源的 wait_types 详细信息。
SELECT
req.session_id,
req.wait_type,
req.wait_resource,
OBJECT_NAME(inf.[object_id], inf.database_id) as [object_name],
req.blocking_session_id,
req.command,
SUBSTRING(txt.text,
(
req.statement_start_offset / 2
)
+ 1,
(
(
CASE
req.statement_end_offset
WHEN
- 1
THEN
DATALENGTH(txt.text)
ELSE
req.statement_end_offset
END
- req.statement_start_offset) / 2
)
+ 1) AS statement_text, inf.database_id, inf.[file_id], inf.page_id, inf.[object_id], inf.index_id, inf.page_type_desc
FROM
sys.dm_exec_requests AS req
CROSS APPLY sys.dm_exec_sql_text(req.sql_handle) AS txt
CROSS APPLY sys.fn_PageResCracker (req.page_resource) AS pgc
CROSS APPLY sys.dm_db_page_info(pgc.[db_id], pgc.[file_id], pgc.page_id, 'DETAILED’) AS inf
WHERE
req.wait_type like ’%page%’
在以下代码片段中,我们可以看到管理 TempDB 表没有争执。
在以下代码段中,您看到具有 100 个用户连接和 30 个并发执行的 SP 执行仅花费了 31 秒即可完成。
To disable MEMORY_OPTIMIZED TEMPDB_METADATA run the following T-SQL:
要禁用 MEMORY_OPTIMIZED TEMPDB_METADATA,请运行以下 T-SQL:
ALTER SERVER CONFIGURATION SET MEMORY_OPTIMIZED TEMPDB_METADATA=OFF;
为了使更改生效,需要重新启动 SQL Service。
0 notes
Text
Handy - SQL Scripts to show high CPU usage
The first query will order the results based on the queries that have used the most CPU time since the SQL Server instance has been restarted (or the server has been rebooted). The second query orders the results based upon the average CPU time that each query takes. — Find queries that take the most CPU overall SELECT TOP 50 ObjectName = OBJECT_SCHEMA_NAME(qt.objectid,dbid) + '.' + OBJECT_NAME(qt.objectid, qt.dbid) ,TextData = qt.text ,DiskReads = qs.total_physical_reads --The worst reads, disk reads ,MemoryReads = qs.total_logical_reads -- Logical Reads are memory reads ,Executions = qs.execution_count ,TotalCPUTime = qs.total_worker_time ,AverageCPUTime = qs.total_worker_time/qs.execution_count ,DiskWaitAndCPUTime = qs.total_elapsed_time ,MemoryWrites = qs.max_logical_writes ,DateCached = qs.creation_time ,DatabaseName = DB_Name(qt.dbid) ,LastExecutionTime = qs.last_execution_time FROM sys.dm_exec_query_stats AS qs CROSS APPLY sys.dm_exec_sql_text(qs.sql_handle) AS qt ORDER BY qs.total_worker_time DESC— Find queries that have the highest average CPU usage SELECT TOP 50 ObjectName = OBJECT_SCHEMA_NAME(qt.objectid,dbid) + ‘.’ + OBJECT_NAME(qt.objectid, qt.dbid) ,TextData = qt.text ,DiskReads = qs.total_physical_reads — The worst reads, disk reads ,MemoryReads = qs.total_logical_reads –Logical Reads are memory reads ,Executions = qs.execution_count ,TotalCPUTime = qs.total_worker_time ,AverageCPUTime = qs.total_worker_time/qs.execution_count ,DiskWaitAndCPUTime = qs.total_elapsed_time ,MemoryWrites = qs.max_logical_writes ,DateCached = qs.creation_time ,DatabaseName = DB_Name(qt.dbid) ,LastExecutionTime = qs.last_execution_time FROM sys.dm_exec_query_stats AS qs CROSS APPLY sys.dm_exec_sql_text(qs.sql_handle) AS qt ORDER BY qs.total_worker_time/qs.execution_count DESC
0 notes
Text
DMV - SPROC with the highest average CPU
This handy bit of code shows the stored procedures with the highest average CPU time in SQL Server.. SELECT TOP 50 * FROM(SELECT OBJECT_NAME(s2.objectid) AS ProcName,SUM(s1.total_worker_time/s1.execution_count) AS AverageCPUTime,s2.objectid,SUM(execution_count) AS execution_countFROM sys.dm_exec_query_stats AS s1CROSS APPLY sys.dm_exec_sql_text(sql_handle) AS s2GROUP BY OBJECT_NAME(s2.objectid),objectid) xWHERE OBJECTPROPERTYEX(x.objectid,'IsProcedure') = 1AND EXISTS (SELECT 1 FROM sys.procedures sWHERE s.is_ms_shipped = 0AND s.name = x.ProcName )ORDER BY AverageCPUTime DESC
0 notes
Text
Handy - SQL Scripts to show high CPU usage
The first query will order the results based on the queries that have used the most CPU time since the SQL Server instance has been restarted (or the server has been rebooted). The second query orders the results based upon the average CPU time that each query takes. — Find queries that take the most CPU overall SELECT TOP 50 ObjectName = OBJECT_SCHEMA_NAME(qt.objectid,dbid) + '.' + OBJECT_NAME(qt.objectid, qt.dbid) ,TextData = qt.text ,DiskReads = qs.total_physical_reads --The worst reads, disk reads ,MemoryReads = qs.total_logical_reads -- Logical Reads are memory reads ,Executions = qs.execution_count ,TotalCPUTime = qs.total_worker_time ,AverageCPUTime = qs.total_worker_time/qs.execution_count ,DiskWaitAndCPUTime = qs.total_elapsed_time ,MemoryWrites = qs.max_logical_writes ,DateCached = qs.creation_time ,DatabaseName = DB_Name(qt.dbid) ,LastExecutionTime = qs.last_execution_time FROM sys.dm_exec_query_stats AS qs CROSS APPLY sys.dm_exec_sql_text(qs.sql_handle) AS qt ORDER BY qs.total_worker_time DESC— Find queries that have the highest average CPU usage SELECT TOP 50 ObjectName = OBJECT_SCHEMA_NAME(qt.objectid,dbid) + ‘.’ + OBJECT_NAME(qt.objectid, qt.dbid) ,TextData = qt.text ,DiskReads = qs.total_physical_reads — The worst reads, disk reads ,MemoryReads = qs.total_logical_reads –Logical Reads are memory reads ,Executions = qs.execution_count ,TotalCPUTime = qs.total_worker_time ,AverageCPUTime = qs.total_worker_time/qs.execution_count ,DiskWaitAndCPUTime = qs.total_elapsed_time ,MemoryWrites = qs.max_logical_writes ,DateCached = qs.creation_time ,DatabaseName = DB_Name(qt.dbid) ,LastExecutionTime = qs.last_execution_time FROM sys.dm_exec_query_stats AS qs CROSS APPLY sys.dm_exec_sql_text(qs.sql_handle) AS qt ORDER BY qs.total_worker_time/qs.execution_count DESC
0 notes
Text
Kiểm tra Stored Proceduce trên SQL Server chạy quá lâu - Tutorials Blog
Kiểm tra Stored Proceduce trên SQL Server chạy quá lâu
Câu select để kiểm tra trên SQL Server xem Stored Proceduce đang chạy quá lâu
SELECT t.* FROM sys.dm_exec_requests AS r CROSS APPLY sys.dm_exec_sql_text(r.sql_handle) AS t WHERE database_id = 5 -- modify this value with your actual spid and r.sql_handle is not null
0 notes
Link
This article will provide an overview of ad-hoc query use in SQL Server, the potential resulting problems as well as how to detect and remediate them.
Background
Despite the many warnings about ad-hoc queries vulnerability to SQL injection attacks and the potential performance degradation compared to use of stored procedures, ad-hoc queries are still used quite a bit. For developers, the ad-hoc query is more flexible and more familiar than compiling the stored procedures since it allows them to create the string using concatenation easily, and execute it against the database. For example:
var adhocQuery = "SELECT * FROM test_table WHERE id = " + UserId ;
Ad-hoc queries are dynamic aka “on the fly” queries that are treated entirely different queries by SQL Server for every execution. The side effect of ad-hoc queries is that SQL Server does nor reuse such statements and instead it adds those to the procedure cache. As a consequence, on a system with significant traffic intensity, this can cause that procedure cache became bloated causing flushing the data from the buffer cache and thus forcing the SQL Server to read more data straight from the physical disk instead of from memory. The result could be a severe performance problem that can slow down SQL Server severely due to a created I/O bottleneck
Now, an ad-hoc query is not something that have to be avoided in all cases, and occasional use can be legitimate, but one should avoid to use them in some iterative cursor or RBAR (Row By Agonizing Row) processes
To illustrate the ad-hoc query check the following T-SQL (it can easily find its use in everyday work for testing purposes as well)
DECLARE @tablesCount INT, @rowsCount INT, @tablename VARCHAR(100), @EMP_ID integer, @BIRTH_DATE date, @WAGE integer, @CREDIT_CARD integer, @EMP_NAME varchar(10) SET @tablesCount = 0 WHILE (@tablesCount < 2) -- set the number of tables you want to be created BEGIN SET @tablesCount = @tablesCount + 1 SET @tablename = 'Table' + cast(@tablesCount as CHAR) PRINT 'Created table: ' + @tableName EXEC('CREATE TABLE ' + @tablename + '( EMP_ID integer, BIRTH_DATE date, WAGE integer, CREDIT_CARD integer, EMP_NAME varchar(10))') SET @rowsCount = 0 WHILE (@rowsCount < 5) -- set the number of rows to be populated in each table BEGIN SET @rowsCount = @rowsCount + 1 SET @EMP_ID = @rowsCount SET @BIRTH_DATE = DATEADD(d,-((18 * 365) + ABS(CONVERT(int,CONVERT(binary(4),NEWID())))/2147483648. * (47 * 365)),DATEADD(d,0,DATEDIFF(d,0,GETDATE()))) SET @WAGE = CONVERT(int,50000 + ABS(CONVERT(int,CONVERT(binary(4),NEWID())))/2147483648.*90000) SET @CREDIT_CARD = CONVERT(int,5000000 + ABS(CONVERT(int,CONVERT(binary(4),NEWID())))/21474648. * 9000000) SET @EMP_NAME = REPLACE(REPLACE(REPLACE(REPLACE(REPLACE(REPLACE(REPLACE(REPLACE(REPLACE(REPLACE(CONVERT(varchar(10), ABS(CONVERT(int,CONVERT(binary(4),NEWID())))) ,'1','a'),'2','b'),'3','c'),'4','d'),'5','e'),'6','f'),'7','g'),'8','h'),'9','i'),'0','j') EXEC ('INSERT INTO ' + @tablename + ' VALUES (' + @EMP_ID + ', ' + '''' + @BIRTH_DATE + ''', ' + @WAGE + ', ' + @CREDIT_CARD + ', ' + '''' + @EMP_NAME + ''')') END END
The query itself creates the desired number of tables in the database and populate each table with the desired number of rows with randomly generated data
The query uses dynamic SQL strings as for each variable in this query it hardcodes the generated value into that string. So, when the string (highlighted parts of the query) is executed using the EXEC command, the SQL Server must create a new query plan for every EXEC iteration because the string and values passed to the EXEC command are always different
So after executing the query (it creates 2 tables and then populates each with 5 rows of data), and as it can be seen it created 10 execution plans
This query could be easily set to generate tens or hundreds of thousands of data rows (which will be demonstrated later in the article), and as a consequence ad-hoc queries could flood the execution plan cache with hundreds of thousands single-use copies of the very same query execution plan, where SQL Server has to involve additional work to compile and store each plan. That could severely affect the performance of SQL Server
Analyzing ad-hoc query cost and the impact on SQL Server performance
Generating a significant number of cached execution plans plan that are used only once takes up much space, wastes SQL Server resources and often results in SQL Server contention. Use of Performance Monitor counters could be the way to investigate the source of such issues.
Performance Monitor is a Windows performance monitoring tool suited with a broad range of metrics for monitoring performance of CPU, disk, memory, and network, but it is also equipped with a variety of SQL Server performance metrics.
Performance Monitor is a “live” tool that does not store the performance metric data anywhere, and therefore it is not always easy to track and compare performance data. One way is to create Performance Monitor snapshots at specified intervals and then to compare the results. So unless during the testing or in known situations, it is not a practical and reliable way of performing the analysis of the ad-hoc query issues
Another approach is using DMVs to analyze the impact of ad-hoc query use via analysis of the cached query execution plans and associated queries. All ad-hoc query execution plans are captured and stored in the plan cache, and by rule, the ad-hoc query creates the so-called single-use query execution plan.
One approach to analyze ad-hoc query cost is determining the ratio between the multi-use and single-use query execution plans cached in SQL Server per each database
SELECT Db_Name(QueryText.dbid) AS database_name, Sum(CASE WHEN ExecPlans.usecounts = 1 THEN 1 ELSE 0 END) AS Single, Sum(CASE WHEN ExecPlans.usecounts > 1 THEN 1 ELSE 0 END) AS Reused, Sum(ExecPlans.size_in_bytes) / (1024) AS KB FROM sys.dm_exec_cached_plans AS ExecPlans CROSS APPLY sys.dm_exec_sql_text(ExecPlans.plan_handle) AS QueryText WHERE ExecPlans.cacheobjtype = 'Compiled Plan' AND QueryText.dbid IS NOT NULL GROUP BY QueryText.dbid;
Another way that can provide some insight into the potential issues related to the ad-hoc query use is to determine the percent of ad-hoc queries that are executed on the target SQL Server.
The following query can be used for that, and it returns the
SELECT Convert(INT,Sum ( CASE a.objtype WHEN 'Adhoc' THEN 1 ELSE 0 END) * 1.00/ Count(*) * 100 ) as 'Ad-hoc query %' FROM sys.dm_exec_cached_plans AS a
The example of the query result:
A single execution of this query indicates that 82% of queries executed on SQL Server are an ad-hoc query, so depending on the expected value and application design, such result could indicate that there is a need for closer inspection of the application design.
However, for getting some more reliable information regarding the potential ad-hoc query impact on SQL Server, this query should be scheduled and results collected and stored so that they can be analyzed and compared over the time. But none of those allow relevant and measurable analysis of the actual impact that ad-hoc query use imposes on SQL Server performance
Using ApexSQL Monitor to investigate potential issues with ad-hoc query use (and abuse)
It is not unexpected that plans stored in the plan cache could be used differently. While some query plans are used quite frequently, there are query plans used just a few times, or just once. The SQL Server cache management is efficient, and it allows occasional ad-hoc query use of without causing some overhead on SQL Server.
On the other hand, frequent and extensive ad-hoc query use could utilize SQL Server resources at the level that SQL Server cache management can’t handle efficiently. In such situations it is possible that SQL Server flushes from the cache some critical and frequently used query plans.
Apex SQL Monitor can track two most important metrics that are used as an indication of the issues related to ad-hoc query overuse and when the SQL Server is affected by ad-hoc queries: Compilations/sec and Batch Requests/sec
The Batch Request/sec metric is explained in details in the SQL Server performance counters (Batch Requests/sec or Transactions/sec): what to monitor and why article, so it won’t be elaborated on further, in this article
The Compilations/sec metric indicates the number of query compilations and/or recompilations in a monitored SQL Server instance. When Compilations/sec metric reaches a high number, it could be an indication that SQL Server is under the high workload and that it is affected by more compilations and recompilation than it is expected or necessary. The high numbers of compilations could impose the overhead on SQL Server performance
However, Compilations/sec metric when used independently, even when it has high values, doesn’t tell whether the system is affected due to excessive ad-hoc query use, unless it is coupled with Batch Requests/sec
The general rule of thumb for the ratio between those two metrics is that Compilations/sec value should stay at up to 10% of the Batch Requests/sec value. 10% is just a guideline, and it should not be taken as an exact value that always indicates the issue if breached
ApexSQL Monitor tracks both SQL Server performance metrics and stores the metric values in the repository database, so the values of those metrics can be analyzed over various periods for various SQL Server performance behaviors
To access those metrics in ApexSQL Monitor for the monitored server:
Select the desired SQL Server in the server explorer pane on the left side or click on the SQL Server name in the main dashboard. That will open the instance dashboard
In the SQL Server section click on the Details link to open the SQL Server metric charts page
Charts for both metrics are located at the top of the SQL Server metrics page
When the SQL Server is in normal working condition, the chars should have some values that are close to the mentioned 10% rule of thumb
As it is already explained, values for those metrics could vary significantly depending on the system and the application design, so it is recommended to baseline those metrics. Baselining those metrics could provide much better insight into “good” and “bad” values
For this article, a bit extreme example will be presented to demonstrate the situation where the ad-hoc query would cause the pressure on SQL Server and performance degradation
The query that executes a significant number of ad-hoc queries by inserting the random data in tables will be used
DECLARE @tablesCount INT, @rowsCount INT, @tablename VARCHAR(100), @ZAP_ID integer, @DATUM_RODJENJA date, @PLATA integer, @CREDITNA_CARTICA integer, @IME_ZAP varchar(10) SET @tablesCount = 0 WHILE (@tablesCount < 2) -- set the number of tables you want to be created BEGIN SET @tablesCount = @tablesCount + 1 SET @tablename = 'Table' + cast(@tablesCount as CHAR) PRINT 'Created table: ' + @tableName EXEC('CREATE TABLE ' + @tablename + '( ZAP_ID integer, DATUM_RODJENJA date, PLATA integer, CREDITNA_CARTICA integer, IME_ZAP varchar(10))') SET @rowsCount = 0 WHILE (@rowsCount < 2000000) -- set the number of rows to be populated in each table BEGIN SET @rowsCount = @rowsCount + 1 SET @ZAP_ID = @rowsCount SET @DATUM_RODJENJA = DATEADD(d,-((18 * 365) + ABS(CONVERT(int,CONVERT(binary(4),NEWID())))/2147483648. * (47 * 365)),DATEADD(d,0,DATEDIFF(d,0,GETDATE()))) SET @PLATA = CONVERT(int,50000 + ABS(CONVERT(int,CONVERT(binary(4),NEWID())))/2147483648.*90000) SET @CREDITNA_CARTICA = CONVERT(int,5000000 + ABS(CONVERT(int,CONVERT(binary(4),NEWID())))/21474648. * 9000000) SET @IME_ZAP = REPLACE(REPLACE(REPLACE(REPLACE(REPLACE(REPLACE(REPLACE(REPLACE(REPLACE(REPLACE(CONVERT(varchar(10), ABS(CONVERT(int,CONVERT(binary(4),NEWID())))) ,'1','a'),'2','b'),'3','c'),'4','d'),'5','e'),'6','f'),'7','g'),'8','h'),'9','i'),'0','j') EXEC ('INSERT INTO ' + @tablename + ' VALUES (' + @ZAP_ID + ', ' + '''' + @DATUM_RODJENJA + ''', ' + @PLATA + ', ' + @CREDITNA_CARTICA + ', ' + '''' + @IME_ZAP + ''')') END END
The query creates two tables and populates each table with 2,000,00 rows using a dynamic ad-hoc query
Now, let’s see how the SQL Server behaves when the above query is executed
Before it is executed, the look at the SQL Server metric reveals the quite normal situation with both metrics that we are monitoring
The shot displays the period of 1 day period in charts, and as it can be seen, all values are within the calculated baselines.
A close look at the 30 minutes chart reveals the same situation for both metrics.
Now, we will execute the query and wait some time until it executes. After some 30 minutes of collecting the metrics, data let’s check the charts again
Moreover, now we have a significantly different situation. Pay attention to the values of Compilations per second metric. Values are around 9,000 compilations per second, while at the same time Batch requests per second values are more or less similar and within the calculated baseline
A closer look at each metric …
It is evident that in this particular case, the Compilations per second chart cannot even display the baseline due to very high values caused by the executed query
If we select the time frame that covers the period before and after the query execution, we can notice the following situation
Here it can be seen the significant increase of Compilations per second metric values after a large number of ad-hoc queries have executed on monitored SQL Server
If we use the large chart view of Compilations per the second with the baseline turned on, and use the zoom functionality to isolate the period before and after the test query is executed:
The zoom bar below the chart is with a focus to the period before the test query is executed and the standard Compilations per second values that are within the calculated baseline are displayed
Moreover, if we expand the zoom area on the right
We can see now that the test query caused that Compilations per second values started to increase significantly, reaching the very high values, thus suppressing even the ability of the chart to display the calculated baseline
The example evaluated here is a bit extreme, but it is something that can be seen in real-world situations, as there are still a lot of old-fashion applications that are based around ad-hoc query use
So, what to be checked when a situation like this is experienced that could help in resolving the ad-hoc query pressure?
Check that the plan cache is not recently cleared. If it is, then such a situation could be only temporary
Is there an option to use parameterized SQL queries instead of passing them in strings for execution?
Check if it is safe to implement forced parametrization to overcame the query plan reuse problem. However, be careful with this can have an adverse effect as explained in Forced Parameterization Can Lead to Poor Performance
Check that object-relational mapping (ORM) is not out of date
Check whether the application uses Table-Valued Parameters in Remote procedure call (RPC) mode. For additional details on this check Use Table-Valued Parameters (Database Engine)
0 notes
Text
Tame that query, part 2
In part one, I discussed the performance issues that we were having at KCF with one of our SQL databases. In this post, I’ll discuss how we identified the queries that were most problematic.
Finding problematic queries
The first we needed to do was identify if there 2 or 3 problematic queries that might be causing the bulk of the load on the server. If we could identify a handful of bad queries, we could then either optimize the queries or possibly cache them in Redis.
To find the problem queries, we ran the following SQL query.
SELECT TOP 10 SUBSTRING(qt.TEXT, (qs.statement_start_offset/2)+1, ((CASE qs.statement_end_offset WHEN -1 THEN DATALENGTH(qt.TEXT) ELSE qs.statement_end_offset END - qs.statement_start_offset)/2)+1), qs.execution_count, qs.total_logical_reads, qs.last_logical_reads, qs.total_logical_writes, qs.last_logical_writes, qs.total_worker_time, qs.last_worker_time, qs.total_elapsed_time/1000000 total_elapsed_time_in_S, qs.last_elapsed_time/1000000 last_elapsed_time_in_S, qs.last_execution_time, qs.creation_time, DATEDIFF(MINUTE, qs.creation_time, GETDATE()) as plan_age, qp.query_plan FROM sys.dm_exec_query_stats qs CROSS APPLY sys.dm_exec_sql_text(qs.sql_handle) qt CROSS APPLY sys.dm_exec_query_plan(qs.plan_handle) qp ORDER BY qs.total_worker_time DESC
This query will bring back a table that shows the most expensive queries sorted by total_worker_time. Total_worker_time is the total CPU time spent running the query in microseconds. Looking through the list, you'll quickly identify the most expensive queries that you should focus on.
Analyzing the bad queries
If you run the above query in SQL Server Management Studio (SSMS), you’ll see a link in the final column to the actual query plan like so:

By clicking on one of these links, you can see the actual query plan that SQL server will use to execute the query. This is where specific performance issues can be identified. Perhaps I’ll discuss reading query execution plans in another post, but below are a couple things to look for.
SELECT TOP 1000 Hierarchy FROM Groups WHERE Hierarchy LIKE '/a%'

The query plan above shows a query that takes advantage of an index called IX_Hierarchy to return the requested data. Because it is an Index Seek, it uses the index efficiently without any excess disk or CPU I/O. However, an innocent enough change in the query like the following can have significant performance ramifications.
SELECT TOP 1000 Hierarchy FROM Groups WHERE LOWER(Hierarchy) LIKE '/a%'

By simply changing the predicate to have the LOWER() function, we remove the ability of SQL to seek the IX_Hierarchy index, it now must instead do an Index Scan which in this case takes 10 times as long as the seek.
To compare the effects of changes to queries, place the original query and the changed query in a new query window in SSMS and click the Actual Execution Plan button.

After executing a query, the query plans used to execute them will be shown in a new tab in the Results window. This will show the query plans and importantly, the Query cost relative to eachother, a lower cost is better.

Reading and optimizing query plans could be the topic of an entire series of blog posts and spending time understanding them can be quite beneficial.
In the next post, I’ll talk about some things we did at KCF to optimize some of our worst queries.
0 notes
Text
SQL de neler oluyor? CPU yoran sorguları görüntülemek
Merhaba,
Yazılım veya web sitesi vb. fazla olarak yavaşladı. Çeşitli kontroller yaptınız problem SQL üzerinden görünüyor. CPU %100 olarak çalışıyor. Görev yöneticisinde ilginç bir şeyler var... Bir nedeni de sitenize SQL sorgusu atılıyor olabilir (atak yapılıyor)
Bu tarz problemler yaşadığınızda SQL üzerinden yapacağınız kontrollerin querylerini vereceğim. İlk olarak bunları kontrol etmeniz gerekiyor.
CPU yu en çok yoran 10 sorguyu bulmak için:
SELECT TOP 10
QT.TEXT AS STATEMENT_TEXT,
QP.QUERY_PLAN,
QS.TOTAL_WORKER_TIME AS CPU_TIME
FROM SYS.DM_EXEC_QUERY_STATS QS
CROSS APPLY SYS.DM_EXEC_SQL_TEXT (QS.SQL_HANDLE) AS QT
CROSS APPLY SYS.DM_EXEC_QUERY_PLAN (QS.PLAN_HANDLE) AS QP
ORDER BY TOTAL_WORKER_TIME DESC
CPU yu en çok yoran disk yazma okuma sorgularını bulmak için:
top 10 sorgu
SELECT TOP 10
TOTAL_LOGICAL_READS,
TOTAL_LOGICAL_WRITES,
EXECUTION_COUNT,
TOTAL_LOGICAL_READS+TOTAL_LOGICAL_WRITES AS [IO_TOTAL],
QT.TEXT AS QUERY_TEXT,
DB_NAME(QT.DBID) AS DATABASE_NAME,
QT.OBJECTID AS OBJECT_ID
FROM SYS.DM_EXEC_QUERY_STATS QS
CROSS APPLY SYS.DM_EXEC_SQL_TEXT(SQL_HANDLE) QT
WHERE TOTAL_LOGICAL_READS+TOTAL_LOGICAL_WRITES > 0
ORDER BY [IO_TOTAL] DESC
CPU yu yoran en çok sorgu çalıştıran işlemler
SELECT QS.EXECUTION_COUNT,
QT.TEXT AS QUERY_TEXT,
QT.DBID,
DBNAME= DB_NAME (QT.DBID),
QT.OBJECTID,
QS.TOTAL_ROWS,
QS.LAST_ROWS,
QS.MIN_ROWS,
QS.MAX_ROWS
FROM SYS.DM_EXEC_QUERY_STATS AS QS
CROSS APPLY SYS.DM_EXEC_SQL_TEXT(QS.SQL_HANDLE) AS QT
ORDER BY QS.EXECUTION_COUNT DESC
Umarım işinize yarar. Kolay gelsin.
from Aybar Dumlu - Blog, Friends, Familiar https://ift.tt/2qXGZls via IFTTT
0 notes
Text
Get the latest queries run in an SQL Server database
SELECT TOP 50 * FROM(SELECT COALESCE(OBJECT_NAME(s2.objectid),'Ad-Hoc') AS ProcName, execution_count,s2.objectid, (SELECT TOP 1 SUBSTRING(s2.TEXT,statement_start_offset / 2+1 , ( (CASE WHEN statement_end_offset = -1 THEN (LEN(CONVERT(NVARCHAR(MAX),s2.TEXT)) * 2) ELSE statement_end_offset END)- statement_start_offset) / 2+1)) AS sql_statement, last_execution_time FROM sys.dm_exec_query_stats AS s1 CROSS APPLY sys.dm_exec_sql_text(sql_handle) AS s2 ) x WHERE sql_statement NOT like 'SELECT TOP 50 * FROM(SELECT %' --and OBJECTPROPERTYEX(x.objectid,'IsProcedure') = 1 ORDER BY last_execution_time DESC
0 notes
Text
Check running SQL queries in SQL Server
Check running SQL queries in SQL Server
Check running SQL queries in SQL Server Check the currently running SQL Queries in SQL Server SELECT sqltext.TEXT, req.session_id, req.status, req.command, req.cpu_time, req.total_elapsed_time FROM sys.dm_exec_requests req CROSS APPLY sys.dm_exec_sql_text(sql_handle) AS sqltext OR select text, SUBSTRING(st.text, (qs.statement_start_offset/2)+1, ((CASE qs.statement_end_offset WHEN -1 THEN…
View On WordPress
0 notes
Text
How to identify the most costly SQL Server queries using DMV’s
See on Scoop.it - Digital Analytics
The query returns both the SQL Text from the sys.dm_exec_sql_text DMV and the XML Showplan data from the sys.dm_exec_query_plan DMV.
0 notes
Text
SQL Server - most costly queries in terms of Total CPU
SQL Server – most costly queries in terms of Total CPU
[bs url=http://www.johnsansom.com/how-to-identify-the-most-costly-sql-server-queries-using-dmvs/]
SELECT TOP 20 qs.sql_handle, qs.execution_count, qs.total_worker_time AS Total_CPU, total_CPU_inSeconds = --Converted from microseconds qs.total_worker_time/1000000, average_CPU_inSeconds = --Converted from microseconds (qs.total_worker_time/1000000) / qs.execution_count, qs.total_elapsed_time,…
View On WordPress
0 notes
Text
Find current long SQL Queries in MS SQL Server
Find current long SQL Queries in MS SQL Server
Find current long SQL Queries in SQL Server Find the current running long SQL Queries in MS SQL Server SELECT r.session_id, st.TEXT AS batch_text, r.start_time, r.status, r.total_elapsed_time FROM sys.dm_exec_requests AS r CROSS APPLY sys.dm_exec_sql_text(r.sql_handle) AS st WHERE DB_NAME(r.database_id) = 'AdventureWorks2022' ORDER BY cpu_time DESC; Find the current long-running SQL Queries in…
View On WordPress
0 notes