#text analysis in boolean logic <3< /div>
Explore tagged Tumblr posts
Visit Tumblr Blog
Explore Tumblr blogs with no restrictions, modern design and the best experience.
Last Seen Tumblr Blogs


Fun Fact
Average visit duration of Tumblr.com is 10 mins and 25 secs.
Text
if we take the phrase "to be, or not to be", such that [to be] = B and not[to be] = B', in formal logic, we get B || B' if B evaluates to true (and as its inverse, B' to false), then we get true or false, which evaluates to true (because one of the options is true - one OR the other) on the other hand, if we have B && B' (to be and not to be), if B evaluates to true (and B' to false), we get true AND false, which evaluates to false (because to evaluate to true, we either require true && true or false && false; the two are different therefore not true)
#mathematics is omnipresent#“i'm already there”#text analysis in boolean logic <3#of course text analysis per definition would be easily comprehensible too#there's nothing that ain't mathematically evaltuatable
0 notes
Text
Basics of R programming
Understanding the basics of R programming is crucial for anyone looking to leverage its capabilities for data analysis and statistical computing. In this chapter, we'll explore the fundamental elements of R, including its syntax, variables, data types, and operators. These are the building blocks of any R program and are essential for developing more complex scripts and functions.
R Syntax
R's syntax is designed to be straightforward and user-friendly, especially for those new to programming. It emphasizes readability and ease of use, which is why it's popular among statisticians and data scientists.
Comments: Comments are used to annotate code, making it easier to understand. In R, comments begin with a # symbol:# This is a comment in R
Statements and Expressions: R executes statements and expressions sequentially. Statements are typically written on separate lines, but multiple statements can be written on a single line using a semicolon (;):x <- 10 # Assigning a value to variable x y <- 5; z <- 15 # Multiple statements in one line
Printing Output: The print() function is commonly used to display the output of expressions or variables. Simply typing the variable name in the console will also display its value:print(x) # Displays the value of x x # Another way to display x
Variables in R
Variables are used to store data values in R. They are essential for performing operations, data manipulation, and storing results.
Creating Variables: Variables are created using the assignment operator <- or =. Variable names can contain letters, numbers, and underscores, but they must not start with a number:num <- 100 # Assigns the value 100 to the variable num message <- "Hello, R!" # Assigns a string to the variable message
Variable Naming Conventions: It’s good practice to use descriptive names for variables to make the code more readable:total_sales <- 500 customer_name <- "John Doe"
Accessing Variables: Once a variable is created, it can be used in expressions or printed to view its value:total_sales <- 1000 print(total_sales) # Outputs 1000
Data Types in R
R supports a variety of data types that are crucial for handling different kinds of data. The main data types in R include:
Numeric: Used for real numbers (e.g., 42, 3.14):num_value <- 42.5
Integer: Used for whole numbers. Integer values are explicitly declared with an L suffix:int_value <- 42L
Character: Used for text strings (e.g., "Hello, World!"):text_value <- "R programming"
Logical: Used for Boolean values (TRUE or FALSE):
is_active <- TRUE
Factors: Factors are used for categorical data and store both the values and their corresponding levels:status <- factor(c("Single", "Married", "Single"))
Vectors: Vectors are the most basic data structure in R, and they can hold elements of the same type:num_vector <- c(10, 20, 30, 40, 50)
Lists: Lists can contain elements of different types, including vectors, matrices, and even other lists:mixed_list <- list(num_value = 42, text_value = "R", is_active = TRUE)
Operators in R
Operators in R are used to perform operations on variables and data. They include arithmetic operators, relational operators, and logical operators.
Arithmetic Operators: These operators perform basic mathematical operations:
Addition: +
Subtraction: -
Multiplication: *
Division: /
Exponentiation: ^
Modulus: %% (remainder of division)
Example:a <- 10 b <- 3 sum <- a + b # 13 difference <- a - b # 7 product <- a * b # 30 quotient <- a / b # 3.3333 power <- a^b # 1000 remainder <- a %% b # 1
Relational Operators: These operators compare two values and return a logical value (TRUE or FALSE):
Equal to: ==
Not equal to: !=
Greater than: >
Less than: <
Greater than or equal to: >=
Less than or equal to: <=
Example:x <- 10 y <- 5 is_greater <- x > y # TRUE is_equal <- x == y # FALSE
Logical Operators: Logical operators are used to combine multiple conditions:
AND: &
OR: |
NOT: !
Example:a <- TRUE b <- FALSE both_true <- a & b # FALSE either_true <- a | b # TRUE not_a <- !a # FALSE
Working with Data Structures
Understanding R’s data structures is essential for manipulating and analyzing data effectively.
Vectors: As mentioned earlier, vectors are a fundamental data structure in R, and they are used to store sequences of data elements of the same type:numbers <- c(1, 2, 3, 4, 5)
Matrices: Matrices are two-dimensional arrays that store elements of the same type. You can create a matrix using the matrix() function:matrix_data <- matrix(1:9, nrow = 3, ncol = 3)
Data Frames: Data frames are used for storing tabular data, where each column can contain a different type of data. They are akin to tables in a database:df <- data.frame(Name = c("John", "Jane", "Doe"), Age = c(25, 30, 35))
Lists: Lists are versatile structures that can store different types of elements, including other lists:my_list <- list(name = "John", age = 30, scores = c(90, 85, 88))
Uncover more details at Strategic Leap
0 notes
Text
Understanding Tableau Data Types: A Key to Smarter Data Visualization

Tableau is widely recognized as one of the most powerful tools for turning raw data into insightful, interactive visual stories. But to unlock its full potential, it’s crucial to understand how Tableau classifies data. This classification, known as data types, forms the backbone of accurate analysis and compelling visualizations.
Whether you’re a beginner just starting out or an experienced user looking to refine your skills, grasping Tableau classes data types will help you create dashboards that are not only visually appealing but also meaningful and error-free.
In this article, we’ll break down the six main data types Tableau uses, explain why each one matters, and share practical tips to make your data work smarter, not harder.
What Are Data Types in Tableau?
Data types are categories that describe the nature of the data Tableau is handling. These types tell Tableau how to interpret, display, and calculate your data, which directly influences the quality and accuracy of your analysis. Imagine trying to calculate average sales from a list of customer names instead of numbers—it simply wouldn’t work. That’s why understanding data types is essential.
1. Text (String) Data Type
Text, or string data, includes any combination of letters, numbers, or symbols that Tableau treats as words rather than values.
Think of customer names, product codes, or email addresses. These fields help you categorize and label your data, making it easier to group and filter information.
For example, when you create a report showing sales by customer region, you’ll use string data to define those regions.
Tip: String fields in Tableau are case-sensitive, so “USA” and “usa” might be treated differently. Be mindful when cleaning and sorting this data to avoid confusion in your dashboards.
2. Number (Whole and Decimal)
Numbers are the backbone of most data analysis. Tableau distinguishes between whole numbers (integers) like counts or quantities and decimal numbers (floating points) such as prices or ratings.
For instance, your sales volume might be a whole number (100 units), while average customer ratings would be decimals (4.3 stars).
Accurate identification of numeric data ensures that calculations such as sums, averages, and percentages work properly in your visualizations.
Tip: Double-check whether Tableau recognizes your numeric fields correctly. Mistaking a decimal for a whole number can cause incorrect aggregations and skew your insights.
3. Date and Time Data Type
Date and time data allow Tableau to track when events happen, enabling rich analysis based on timelines.
Examples include order dates, timestamps, or customer sign-up dates.
Using date/time data, you can uncover trends, spot seasonal patterns, or compare performance over months and years.
Tableau also simplifies time-based grouping by automatically categorizing dates into years, quarters, months, or days, so you can drill down or roll up your analysis with ease.
Tip: If your date fields aren’t behaving as expected, check their format in the source data or within Tableau, as improper formatting can limit your ability to analyze trends effectively.
4. Boolean Data Type
Boolean fields have just two possible values: TRUE or FALSE.
This type is useful when working with yes/no questions or binary conditions—like whether a customer is new, if a payment was received, or if an account is active.
In Tableau, Boolean fields can drive filters or logical calculations, allowing you to create focused views or highlight specific segments.
Tip: You can create custom Boolean fields using calculated fields, for example: [Sales] > 1000 to identify high-value transactions.
5. Geographical Data Type
One of Tableau’s standout features is its ability to map data geographically.
When you assign geographic roles like Country, State, City, ZIP Code, or Latitude/Longitude, Tableau automatically generates maps that provide spatial context to your analysis.
This type is perfect for regional sales analysis, customer distribution, or any scenario where location matters.
Tip: Tableau tries to auto-detect geographic roles but sometimes requires manual adjustments. Verify that your location data is accurate and formatted correctly to avoid mapping errors.
6. Cluster or Mixed Data Type
Occasionally, Tableau encounters fields that don’t fit neatly into one category. This “mixed” or “cluster” type often happens when data comes from raw or unstructured sources.
For example, a calculated field combining text and numbers or a field with inconsistent data entries.
While this flexibility can be helpful, mixed data types can slow down your analysis or cause unexpected errors.
Tip: To keep your workflow smooth, try cleaning or splitting mixed fields into simpler, more consistent data types before using them in your visualizations.
Why Knowing Tableau Data Types Makes a Difference
Understanding how Tableau categorizes your data isn’t just academic—it directly impacts your ability to analyze accurately and efficiently. When you correctly define data types:
You avoid calculation mistakes that can mislead decision-making.
Your dashboards load faster because Tableau optimizes queries based on the data’s nature.
Your visualizations become clearer, matching the right chart type to your data.
For example, plotting customer names on a line chart won’t make sense, but using date/time fields there reveals trends over periods. Similarly, trying to sum Boolean values without proper context could lead to confusion.
Practical Tips for Managing Tableau Data Types
After working with these six data types, here are some practical steps to ensure you’re getting the best results:
Always review and clean your data before importing it into Tableau. Consistent formatting helps Tableau assign the correct types.
Use calculated fields thoughtfully to create new Boolean or numeric fields for advanced filtering and segmentation.
Regularly verify geographic data roles for accuracy, especially when dealing with custom regions or international datasets.
When dealing with mixed or messy data, take the time to split or transform fields into clean, single data types.
Conclusion:
Data types are the foundation of effective data visualization in Tableau. When you understand what each type means and how to work with it, you empower yourself to create clearer, more accurate, and insightful dashboards.
If you’re ready to deepen your Tableau skills, practice working with these data types on your own datasets. The more familiar you become, the more you’ll unlock Tableau’s true power to turn data into knowledge.
0 notes
Text
Top 5 Abilities Employers Search For
What Guard Can As Well As Can Not Do
#toc background: #f9f9f9;border: 1px solid #aaa;display: table;margin-bottom: 1em;padding: 1em;width: 350px; .toctitle font-weight: 700;text-align: center;
Content
Professional Driving Capacity
Whizrt: Simulated Intelligent Cybersecurity Red Team
Add Your Call Information Properly
Objectsecurity. The Security Plan Automation Company.
The Kind Of Security Guards
Every one of these courses supply a declarative-based strategy to reviewing ACL information at runtime, releasing you from requiring to compose any type of code. Please refer to the example applications to discover just how to make use of these courses. Spring Security does not offer any type of special integration to immediately create, update or delete ACLs as component of your DAO or repository operations. Rather, you will require to compose code like revealed above for your private domain name objects. It deserves taking into consideration using AOP on your solutions layer to instantly integrate the ACL details with your services layer procedures.
zie deze pagina
cmdlet that can be made use of to listing techniques and buildings on an object quickly. Figure 3 shows a PowerShell manuscript to mention this details. Where feasible in this research, typical customer benefits were used to supply insight into readily available COM things under the worst-case situation of having no administrative advantages.
Whizrt: Simulated Intelligent Cybersecurity Red Group
Users that are members of several teams within a duty map will constantly be approved their greatest consent. For instance, if John Smith is a member of both Team An and Group B, and Team A has Manager opportunities to an object while Team B just has Audience civil liberties, Appian will treat John Smith as an Administrator. OpenPMF's support for advanced access control versions consisting of proximity-based accessibility control, PBAC was likewise even more prolonged. To fix numerous challenges around applying safe and secure distributed systems, ObjectSecurity released OpenPMF variation 1, during that time among the first Attribute Based Gain access to Control (ABAC) items in the market.
The picked users and functions are now listed in the table on the General tab. Opportunities on dices allow customers to accessibility service actions and execute analysis.
Object-Oriented Security is the technique of making use of usual object-oriented style patterns as a system for accessibility control. Such mechanisms are commonly both simpler to utilize and also more effective than conventional security designs based upon globally-accessible resources safeguarded by accessibility control lists. Object-oriented security is closely pertaining to object-oriented testability as well as various other advantages of object-oriented style. When a state-based Accessibility Control Checklist (ACL) is as well as exists integrated with object-based security, state-based security-- is offered. You do not have consent to view this object's security homes, also as a management individual.
You might write your ownAccessDecisionVoter or AfterInvocationProviderthat respectively fires before or after an approach invocation. Such classes would certainly useAclService to obtain the relevant ACL and after that callAcl.isGranted( Permission [] permission, Sid [] sids, boolean administrativeMode) to determine whether permission is granted or denied. At the same time, you could utilize our AclEntryVoter, AclEntryAfterInvocationProvider orAclEntryAfterInvocationCollectionFilteringProvider courses.
What are the key skills of safety officer?
Whether you are a young single woman or nurturing a family, Lady Guard is designed specifically for women to cover against female-related illnesses. Lady Guard gives you the option to continue taking care of your family living even when you are ill.
Include Your Contact Information Properly

It permitted the central authoring of accessibility policies, as well as the automated enforcement throughout all middleware nodes making use of neighborhood decision/enforcement factors. Thanks to the assistance of several EU funded study jobs, ObjectSecurity discovered that a main ABAC strategy alone was not a convenient means to execute security plans. Visitors will get a comprehensive consider each element of computer system security and exactly how the CORBAsecurity requirements fulfills each of these security requires.
Understanding facilities It is a best practice to provide specific teams Visitor civil liberties to understanding centers as opposed to setting 'Default (All Other Customers)' to customers.
This suggests that no fundamental user will certainly have the ability to start this process design.
Appian recommends giving customer accessibility to specific teams instead.
Appian has detected that this process version might be utilized as an action or related action.
Doing so makes sure that record folders as well as records embedded within understanding facilities have actually specific visitors set.
You have to also provide benefits on each of the measurements of the dice. Nonetheless, you can establish fine-grained gain access to on a measurement to restrict the advantages, as defined in "Creating Data Security Plans on Cubes and dimensions". You can withdraw as well as set object privileges on dimensional objects using the SQL GIVE and REVOKE commands. You provide security on views and also emerged sights for dimensional objects similarly as for any kind of other views and also emerged sights in the database. You can provide both data security and object security in Analytic Work area Manager.
What is a security objective?
General career objective examples Secure a responsible career opportunity to fully utilize my training and skills, while making a significant contribution to the success of the company. Seeking an entry-level position to begin my career in a high-level professional environment.
Since their security is acquired by all objects embedded within them by default, expertise facilities and also regulation folders are taken into consideration high-level objects. For example, security set on expertise facilities is inherited by all embedded record folders and papers by default. Also, security established on regulation folders is inherited by all embedded policy folders and also rule things including user interfaces, constants, expression rules, choices, and assimilations by default.
Objectsecurity. The Security Policy Automation Company.
In the instance above, we're obtaining the ACL connected with the "Foo" domain object with identifier number 44. We're after that including an ACE to make sure that a principal named "Samantha" can "administer" the object.
youtube
The Types Of Security Guards
Topics covered include verification, recognition, and advantage; accessibility control; message security; delegation as well as proxy issues; auditing; and, non-repudiation. The author additionally provides many real-world examples of how protected object systems can be utilized to impose useful security plans. after that pick both of the worth from drop down, right here both worth are, one you appointed to app1 and also various other you designated to app2 and also maintain adhering to the step 1 to 9 meticulously. Right here, you are defining which individual will see which app and by following this remark, you specified you problem user will see both application.
What is a good objective for a security resume?
Career Objective: Seeking the position of 'Safety Officer' in your organization, where I can deliver my attentive skills to ensure the safety and security of the organization and its workers.
Security Vs. Presence
For object security, you also have the option of using SQL GIVE and REVOKE. provides fine-grained control of the data on a cellular degree. When you want to limit accessibility to particular areas of a cube, you just require to specify information security plans. Data security is carried out using the XML DB security of Oracle Data source. The next step is to really make use of the ACL details as component of permission decision logic as soon as you have actually used the above strategies to store some ACL details in the data source.
#objectbeveiliging#wat is objectbeveiliging#object beveiliging#object beveiliger#werkzaamheden beveiliger
1 note
·
View note
Text
White Box AI: Interpretability Techniques

While in the previous article of the series we introduced the notion of White Box AI and explained different dimensions of interpretability, in this post we’ll be more practice-oriented and turn to techniques that can make algorithm output more explainable and the models more transparent, increasing trust in the applied models.
The two pillars of ML-driven predictive analysis are data and robust models, and these are the focus of attention in increasing interpretability. The first step towards White Box AI is data visualization because seeing your data will help you to get inside your dataset, which is a first step toward validating, explaining, and trusting models. At the same time, having explainable white-box models with transparent inner workings, followed by techniques that can generate explanations for the most complex types of predictive models such as model visualizations, reason codes, and variable importance measures.
Data Visualization
As we remember, good data science always starts with good data and with ensuring its quality and relevance for subsequent model training.
Unfortunately, most datasets are difficult to see and understand because they have too many variables and many rows. Plotting many dimensions is technically possible, but it does not improve the human understanding of complex datasets. Of course, there are numerous ways to visualize datasets and we discussed them in our dedicated article. However, in this overview, we’ll rely on the experts’ opinions and stick to those selected by Hall and Gill in their book “An Introduction to Machine Learning Interpretability”.
Most of these techniques have the capacity to illustrate all of a data set in just two dimensions, which is important in machine learning because most ML algorithms would automatically model high-degree interactions between multiple variables.
Glyphs
Glyphs are visual symbols used to represent different values or data attributes with the color, texture, or alignment. Using bright colors or unique alignments for events of interest or outliers is a good method for making important or unusual data attributes clear in a glyph representation. Besides, when arranged in a certain way, glyphs can be used to represent rows of a data set. In the figure below, each grouping of four glyphs can be either a row of data or an aggregated group of rows in a data set.
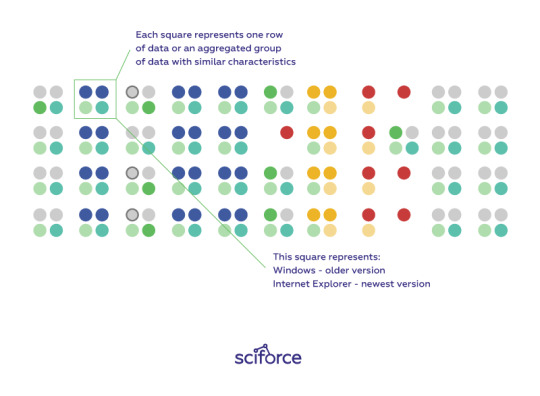
Figure 1. Glyphs arranged to represent many rows of a data set. Image courtesy of Ivy Wang and the H2O.ai team.
Correlation Graphs
A correlation graph is a two-dimensional representation of the relationships (i.e. correlation) in a data set. Even data sets with tens of thousands of variables can be displayed in two dimensions using this technique.
For the visual simplicity of correlation graphs, absolute weights below a certain threshold are not displayed. The node size is determined by a node’s number of connections (node degree), its color is determined by a graph community calculation, and the node position is defined by a graph force field algorithm. Correlation graphs show groups of correlated variables, help us identify irrelevant variables, and discover or verify important relationships that machine learning models should incorporate.
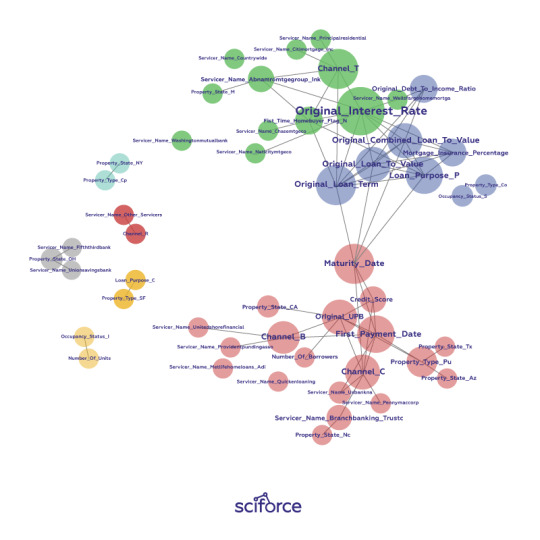
Figure 2. A correlation graph representing loans made by a large financial firm. Figure courtesy of Patrick Hall and the H2O.ai team.
In a supervised model built for the data represented in the figure above, we would expect variable selection techniques to pick one or two variables from the light green, blue, and purple groups, we would expect variables with thick connections to the target to be important variables in the model, and we would expect a model to learn that unconnected variables like CHANNEL_Rare not very important.
2-D projections
Of course, 2-D projection is not merely one technique and there exist any ways and techniques for projecting the rows of a data set from a usually high-dimensional original space into a more visually understandable 2- or 3-D space two or three dimensions, such as:
Principal Component Analysis (PCA)
Multidimensional Scaling (MDS)
t-distributed Stochastic Neighbor Embedding (t-SNE)
Autoencoder networks
Data sets containing images, text, or even business data with many variables can be difficult to visualize as a whole. These projection techniques try to represent the rows of high-dimensional data projecting them into a representative low-dimensional space and visualizing using the scatter plot technique. A high-quality projection visualized in a scatter plot is expected to exhibit key structural elements of a data set, such as clusters, hierarchy, sparsity, and outliers.
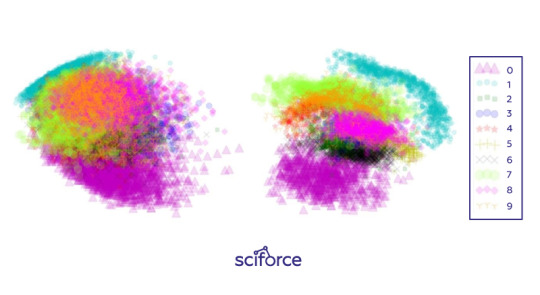
Figure 3. Two-dimensional projections of the 784-dimensional MNIST data set using (left) Principal Components Analysis (PCA) and (right) a stacked denoising autoencoder. Image courtesy of Patrick Hall and the H2O.ai team.
Projections can add trust if they are used to confirm machine learning modeling results. For instance, if known hierarchies, classes, or clusters exist in training or test data sets and these structures are visible in 2-D projections, it is possible to confirm that a machine learning model is labeling these structures correctly. Additionally, it shows if similar attributes of structures are projected relatively near one another and different attributes of structures are projected relatively far from one another. Such results should also be stable under minor perturbations of the training or test data, and projections from perturbed versus non-perturbed samples can be used to check for stability or for potential patterns of change over time.
Partial dependence plots
Partial dependence plots show how ML response functions change based on the values of one or two independent variables, while averaging out the effects of all other independent variables. Partial dependence plots with two independent variables are particularly useful for visualizing complex types of variable interactions between the independent variables. They can be used to verify monotonicity of response functions under monotonicity constraints, as well as to see the nonlinearity, non-monotonicity, and two-way interactions in very complex models. They can also enhance trust when displayed relationships conform to domain knowledge expectations. Partial dependence plots are global in terms of the rows of a data set, but local in terms of the independent variables.
Individual conditional expectation (ICE) plots, a newer and less spread adaptation of partial dependence plots, can be used to create more localized explanations using the same ideas as partial dependence plots.
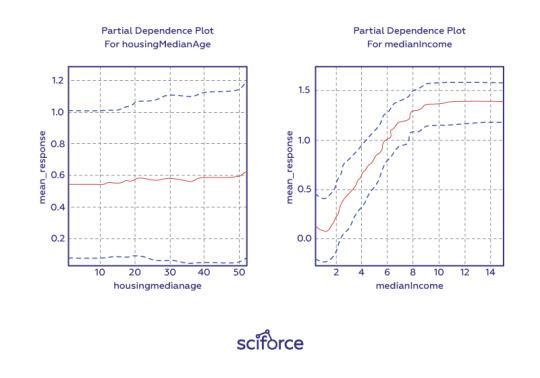
Figure 4. One-dimensional partial dependence plots from a gradient boosted tree ensemble model of the California housing data set. Image courtesy Patrick Hall and the H2O.ai team.
Residual analysis
Residuals refer to the difference between the recorded value of a dependent variable and the predicted value of a dependent variable for every row in a data set. In theory, the residuals of a well-fit model should be randomly distributed because good models will account for most phenomena in a data set, except for random error. Therefore, if models are producing randomly distributed residuals, this is an indication of a well-fit, dependable, trustworthy model. However, if strong patterns are visible in plotted residuals, there are problems with your data, your model, or both. Breaking out a residual plot by independent variables can additionally expose more granular information about residuals and assist in reasoning through the cause of non-random patterns.
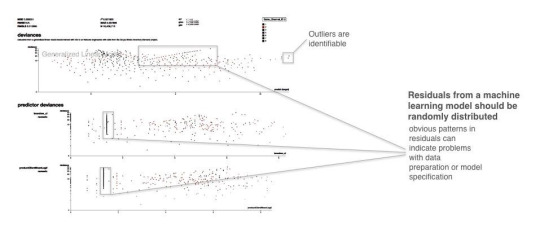
Figure 5. Screenshot from an example residual analysis application. Image courtesy of Micah Stubbs and the H2O.ai team.
Seeing structures and relationships in a data set makes those structures and relationships easier to understand and makes up a first step to knowing if a model’s answers are trustworthy.
Techniques for Creating White-Box Models
Decision trees
Decision trees, predicting the value of a target variable based on several input variables, are probably the most obvious way to ensure interpretability. They are directed graphs in which each interior node corresponds to an input variable. Each terminal node or leaf node represents a value of the target variable given the values of the input variables represented by the path from the root to the leaf. The major benefit of decision trees is that they can reveal relationships between the input and target variable with “Boolean-like” logic and they can be easily interpreted by non-experts by displaying them graphically. However, decision trees can create very complex nonlinear, nonmonotonic functions. Therefore, to ensure interpretability, they should be restricted to shallow depth and binary splits.
eXplainable Neural Networks
In contrast to decision trees, neural networks are often considered the least transparent of black-box models. However, the recent work in XNN implementation and explaining artificial neural network (ANN) predictions may render that characteristic obsolete. Many of the breakthroughs in ANN explanation were made possible thanks to the straightforward calculation of derivatives of the trained ANN response function with regard to input variables provided by deep learning toolkits such as Tensorflow. With the help of such derivatives, the trained ANN response function prediction can be disaggregated into input variable contributions for any observation. XNNs can model extremely nonlinear, nonmonotonic phenomena or they can be used as surrogate models to explain other nonlinear, non-monotonic models, potentially increasing the fidelity of global and local surrogate model techniques.
Monotonic gradient-boosted machines (GBMs)
Gradient boosting is an algorithm that produces a prediction model in the form of an ensemble of weak prediction models, typically decision trees. Used for regression and classification tasks, it is potentially appropriate for most traditional data mining and predictive modeling applications, even in regulated industries and for consistent reason code generation provided it builds monotonic functions. Monotonicity constraints can improve GBMs interpretability by enforcing a uniform splitting strategy in constituent decision trees, where binary splits of a variable in one direction always increase the average value of the dependent variable in the resultant child node, and binary splits of the variable in the other direction always decrease the average value of the dependent variable in the other resultant child node. Understanding is increased by enforcing straightforward relationships between input variables and the prediction target. Trust is increased when monotonic relationships, reason codes, and detected interactions are parsimonious with domain expertise or reasonable expectations.
Alternative regression white-box modeling approaches
There exist many modern techniques to augment traditional, linear modeling methods. Such models as elastic net, GAM, and quantile regression, usually produce linear, monotonic response functions with globally interpretable results similar to traditional linear models but with a boost in predictive accuracy.
Penalized (elastic net) regression
As an alternative to old-school regression models, penalized regression techniques usually combine L1/LASSO penalties for variable selection purposes and Tikhonov/L2/ridge penalties for robustness in a technique known as elastic net. Penalized regression minimizes constrained objective functions to find the best set of regression parameters for a given data set that would model a linear relationship and satisfy certain penalties for assigning correlated or meaningless variables to large regression coefficients. For instance, L1/LASSO penalties drive unnecessary regression parameters to zero, selecting only a small, representative subset of parameters for the regression model while avoiding potential multiple comparison problems. Tikhonov/L2/ridge penalties help preserve parameter estimate stability, even when many correlated variables exist in a wide data set or important predictor variables are correlated. Penalized regression is a great fit for business data with many columns, even data sets with more columns than rows, and for data sets with a lot of correlated variables.
Generalized Additive Models (GAMs)
Generalized Additive Models (GAMs) hand-tune a tradeoff between increased accuracy and decreased interpretability by fitting standard regression coefficients to certain variables and nonlinear spline functions to other variables. Also, most implementations of GAMs generate convenient plots of the fitted splines. That can be used directly in predictive models for increased accuracy. Otherwise, you can eyeball the fitted spline and switch it out for a more interpretable polynomial, log, trigonometric or other simple function of the predictor variable that may also increase predictive accuracy.
Quantile regression
Quantile regression is a technique that tries to fit a traditional, interpretable, linear model to different percentiles of the training data, allowing you to find different sets of variables with different parameters for modeling different behavior. While traditional regression is a parametric model and relies on assumptions that are often not met. Quantile regression makes no assumptions about the distribution of the residuals. It lets you explore different aspects of the relationship between the dependent variable and the independent variables.
There are, of course, other techniques, both based on applying constraints on regression and generating specific rules (like in OneR or RuleFit approaches). We encourage you to explore possibilities for enhancing model interpretability for any algorithm you choose and which is the most appropriate for your task and environment.
Evaluation of Interpretability
Finally, to ensure that the data and the trained models are interpretable, it is necessary to have robust methods for interpretability evaluation. However, with no real consensus about what interpretability is in machine learning, it is unclear how to measure it. Doshi-Velez and Kim (2017) propose three main levels for the evaluation of interpretability:
Application level evaluation (real task)
Essentially, it is putting the explanation into the product and having it tested by the end user. This requires a good experimental setup and an understanding of how to assess quality. A good baseline for this is always how good a human would be at explaining the same decision.
Human level evaluation (simple task)
It is a simplified application-level evaluation. The difference is that these experiments are not carried out with the domain experts, but with laypersons in simpler tasks like showing users several different explanations and letting them choose the best one. This makes experiments cheaper and it is easier to find more testers.
Function level evaluation (proxy task)
This task does not require humans. This works best when the class of model used has already been evaluated by humans. For example, if we know that end users understand decision trees, a proxy for explanation quality might be the depth of the tree with shorter trees having a better explainability score. It would make sense to add the constraint that the predictive performance of the tree remains good and does not decrease too much compared to a larger tree.
Most importantly, you should never forget that interpretability is not for machines but for humans, so the end users and their perception of data and models should always be in the focus of your attention. And humans prefer short explanations that contrast the current situation with a situation in which the event would not have occurred. Explanations are social interactions between the developer and the end user and it should always account for the social (and legal) context and the user’s expectations.
3 notes
·
View notes
Text
300+ TOP Elasticsearch Interview Questions and Answers
Elasticsearch Interview Questions for freshers experienced :-
1. What is Elasticsearch? Elasticsearch is a search engine that is based on Lucene.It offers a distributed, multitenant – capable full-text search engine with as HTTP (Hyper Text Transfer Protocol) web interface and Schema-free JSON (JavaScript Object Notation) documents.It is developed in Java and is an open source released under Apache License. Video Player is loading. 2. What is a current stable version of Elasticsearch? As on Feb 2020, version 7.5 is the latest and stable version of Elasticsearch. 3. List the software requirements to install Elasticsearch? Since Elasticsearch is built using Java, we require any of the following software to run Elasticsearch on our device. The latest version of Java 8 series Java version 1.8.0_131 is recommended. 4. How to start elastic search server? Run Following command on your terminal to start Elasticsearch server: cd elasticsearch ./bin/elasticsearch curl ‘http://localhost:9200/?pretty’ command is used to check ElasticSearch server is running or not. 5. Can you list some companies that use Elasticsearch? Some of the companies that use Elasticsearch along with Logstash and Kibana are: Wikipedia Netflix Accenture Stack Overflow Fujitsu Tripwire Medium Swat.io Hip chat IFTTT 6. What is a Cluster in Elasticsearch? It is a set or a collection of one or more than one nodes or servers that hold your complete data and offers federated indexing and search capabilities across all the nodes.It is identified by a different and unique name that is “Elasticsearch” by default. This name is considered to be important because a node can be a part of a cluster only if it is set up to join the cluster by its name. 7. What is a Node? Each and every instance of Elasticsearch is a node.And, a collection of multiple nodes which can work in harmony form an Elasticsearch cluster. 8. What is an Index? An index in Elasticsearch is similar to a table in relational databases.The only difference lies in storing the actual values in the relational database, whereas that is optional in Elasticsearch. An index is capable of storing actual or analyzed values in an index. 9. What is a type of Elastic search? A type in Elasticsearch is a logical category of the index whose semantics are completely up to the user. 10. What is Mapping? Mapping is a process which defines how a document is mapped to the search engine, searchable characteristics are included such as which fields are tokenized as well as searchable. In Elasticsearch an index created may contain documents of all “mapping types”.

Elasticsearch Interview Questions 11. What is Document? A document in Elasticsearch is similar to a row in relational databases.The only difference is that every document in an index can have a different structure or fields but having the same data type for common fields is mandatory.Each field with different data types can occur multiple times in a document. The fields can also contain other documents. 12. What are SHARDS? There are resource limitations like RAM, vCPU etc., for scale out, due to which applications employ multiple instances of Elasticsearch on separate machines. Data in an index can be partitioned into multiple portions which are managed by a separate node or instance of Elasticsearch.Each such portion is called a Shard.And an Elasticsearch index has 5 shards by default. 13. What is REPLICAS? Each shard in elastic search has again two copies of the shard that are called the replicas. They serve the purpose of fault tolerance and high availability. 14. How to add or create an index in Elastic Search Cluster? By using the command PUT before the index name, creates the index and if you want to add another index then use the command POST before the index name. Ex: PUT website An index named computer is created 15. How to delete an index in Elastic search? To delete an index in Elasticsearch use the command DELETE /index name. Ex: DELETE /website 16. How to list all indexes of a Cluster in ES.? By using GET / _index name/ indices we can get the list of indices present in the cluster. 17. How to add a Mapping in an Index? Basically, Elasticsearch will automatically create the mapping according to the data provided by the user in the request body. Its bulk functionality can be used to add more than one JSON object in the index. Ex: POST website /_bulk 18. How can you retrieve a document by ID in ES.? To retrieve a document in Elasticsearch, we use the GET verb followed by the _index, _type, _id. Ex: GET / computer / blog / 123?=pretty 19. How relevancy and scoring is done in Elasticsearch? The Boolean model is used by the Lucene to find the similar documents, and a formula called practical scoring function is used to calculate the relevance. This formula copies concepts from the inverse document/term-document frequency and the vector space model and adds the modern features like coordination factor, field length normalization as well. Score (q, d) is the relevance score of document “d” for query “q”. 20. What are different ways of searching in Elasticsearch? We can perform the following searches in Elasticsearch: Multi-index, Multitype search: All search APIs can be applied across all multiple indices with the support for the multi-index system. We can search certain tags across all indices as well as all across all indices and all types. URI search: A search request is executed purely using a URI by providing request parameters. Request body search:A search request can be executed by a search DSL, that includes the query DSL within the body. 21. List different types of queries supported by Elasticsearch? The Queries are divided into two types with multiple queries categorized under them. Full-text queries: Match Query, Match phrase Query, Multi match Query, Match phrase prefix Query, common terms Query, Query string Query, simple Query String Query. Term level queries: term Query, term set Query, terms Query, Range Query, Prefix Query, wildcard Query, regexp Query, fuzzy Query, exists Query, type Query, ids Query. 22. What is the difference between Term-based and Full-text queries? Term-based Queries : Queries like the term query or fuzzy query are the low-level queries that do not have analysis phase.A term Query for the term Foo searches for the exact term in the inverted index and calculates the IDF/TF relevance score for every document that has a term. Full-text Queries : Queries like match query or query string queries are the high-level queries that understand that mapping of a field.As soon as the query assembles the complete list of items it executes the appropriate low-level query for every term, and finally combines their results to produce the relevance score of every document. 23. How does aggregation work in Elasticsearch? The aggregation framework provides aggregated data based on search query.It can be seen as a unit of work that builds analytic information over the set of documents.There are different types of aggregations with different purpose and outputs. 24. Where is Elasticsearch data stored? Elasticsearch is a distributed documented store with several directories.It can store and retrieve the complex data structures that are serialized as JSON documents in real time. 25. Can Elasticsearch replace database? Yes, Elasticsearch can be used as a replacement for a database as the Elasticsearch is very powerful. It offers features like multitenancy, sharding and Replication, distribution and cloud Realtime get, Refresh, commit, versioning and re-indexing and many more, which make it an apt replacement of a database. 26. How to check elastic search server is running? Generally, Elasticsearch uses the port range of 9200-9300. So, to check if it is running on your server just type the URL of the homepage followed by the port number. Ex: mysitename.com:9200 27. What is the query language of ElasticSearch ? ElasticSearch uses the Apache Lucene query language, which is called Query DSL. 28. What is a Tokenizer in ElasticSearch ? A Tokenizer breakdown fields values of a document into a stream, and inverted indexes are created and updates using these values, and these stream of values are stored in the document. 29. What is an index in ElasticSearch ? An index is similar to a table in relational databases. The difference is that relational databases would store actual values, which is optional in ElasticSearch. An index can store actual and/or analyzed values in an index. 30. What is a replica in ElasticSearch ? Each shard in ElasticSearch has 2 copy of the shard. These copies are called replicas. They serve the purpose of high-availability and fault-tolerance. Elasticsearch Questions and Answers Pdf Download Read the full article
0 notes
Text
PHP CRUD Generator
New Post has been published on https://intramate.com/php-scripts/php-crud-generator/
PHP CRUD Generator
LIVE PREVIEWGet it now for only $40
Create a Professional Bootstrap 4 Admin Dashboard with all CRUD PHP Operations from your own MySQL Database
Smart Database Analysis
Easy Visual Application
Advanced Functionalities
Full Comprehensive documentation
Online tutorials & videos
Includes PHP Form Builder
What is PHP CRUD Generator?
Created with the most trusted web technologies, PHP CRUD Generator is a powerful and intuitive solution to create Bootstrap 4 admin dashboards.
The one-page visual interface gives full access to the database.
PHPCG performs an in-depth analysis of your data and stores it: all types of relationships between tables, primary and foreign keys, field types and values, validation, etc.
This intelligent analysis is used to preconfigure the options adapted to each element of the administration panel.
Validate each of the 3 generator forms to create your Admin Panel content.
Bootstrap Admin Panel Builder
Choose the table to be used for integration in your Admin Panel
Generate the relevant data table (READ)
Generate create/edit forms (CREATE/UPDATE)
Generate delete form (DELETE)
Customizable Bootstrap themes & CSS
20+ Bootstrap themes included
Change the Bootstrap theme & customize in a few clicks
Generate a full-featured Bootstrap Admin Panel
PHPCG automatically provides the best tools needed to build your Admin Panel: drop-down lists with integrated search, date and time pickers, collapsible menus, collapsible nested tables, in-place editing, file upload, image upload with editing features and thumbnail generation, help texts and tooltips.
PHP CRUD Generator at a glance
Generator User Interface
One-page interface
Built with advanced and comprehensive forms
Smart Database Analysis
Primary keys detection and interpretation
Secondary keys detection and interpretation
Detection of all types of relationships
Smart integration of internal/external relationships in CRUD
Smart field type detection and integration
Detection and integration of validation types
Website Admin User Interface
Clean & responsive layout
User friendly navigation with categories & icons
User friendly naming for all content
Customizable with TWIG Templates
Read Lists
Advanced filtering system
Number of records per page selection
Column sorting
Collapsible secondary content
Collapsible nested tables for external data (relationships)
XLSX/CSV Export
Edit-in-place
View images and thumbnails
Smart data viewing (Boolean values, Date & Time format, Images & thumbnails, …)
Single-record lists
Create / Update forms
Built with PHP Form Builder
Automatic use of the best available jQuery plugins: upload, Rich Text Editor, pickers, …)
Relationship management between tables with choice of fields to display
Drop-down lists with values management (automatic/customized)
Responsive custom layout
Smart automatic/custom validation
Helpers & Tooltips
Deletion forms
Cascade deletion accouring to the table relations
Choose the fields to display to confirm deletion (i.e: name + first name)
Warning display for cascade deletion with record count of each field to delete
Backup & file comparison
Automatic backup of the replaced CRUD generator & admin files
Side by side file comparison & merging of older/newer versions
User Authentification Module
100% Secured Login System
Advanced reliable password Encryption
Rights & profiles management
Users Rights management
Add/Edit/Delete users
Unlimited custom Users Profiles
Rights management by table and by profile (CAN READ / CAN CREATE-UPDATE / CAN DELETE)
Coding & Customization
Comprehensive & well-organized structure
MVC Logic without PHP Framework (Pure PHP coding)
Built with PHP Form Builder, Bootstrap 4 & jQuery
TWIG Templates
Alto Router
Customer feedback :
Fantastic work, easy installation. At 40 dollars.. I mean I thought about spending half a year to develop this solution my self. Congratulations, one of the most underrated products on codecanyon
The best support I have ever received for a software purchase, on CodeCanyon or elsewhere. Both the CRUD and support are excellent. Highly recommended!
This product is great for people trying to track anything like business etc… No programming language needed. Totally understandable for anyone. And the best part of it that it has great customer support! Author is always online for the most part of the day and answers any question within 2-3 minutes. If something specific bothering you he even connects through teamviewer and happily helps you. You will not regret buying this product!
Great system! The system is very powerful, the design is very beautiful and the stand is excellent. The system still has a lot to grow and is sure to improve even more.
It’s a very nice work, you can create crud and have authentification module without write code !
LIVE PREVIEWGet it now for only $40
0 notes
Text
Binary system History
The modern binary number system was studied in Europe in the 16th and 17th centuries by Thomas Harriot, Juan Caramuel y Lobkowitz, and Gottfried Leibniz. However, systems related to binary numbers have appeared earlier in multiple cultures including ancient Egypt, China, and India. Leibniz was specifically inspired by the Chinese I Ching. Egypt Arithmetic values represented by parts of the Eye of Horus The scribes of ancient Egypt used two different systems for their fractions, Egyptian fractions (not related to the binary number system) and Horus-Eye fractions (so called because many historians of mathematics believe that the symbols used for this system could be arranged to form the eye of Horus, although this has been disputed). Horus-Eye fractions are a binary numbering system for fractional quantities of grain, liquids, or other measures, in which a fraction of a hekat is expressed as a sum of the binary fractions 1/2, 1/4, 1/8, 1/16, 1/32, and 1/64. Early forms of this system can be found in documents from the Fifth Dynasty of Egypt, approximately 2400 BC, and its fully developed hieroglyphic form dates to the Nineteenth Dynasty of Egypt, approximately 1200 BC. The method used for ancient Egyptian multiplication is also closely related to binary numbers. In this method, multiplying one number by a second is performed by a sequence of steps in which a value (initially the first of the two numbers) is either doubled or has the first number added back into it; the order in which these steps are to be performed is given by the binary representation of the second number. This method can be seen in use, for instance, in the Rhind Mathematical Papyrus, which dates to around 1650 BC.[3] China Daoist Bagua The I Ching dates from the 9th century BC in China. The binary notation in the I Ching is used to interpret its quaternary divination technique. It is based on taoistic duality of yin and yang. Eight trigrams (Bagua) and a set of 64 hexagrams ("sixty-four" gua), analogous to the three-bit and six-bit binary numerals, were in use at least as early as the Zhou Dynasty of ancient China. The Song Dynasty scholar Shao Yong (1011–1077) rearranged the hexagrams in a format that resembles modern binary numbers, although he did not intend his arrangement to be used mathematically.viewing the least significant bit on top of single hexagrams in Shao Yong's square and reading along rows either from bottom right to top left with solid lines as 0 and broken lines as 1 or from top left to bottom right with solid lines as 1 and broken lines as 0 hexagrams can be interpreted as sequence from 0 to 63. India The Indian scholar Pingala (c. 2nd century BC) developed a binary system for describing prosody. He us binary numbers in the form of short and long syllables (the latter equal in length to two short syllables), making it similar to Morse code. Pingala's Hindu classic titled Chandaḥśāstra (8.23) describes the formation of a matrix in order to give a unique value to each meter. The binary representations in Pingala's system increases towards the right, and not to the left like in the binary numbers of the modern, Western positional notation. Other cultures The residents of the island of Mangareva in French Polynesia were using a hybrid binary-decimal system before 1450. Slit drums with binary tones are used to encode messages across Africa and Asia. Sets of binary combinations similar to the I Ching have also been used in traditional African divination systems such as Ifá as well as in medieval Western geomancy. Western predecessors to Leibniz In the late 13th century Ramon Llull had the ambition to account for all wisdom in every branch of human knowledge of the time. For that purpose he developed a general method or ‘Ars generalis’ based on binary combinations of a number of simple basic principles or categories, for which he has been considered a predecessor of computing science and artifical intelligence In 1605 Francis Bacon discussed a system whereby letters of the alphabet could be reduced to sequences of binary digits, which could then be encoded as scarcely visible variations in the font in any random text. Importantly for the general theory of binary encoding, he added that this method could be used with any objects at all: "provided those objects be capable of a twofold difference only; as by Bells, by Trumpets, by Lights and Torches, by the report of Muskets, and any instruments of like nature". (See Bacon's cipher.) John Napier in 1617 described a system he called location arithmetic for doing binary calculations using a non-positional representation by letters. Thomas Harriot investigated several positional numbering systems, including binary, but did not publish his results; they were found later among his papers. Possibly the first publication of the system in Europe was by Juan Caramuel y Lobkowitz, in 1700. Leibniz and the I Ching Gottfried Leibniz Leibniz studied binary numbering in 1679; his work appears in his article Explication de l'Arithmétique Binaire (published in 1703) The full title of Leibniz's article is translated into English as the "Explanation of Binary Arithmetic, which uses only the characters 1 and 0, with some remarks on its usefulness, and on the light it throws on the ancient Chinese figures of Fu Xi". (1703) Leibniz's system uses 0 and 1, like the modern binary numeral system. An example of Leibniz's binary numeral system is as follows: 0 0 0 1 numerical value 20 0 0 1 0 numerical value 21 0 1 0 0 numerical value 22 1 0 0 0 numerical value 23 Leibniz interpreted the hexagrams of the I Ching as evidence of binary calculus. As a Sinophile, Leibniz was aware of the I Ching, noted with fascination how its hexagrams correspond to the binary numbers from 0 to 111111, and concluded that this mapping was evidence of major Chinese accomplishments in the sort of philosophical mathematics he admired. Leibniz was first introduced to the I Ching through his contact with the French Jesuit Joachim Bouvet, who visited China in 1685 as a missionary. Leibniz saw the I Chinghexagrams as an affirmation of the universality of his own religious beliefs as a Christian. Binary numerals were central to Leibniz's theology. He believed that binary numbers were symbolic of the Christian idea of creatio ex nihilo or creation out of nothing. [A concept that] is not easy to impart to the pagans, is the creation ex nihilothrough God's almighty power. Now one can say that nothing in the world can better present and demonstrate this power than the origin of numbers, as it is presented here through the simple and unadorned presentation of One and Zero or Nothing. — Leibniz's letter to the Duke of Brunswick attached with the I Chinghexagrams Later developments George Boole In 1854, British mathematician George Boolepublished a landmark paper detailing an algebraic system of logic that would become known as Boolean algebra. His logical calculus was to become instrumental in the design of digital electronic circuitry. In 1937, Claude Shannon produced his master's thesis at MIT that implemented Boolean algebra and binary arithmetic using electronic relays and switches for the first time in history. Entitled A Symbolic Analysis of Relay and Switching Circuits, Shannon's thesis essentially founded practical digital circuit design. In November 1937, George Stibitz, then working at Bell Labs, completed a relay-based computer he dubbed the "Model K" (for "Kitchen", where he had assembled it), which calculated using binary addition.Bell Labs authorized a full research program in late 1938 with Stibitz at the helm. Their Complex Number Computer, completed 8 January 1940, was able to calculate complex numbers. In a demonstration to the American Mathematical Society conference at Dartmouth College on 11 September 1940, Stibitz was able to send the Complex Number Calculator remote commands over telephone lines by a teletype. It was the first computing machine ever used remotely over a phone line. Some participants of the conference who witnessed the demonstration were John von Neumann, John Mauchly and Norbert Wiener, who wrote about it in his memoirs. The Z1 computer, which was designed and built by Konrad Zuse between 1935 and 1938, used Boolean logic and binary floating point numbers. Source: Wikipedia
0 notes
Text
UGC NET Computer Science and Applications Syllabus 2018
New Post has been published on http://studyabroadaide.com/ugc-net-computer-science-and-applications-syllabus-2018/
UGC NET Computer Science and Applications Syllabus 2018
UGC NET Computer Science and Applications Syllabus 2018
UNIVERSITY GRANTS COMMISSION NET BUREAU Code No. : 87 Subject: COMPUTER SCIENCE AND APPLICATIONS
SYLLABUS Note: There will be two question papers, Paper-II and Paper-Ill (Part-A & B). Paper-II will cover 50 Objective Type Questions (Multiple choice, Matching type, True/False, Assertion-Reasoning type) carrying 100 marks. Paper’-Ill will have two Parts-A and B: Paper-iii (A) will have 10 short essay type questions (300 words) carryIng 16 marks each. In it there will be one question with Internal choice from each unit (i.e. 10 questions from 10 units: Total marks will be 160). Paper-III (B) will be compulsory and there will be one question from each of the Electives. The candidate will attempt only one question (one elective only In 800 words) carrying 40 marks. Total marks of Paper-III will be 200.
Best book for UGC NET Computer Science and Applications
UGC NET Computer Science and Applications Syllabus 2018
PAPER-II
1. Discrete Structures
Sets, Relations, Functions. Pigeonhole Principle, Inclusion-Exclusion Principle, Equivalence and Partial Orderings, Elementary Counting Techniques, Probability. Measure(s) for Information and Mutual Information. Computability: Models of computation—Finite Automata, Pushdown Automata, Non-determinism and NFA. DPDA and PDAs and Languages accepted by these structures. Grammars, Languages, Non-computability and Examples of non-computable problems. Graph: DefInition, walks, paths, trails, connected graphs, regular and bipartite graphs, cycles and circuits. Tree and rooted tree. Spanning trees. Eccentricity of a vertex radius and diameter of a graph. Central Graphs. Centre(s) of a tree. Hamiltonlan and Eulerlan graphs, Planar graphs. Groups: Finite fields and Error correcting/detecting codes.
2. Computer Arithmetic
Propositional (Boolean) Logic, Predicate Logic, Well-formed-formulae (WFF), Satisfiability and Tautology. Logic Families : TTl, ECL and C-MOS gates. Boolean algebra and Minimization of Boolean functions, Flip-flops—-types, race condition and comparison. Design of computational and sequential circuits. Representation of Integers: Octal, Hex. Decimal, and Binary. 2’s complement and l’s complement arithmetic. Floating point representation.
3. Programming in C and C++
Programming in C: Elements of C—Tokens, Identifiers, data types In C. Control structures In C. Sequence, selection and Iteration(s). Structured data types In C—arrays, struct, union, string, and pointers, 0-0 Programming Concepts : Class, object, instantiation. Inheritance, polymorphism and overloading. C++ Programming : Elements of C++ —Tokens, identifiers. Variables and constants, Data types, Operators, Control statements. Functions parameter passing. Class and objects. Constructors and destructors. Overloading, Inheritance, Templates, Exception handling.
4. Relational Database Design and SQL
E-R diagrams and their transformation to relational design, normalizatlon—1NF, 2NF. 3NF, BCNF and 4NF. Limitations of 4NF and BCNF. SQL: Data Definition Language (DDL), Data Manipulation Language (DML), Data Control Language (DCL) commands. Database objects like—Views, Indexes, sequences, synonyms, data dictionary.
5. Data and File structures
Data, Information, Definition of data structure. Arrays, stacks, queues, linked lists, trees, graphs, priority queues and heaps. File Structures: Fields, records and files. Sequential, direct, Index-sequential and relative files. Hashing, inverted lists and multi-lists. B trees and B trees. 6. Computer Networks Network fundamentals : Local Area Networks (LAN). Metropolitan Area Networks (MAN), Wide Area Networks (WAN), Wireless Networks, Inter Networks. Reference Models : The OSI model, TCP/IP model.
Data Communication: Channel capacity. Transmission media—twisted pair, coaxial cables, fibre-optic cables, wireless transmission—radio, microwave, infrared and millimeter waves. Lightwave transmission. Thelephones—local loop, trunks, multiplexing, switching, narrowband ISDN, broadband ISDN, ATM. High speed LANS. Cellular adio. Communication satellites—geosynchronous and low-orbit. Intemetworking: Switch/Hub, Bridge, Router, Gateways, Concatenated virtual circuits, Tunnelling. Fragmentation, Firewalls. Routing : Virtual circuits and datagrams. Routing algorithms. Conjestion control. Network Security: Cryptography—public key, secret key. Domain Name System (DNS)—Electronic Mail and Worldwide Web (WWW). The DNS, Resource Records, Name servers. E-mail-architecture and Serves. 7. System Software and Compilers Assembly language fundamentals (8085 based assembly language programming). Assemblers—2-pass and single-pass. Macros and macroprocessors. Loading, linking, relocation, program relocatabifity. Linkage editing. Text editors. Programming Environments. Debuggers and program generators. Compilation and Interpretation. Bootstrap compilers. Phases of compilation process. Lexical analysis. Lex package on Unix system. Context free grammars. Parsing and parse trees. Representation of parse (derivation) trees as rightmost and leftmost derivations. Bottom up parsers—shift-reduce. operator precedence, and LR. YACC package on Unix system. Topdown parsers—left recursion and its removal. Recursive descent parser. Predictive parser, Intermediate codes—Quadruples, Triples. Intermediate code generation, Code generation, Code optimization. 8. Operating Systems (with Case Study of Unix) Main functions of operating systems. Multiprogramming. multiprocessing, and multitasking. Memory Management: Virtual memory, paging, fragmentation. Concurrent Processing: Mutual exclusion. Critical regions, lock and unlock. Scheduling: CPU scheduling. I/O scheduling, Resource scheduling, Deadlock and scheduling algorithms. Banker’s algorithm for deadlock handling.
UMX The Unix System: File system, process management. bourne shell, shell variables, command line programming. Filters and Commands: Pr, head, tail, cut, paste, sort, unlq. tr, join. etc., grep, egrep, fgrep, etc., sed, awk, etc. System Calls (like): Creat, open, close, read, write, Iseek, link, unlink, stat, fstat, umask, chmod. exec, fork, wait, system. 9. Software Engineering System Development Life Cycle (SDLC): Steps, Water fall model, Prototypes. Spiral model. Software Mefrics: Software Project Management. Software Design: System design, detailed design, function oriented design, object oriented design, user interface design. Design level metrics. Coding and Testing : Testing level metrics. Software quality and reliability. Clean room approach, software reengineering. 10. Current Trends and Technologies The topics of current interest In Computer Science and Computer Applications shall be covered. The experts shall use their judgement from time to time to Include the topics of popular Interest, which are expected to be known for an application development software professional, currently, they include Parallel Computing Parallel virtual machine (pvm) and message passing interface (mpi) libraries and calls. Advanced architectures. Today’s fastest computers. Mobile Contputing Mobile connectivity—CeUs, Framework, wireless delivery technology and switching methods, mobile Information access devices, mobile data internetworking standards, cellular data communication protocols, mobile computing applications. Mobile databases—protocols, scope, tools and technology. M-business. E-Technologies Electronic Commerce : Framework, Media Convergence of Applications, Consumer Applications. Organisation Applications.
Electronic Payment Systems: Digital Token, Smart Cards, Credit Cards, Risks In Electronic Payment System, Designing Electronic Payment Systems. Electronic Data Interchwige (EDI) : Concepts, Applications, (Legal, Security and Privacy) Issues, EDT and Electronic Commerce, Standardization and EDT, EDI Software Implementation, EDT Envelope for Message Transport, Internet-Based EDI. Digital Libraries and Data Warehousing: Concepts. Types of Digital documents, Issues behind document Infrastructure, Corporate Data Warehouses. Software Agents : Characteristics and Properties of Agents, Technology behind Software Agents (Applets, Browsers and Software Agents) Broadband Telecommunications: Concepts, Frame Relay, Cell Relay, Switched Multlmegablt Data Service. Asynchronous Transfer Mode. Main concepts In Geographical Information System (GIS), E-cash, E-Buslness, ERP packages. Data Warehousing: Data Warehouse environment, architecture of a data warehouse methodology, analysis, design, construction and administration. Data Mining: Extracting models and patterns from large databases, data mining techniques, classification, regression, clustering, summarization, dependency modelling, link analysis, sequencing analysis, mining scientific and business data. Windows Programming Introduction to Windows programmlng—W1n32, Microsoft Foundation Classes (MFC), Documents and views, Resources, Message handling in windows. Simple Applications (in windows) Scrolling, splitting views, docking toolbars. status bars, common dialogs. Advanced Windows Programming Multiple Document Interface (MDI), Multithreading. Object linking and Embedding (OLE). Active X controls. Active Template Library (Am). Network programming.
Best book for UGC NET Computer Science and Applications
UGC NET Computer Science and Applications Syllabus 2018
PAPER-III(A) CORE GROUP
Unit—I Combinational Circuit Design. Sequential Circuit Design. Hardwlred and Microprogrammed processor design. Instruction formats, Addressing modes. Memory types and organisation, Interfacing peripheral devices, Interrupts. Microprocessor architecture. Instruction set and Programming (8085, p-Iu/P-IV). Microprocessor applications. Unit—Il Database Concepts. ER diagrams, Data Models, Design of Relational Database. NormalisatiOfl, SQL and QBE. Query Processing and Optimisatlon. Centralised and Distributed Database, Security. Concurrency and Recovery In Centra]lsed and Distributed Database Systems. Object Oriented Database Management Systems (Concepts. Composite objects, Integration with RDBMS applications), ORACLE. Unit—Ill Display systems, Input devices, 2D Geometry, Graphic operations. 3D Graphics. Animation. Graphic standard, Applications. Concepts. Storage Devices. Input Tools, Authoring Tools. Application. Files. Unlt—IV Programming language concepts, paradigms and models. Data. Data types, Operators, Expressions, Assignment. Flow of Control—Control structures. I/O statements, User-defined and built-in functions, Parameter passing. Principles, classes, Inheritance, class hierarchies, polymorphism. dynamic binding, reference semantics and their implementation. Principles, functions, lists, types and polymorphisms. higher order functions, lazy evaluation, equations and pattern matching. Principles, horn clauses and their execution, logical variables, relations, data structures, controlling the search order, program development In prolog, implementation of prolog. example programs In prolog.
Principles of parallelism, coroutines, communication and execution. Parallel Virtual Machine (PVM) and Message Passing Interface (MPI) routines and calls. Parallel programs In PVM paradigm as well as MPI paradigm for simple problems like matrix multiplication. Preconditions, post-conditions, axiomatic approach for semantics, correctness, denotationa] semantics. Compiler structure, compiler construction tools, compilation phases. Finite Automata, Pushdown Automata. Non-determinism and NFA. DPDA, and PDAS and languages accepted by these structures. Grammars, Languages—types of grammars—type 0, type 1, type 2, and type 3. The relationship between types of grammars, and finite machines. Pushdown automata and Context Free Grammars. Lexical Analysis—regular expressions and regular languages. LEX package on Unix. Conversion of NFA to DFA. Minimizing the number of states In a DFA. Compilation and Interpretation. Bootstrap compilers. Context free grammars. Parsing and parse trees. Representation of parse (derivation) trees as rightmost and leftmost derivations. Bottom up parsers—shift-reduce, operator precedence, and LR. YACC package on Unix system. Topdown parsers—left recursion and its removal. Recursive descent parser. Predictive parser, Intermediate codes—Quadruples, triples. Intermediate code generation, code generation. Code optimization. Unit—V Analog and Digital transmission, Asynchronous and Synchronous transmission, Transmission media, Multiplexing and Concentration, Switching techniques, Polling. Topologies, Networking Devices, OS Reference Model, Protocols for—(i) Data link layer, (Ii) Network layer, and (lii) Transport layer. TCP/IP protocols, Networks security. Network administration. Unit—VI – Definition, Simple and Composite structures, Arrays. Lists. Stacks queues, Priority queues. Binary trees, B-trees, Graphs. Sorting and Searching Algorithms, Analysis of Algorithms, Interpolation and Binary Search. Asymptotic notations—big ohm, omega and theta. Average case analysis of simple programs like finding of a maximum of rt elements. Recursion and its systematic removal. Quicksort—Non-recursive implementation with minimal stack storage. Design of Algorithms (Divide and Conquer. Greedy method. Dynamic programming, Back tracking, Branch and Bound). Lower bound theory, Non-deterministic algorithm—Non-deterministic programming constructs. Simple non-deterministic programs. NP—hard and NP—complete problems.
Unit—VII Object, messages, classes, encapsulation. Inheritance, polymorphism. aggregation, abstract classes, generalization as extension and restriction. Object oriented design. Multiple inheritance, metadata. HTML. DHTML, XML, Scripting. Java, Servelets. Applets. Unit—VIII Software development models. Requirement analysis and specifications. Software design. Programming techniques and tools. Software validation and quality assurance techniques. Software maintenance and advanced concepts. Software management. Unit—IX Introduction. Memory management. Support for concurrent process, Scheduling. System deadlock, Multiprogramming system. I/O management, Distributed operating systems. Study of Unix and Windows NT. Unit—X Definitions, Al approach for solving problems. Automoted Reasonthg with propositional logic and predicate logic—fundamental proof procedure. refutation, resolution, refinements to resolution (ordering! prunlngf restriction strategies). State space representation of problems. bounding functions, breadth first, depth first, A. A’. A0, etc. Performance comparison of various search techniques. Frames, scripts, semantic nets, production systems. procedural representations. Prolog programming. Components of an expert system. Knowledge representation and Acquisition techniques. Building expert system and Shell. RTNs, ATNs, Parsing of Ambiguous CFGs. Tree Adjoining Grammars CrAGs). Systems approach to planning. Designing. Development, Implementation and Evaluation of MIS. Decision-making processes. evaluation of DSS, Group decision support system and case studies, Adaptive design approach to DSS development. Cognitive style in DSS. Integrating expert and Decision support systems.
UGC NET Computer Science and Applications Syllabus 2018
PAPER-III(B) ELECTIVE/OPTIONAL
Elective—I Theory of Computation : Formal language. Need for formal computational models, Non-computational problems, diagonal argument and Russel’s paradox. Deterministic Finite Automaton (DFA), Non-deterministic Finite Automaton (NFA), Regular languages and regular sets, Equivalence of DFA and NFA. Minimizing the number of states of a DFA. Non-regular languages, and Pumping lemma. Pushdown Automaton (PDA), Deterministic Pushdown Automaton (DPDA). Non-equfivalence of PDA and DPDA. Conteict free Grammars: Greibach Normal Form (GNF) and Chomsky Normal Form (CNF), Ambiguity. Parse Tree Representation of Derivations. Equivalence of PDA’s and CFG’s. Parsing techniques for parsing of general CFG’s—Early’s, Cook-Kassarni-Younger (CKY). and Tomita’s parsing. Linear Bounded Automata (LBA): Power of LBA. Closure properties. Thring Machine (1M): One tape, multitape. The notions of thne and space complexity in terms of TM. Construction of TM for simple problems. Computational complexity. Chonzsky Hierarchy of languages : Recursive and recursively-enumerable languages.
Elective—II Models for Information Channel : Discrete Memoryless Channel, Binary Symmetric Channel (BSC). Burst Channel. Bit-error rates. Probabffity, Entropy and Shannon’s measure of Information. Mutual information. Channel capacity theorem. Rate and optimality of Information transmission. Variable Length Codes: Prefix Codes, Huffmann Codes, Lempel-Ziev (12) Codes. Optimality of these codes. Information content of these codes. Error Correcting and Detecting Codes: Finite fields, Hamming distance, Bounds of codes, Linear (Parity Check) codes. Parity check matrix. Generator matrix, Decoding of linear codes, Hamming codes. Image Processing: Image Registration, Spatial Fourier Transforms, Discrete Spatial (2-dimensional) Fourier Transforms, Restoration, Lossy Compression of Images (pictures). Data Compression Techniques: Representation and compression of text, sound, picture, and video flies (based on the JPEG and MPEG standards).
Elective—Ill Linear Programming Problem (LPP) in the standard form, LPP In Canonical form. Conversion of LPP in Standard form to LPP in Canonical form. Simplex—Prevention of cyclic computations In Simplex and Tableau, Big-M method, dual simplex and revised simplex. Complexity of simplex algorithm(s). Exponential behaviour of simplex. Ellpso1d method and Karmakar’s method for solving LPPs. Solving simple LPPs through. these methods. Comparison of complexity of these methods. Assignment and Thmsportatlon Problems: Simple algorithms like Hungarian method, etc. Shortest Path Problems: DiJkstra’s and Moore’s method. Complexity. Network Flow Problem: Formulation. Max-Flow Mm-Cut theorem. Ford and Fulkerson’s algorithm. Exponential behaviour of Ford and Fulkerson’s algorithm. Ma1hotraPramodkumar-MaheShw (MPM) Polynomial algorithm for solving Network flow problem. Bipartite Graphs and Matchings: Solving matching problems using Network flow problems. Matroids: Definition. Graphic and Cographic matrolds. Matroid Intersection problem. Non-linear Programming : Kuhn-Tucker conditions. Convex functions and Convex regions. Convex programming problems. Algorithms for solving convex programming problems—Rate of convergence of iterative methods for solving these problems. Elective—IV Neuro.L Networks: Perceptron model. Linear separability and XOR problem. Two and three layered neural nets. BackpropagatiOfl_COflVergeflce. HopfIeld nets. Neural net learning. Applications. Fuzzy Systems: Definition of a Fuzzy set, Fuzzy relations, Fuzzy functions, Fuzzy measures, Fuzzy reasoning. Applications of Fuzzy systems. Elective-V Unix : Operating System. Structure of Unix Operating System. Unix Commands. Interfacing with Unix. Editors and Compilers for Unix, L,EX and YACC, File system. System calls. Filters. Shell programming. Windows : Windows environment, Urticode. Documents and Views. Drawing in a window, Message handling. Scrolling and Splitting views, Docking toolbars and Status bars, Common dialogs and Controls, MDI. Multlthreadlng. OLE, Active X controls, ATh. Database access, Network programming.
UGC NET Computer Science and Applications Syllabus 2018-DOWNLOAD
Best book for UGC NET Computer Science and Applications
UGC NET Computer Science and Applications Syllabus 2018
0 notes
Photo

New Post has been published on https://punjabassignmenthelp.com/itc538-designing-object-oriented-program/
ITC538 | DESIGNING OBJECT ORIENTED PROGRAM
ITC538 | DESIGNING OBJECT ORIENTED PROGRAM | JAVA
JAVA ASSIGNMENT HELP
Task
Assessment 2 has 20 marks in total. Marks will be scaled according to the value of the assessment.
There are two tasks in assessment 2, Task 1 and Task 2 as below:
Task 1: Value 10 marks
Suppose you are commissioned by the Australian Football Association (AFL) to write a program designed to produce statistics based on complete scores recorded in a season. These scores are kept in a file called afl.txt (available on interact resources). You are also given the following information about a football season:
League consists of 18 football teams
There are 22 rounds in each season
In each round teams play against each other and the score of each team is recorded as an integer and kept in the text file referred to above (aft.txt)
Your task is to write a complete java program (a java class with the main method) called ProcessScores, which will read the scores from the text file provided, store the scores in an array of integers and then using a number of independent staticmethods, calculate and display the required statistics relating the afl scores.
The java class you are required to author will contain the following static methods:
lowest will take the array of scores as an argument and return the lowest score in the season highest will take the array of scores as an argument and return the highest score in the season
range will take the array of scores as an argument and return the difference between the highest score and the lowest score in the season
average will take the array of scores as an argument and return the average of all scores in the season
median will take the array of scores as an argument and return the median score in the season
mode will take the array of scores as an argument and return the mode of the scores in the season
Note that all of the methods described above, should be static methods; user defined methods (you have the write the definition of each yourself); and completely independent of each other (you should not invoke anyone of them within the other method definition). Also, the original array of scores should not be modified by any of the methods.
Ensure that the program is appropriately documented throughout and thoroughly tested to demonstrate its correct operation.
You need to submit java and class files, a short discussion to explain the logic on how the problem has been solved, and sample output (for detail please see marking guide and presentation below).
Task 2: Value 10 marks
Design a class named Light to represent a conference hall light. The class contains:
Three constants named LOW, MEDIUM, and HIGH with the values 1, 2, and 3 to denote Charles Sturt University Subject Outline the light brightness.
A private int data field named brightness that specifies the brightness of the light having a default value of LOW.
A private boolean data field named on that specifies whether the light is on or off having a default value of false.
A string data field named color that specifies the color of the light having a default value of red.
The accessor and mutator methods for all three data fields.
A no-arg/default constructor that creates a default light.
A method named toString() that returns a string description for the light. If the light is on, the method returns the fan brightness and color in one combined string. If the light is not on, the method returns the fan color along with the string “light is off” in one combined string. Draw the UML diagram for the class and then implement the class.
Write a test program TestLight that creates two Light objects. Assign high brightness, color yellow, and turn it on to the first object. Assign medium brightness, color blue, and turn it off to the second object. Display the objects by invoking their respective toString methods.
Ensure that the program is appropriately documented throughout and thoroughly tested to demonstrate its correct operation.
You need to submit java and class files, a short discussion to explain the logic on how the problem has been solved, UML diagram, and sample output (for detail please see marking guide and presentation below).
Rationale
This assignment has been designed to allow students to test and demonstrate their ability to:
design and implement algorithms in Java (learning outcome 1);
interpret and evaluate design requirements expressed in Unified Modelling Language (UML) (learning outcome 2);
use object-oriented techniques and Java resources to develop small applications consisting of a number of classes (learning outcome 4);
apply testing and debugging techniques in program development (learning outcome 5);
Marking criteria
Assessment 2 (Total Marks 20)
Task 1 (Total Marks 10)
Criteria Marks HD DI CR PS Program a. Execution: Program executes Provided java Provided java perfectly Provided java launches, executes and program executes program may be without program executes terminates without 1.0 without crashing incomplete and/or crashing without crashing crashing; program executes with minimal executes with towards with some errors as specified. errors some errors intended output
Implement Implement Implement Implement and integrate ProcessScores ProcessScores class ProcessScores classes with class with most of with majority of class with some all functions the functions and the functions and functions and
Criteria Marks HD DI CR PS
by integrate the mark integrate the mark then combine it maintaining class with it for class with it for with Marks class logical flow testing testing for testing Excellent naming, Good naming, Most naming, Some naming, indentation, indentation, indentation, indentation, header header and header and inline and inline header and inline inline comments comments comments included comments included included included
All of the Most of the Just enough of the required Majority of the d. Submission: the required required documents required documents documents with all documents and documents and components (analysis, 1.0 and sufficient sufficient number and sufficient sufficient number testing, and output) number of of test outputs number of test of test outputs test outputs outputs provided provided provided provided
Task 2 (Total Marks 10)
Criteria Marks HD DI CR PS Program Provided java a. Execution: Program executes Provided java program Provided java launches, executes and perfectly program may be executes program executes terminates without crashing; 1.0 without incomplete and/or without without crashing program executes as crashing executes with crashing with with some errors specified. towards some errors minimal errors intended output
Implement and Implement and Implement Light Implement Light integrate all of integrate most and TestLight and TestLight of the Light and classes with classes with some 6.0 the Light and TestLight majority functions functions and TestLight classes and combine them combine them for classes functionaliies for testing testing UML with all UML with most UML with UML with components components and majority incomplete 1.0 and their their parameter, components and components and parameter, and and return their parameter, their parameter, return and return and return All of the Most of the Majority of the Just enough of the required required required required documents and documents and documents and documents and 1.0 sufficient sufficient sufficient number sufficient number number of test number of test of test outputs of test outputs outputs outputs provided provided provided provided All of the Most of the Majority of the Just enough of the required required required required documents and documents and documents and documents and 1.0 sufficient sufficient sufficient number sufficient number number of test number of test of test outputs of test outputs outputs outputs provided provided provided provided
Punjab Assignment Help
Buy Online Assignment Help services for JAVA ASSIGNMENT with Punjab Assignment Help at [email protected]
0 notes
Text
Understanding Tableau Data Types: The Key to Effective Visualizations

If you’re diving into Tableau, one of the most important concepts to grasp early on is how Tableau handles different types of data. Data types are fundamental because they tell Tableau how to interpret your information, which directly influences everything from filtering and grouping to analysis and dashboard design.
Whether you’re a beginner or enrolled in the Best Tableau Training in Chandigarh, mastering data types will help you avoid common pitfalls and build accurate, insightful dashboards. In this guide, we’ll explore Tableau’s key data types with clear examples and practical advice on when and how to use each.
Why Do Data Types Matter in Tableau?
Before getting into the details, let’s understand why data types are so important. Each field in Tableau is assigned a data type, guiding the software on how to treat the data. When your data types are set correctly, you’ll be able to perform precise calculations, apply the right filters, and create visualizations that truly represent your data story.
Imagine trying to calculate total sales from a field that Tableau mistakenly treats as text. This would lead to errors and confusion. Similarly, mapping location data won’t work properly unless Tableau recognizes it as geographic data.
Correct data types mean your dashboards run smoothly, your insights are trustworthy, and your analysis is meaningful.
The Six Main Data Types in Tableau
Here’s a straightforward look at the primary data types you’ll encounter in Tableau and how they fit into your projects.
1. String (Text)
String data includes any combination of letters, numbers, or symbols treated as text. This typically covers names, codes, or categorical labels.
Example: Customer Name, Region, Product Code.
You’ll use strings mainly for grouping, labeling, and filtering. For example, if you want to show sales by region, “Region” will be a string field to categorize the data correctly.
Tip: Keep an eye on case sensitivity with strings, as Tableau treats “USA” and “usa” differently. Consistent formatting here is essential.
2. Number (Integer and Decimal)
Numbers are vital for calculations and metrics. Tableau distinguishes between whole numbers (integers) and decimals (floating-point).
Example: Order Quantity (100), Revenue (250.75).
Numbers allow you to calculate totals, averages, percentages, and more. These fields form the backbone of KPIs and trend charts.
Tip: Always verify that Tableau recognizes your numbers correctly. Mistaking decimals for whole numbers can skew your calculations.
3. Date and Time
Date/time data lets Tableau understand when events occur, enabling powerful chronological analysis.
Example: Order Date (“2024-06-01”), Time (“12:30 PM”).
Using date and time fields, you can analyze trends over days, months, or years, spot seasonal patterns, and compare performance across periods.
Tip: Tableau automatically groups dates into years, quarters, months, or days, making it easier to explore data at different time scales.
4. Boolean
Boolean data has only two values: TRUE or FALSE. It’s perfect for yes/no or on/off situations.
Example: Is Active, Is New Customer.
Boolean fields are useful for filters and logical calculations, such as isolating all active customers or highlighting overdue payments.
Tip: You can create Boolean fields with calculated formulas like [Sales] > 1000 to flag high-value transactions.
5. Geographic
Tableau shines with geographic data, automatically mapping locations for spatial analysis.
Example: Country, State, ZIP Code, Latitude/Longitude.
Geographic data types enable map visualizations that reveal patterns by region, helping with customer distribution, sales territories, and more.
Tip: While Tableau often auto-detects geographic roles, verify and adjust them to ensure your maps are accurate and meaningful.
6. Cluster or Mixed Data Type
Sometimes, Tableau encounters fields that mix data types, often in raw or unstructured datasets.
Example: A field containing both text and numbers.
Mixed data types can slow down analysis or cause errors, so it’s best to clean or split these fields before visualizing.
Tip: Use data preparation tools or calculated fields to separate mixed types for smoother Tableau performance.
How to Identify and Change Data Types in Tableau
Tableau typically assigns data types automatically when you connect your data source, but it’s not always perfect. You can easily check and change data types by:
Right-clicking the field in the Data Pane
Selecting “Change Data Type”
Choosing the correct type from the dropdown list
Correcting data types early prevents errors, improves dashboard speed, and helps Tableau recommend the best visualization types for your data.
Conclusion
Data types are the foundation of effective data visualization in Tableau. Knowing how to identify, modify, and apply them correctly sets you apart as a skilled user who builds dashboards that are not only visually attractive but also accurate and insightful.
Whether you’re learning on your own or taking the Best Tableau Training in Chandigarh, start by practicing with sample datasets and focusing on data types. This small but vital step will unlock clearer insights and smoother analysis.
Remember, great dashboards begin with great data management. Master data types today, and watch your Tableau skills—and your data’s impact—grow.
0 notes
Photo

New Post has been published on https://punjabassignmenthelp.com/itc538-designing-object-oriented-program/
ITC538 | DESIGNING OBJECT ORIENTED PROGRAM
ITC538 | DESIGNING OBJECT ORIENTED PROGRAM | JAVA
JAVA ASSIGNMENT HELP
Task
Assessment 2 has 20 marks in total. Marks will be scaled according to the value of the assessment.
There are two tasks in assessment 2, Task 1 and Task 2 as below:
Task 1: Value 10 marks
Suppose you are commissioned by the Australian Football Association (AFL) to write a program designed to produce statistics based on complete scores recorded in a season. These scores are kept in a file called afl.txt (available on interact resources). You are also given the following information about a football season:
League consists of 18 football teams
There are 22 rounds in each season
In each round teams play against each other and the score of each team is recorded as an integer and kept in the text file referred to above (aft.txt)
Your task is to write a complete java program (a java class with the main method) called ProcessScores, which will read the scores from the text file provided, store the scores in an array of integers and then using a number of independent staticmethods, calculate and display the required statistics relating the afl scores.
The java class you are required to author will contain the following static methods:
lowest will take the array of scores as an argument and return the lowest score in the season highest will take the array of scores as an argument and return the highest score in the season
range will take the array of scores as an argument and return the difference between the highest score and the lowest score in the season
average will take the array of scores as an argument and return the average of all scores in the season
median will take the array of scores as an argument and return the median score in the season
mode will take the array of scores as an argument and return the mode of the scores in the season
Note that all of the methods described above, should be static methods; user defined methods (you have the write the definition of each yourself); and completely independent of each other (you should not invoke anyone of them within the other method definition). Also, the original array of scores should not be modified by any of the methods.
Ensure that the program is appropriately documented throughout and thoroughly tested to demonstrate its correct operation.
You need to submit java and class files, a short discussion to explain the logic on how the problem has been solved, and sample output (for detail please see marking guide and presentation below).
Task 2: Value 10 marks
Design a class named Light to represent a conference hall light. The class contains:
Three constants named LOW, MEDIUM, and HIGH with the values 1, 2, and 3 to denote Charles Sturt University Subject Outline the light brightness.
A private int data field named brightness that specifies the brightness of the light having a default value of LOW.
A private boolean data field named on that specifies whether the light is on or off having a default value of false.
A string data field named color that specifies the color of the light having a default value of red.
The accessor and mutator methods for all three data fields.
A no-arg/default constructor that creates a default light.
A method named toString() that returns a string description for the light. If the light is on, the method returns the fan brightness and color in one combined string. If the light is not on, the method returns the fan color along with the string “light is off” in one combined string. Draw the UML diagram for the class and then implement the class.
Write a test program TestLight that creates two Light objects. Assign high brightness, color yellow, and turn it on to the first object. Assign medium brightness, color blue, and turn it off to the second object. Display the objects by invoking their respective toString methods.
Ensure that the program is appropriately documented throughout and thoroughly tested to demonstrate its correct operation.
You need to submit java and class files, a short discussion to explain the logic on how the problem has been solved, UML diagram, and sample output (for detail please see marking guide and presentation below).
Rationale
This assignment has been designed to allow students to test and demonstrate their ability to:
design and implement algorithms in Java (learning outcome 1);
interpret and evaluate design requirements expressed in Unified Modelling Language (UML) (learning outcome 2);
use object-oriented techniques and Java resources to develop small applications consisting of a number of classes (learning outcome 4);
apply testing and debugging techniques in program development (learning outcome 5);
Marking criteria
Assessment 2 (Total Marks 20)
Task 1 (Total Marks 10)
Criteria Marks HD DI CR PS Program a. Execution: Program executes Provided java Provided java perfectly Provided java launches, executes and program executes program may be without program executes terminates without 1.0 without crashing incomplete and/or crashing without crashing crashing; program executes with minimal executes with towards with some errors as specified. errors some errors intended output
Implement Implement Implement Implement and integrate ProcessScores ProcessScores class ProcessScores classes with class with most of with majority of class with some all functions the functions and the functions and functions and
Criteria Marks HD DI CR PS
by integrate the mark integrate the mark then combine it maintaining class with it for class with it for with Marks class logical flow testing testing for testing Excellent naming, Good naming, Most naming, Some naming, indentation, indentation, indentation, indentation, header header and header and inline and inline header and inline inline comments comments comments included comments included included included
All of the Most of the Just enough of the required Majority of the d. Submission: the required required documents required documents documents with all documents and documents and components (analysis, 1.0 and sufficient sufficient number and sufficient sufficient number testing, and output) number of of test outputs number of test of test outputs test outputs outputs provided provided provided provided
Task 2 (Total Marks 10)
Criteria Marks HD DI CR PS Program Provided java a. Execution: Program executes Provided java program Provided java launches, executes and perfectly program may be executes program executes terminates without crashing; 1.0 without incomplete and/or without without crashing program executes as crashing executes with crashing with with some errors specified. towards some errors minimal errors intended output
Implement and Implement and Implement Light Implement Light integrate all of integrate most and TestLight and TestLight of the Light and classes with classes with some 6.0 the Light and TestLight majority functions functions and TestLight classes and combine them combine them for classes functionaliies for testing testing UML with all UML with most UML with UML with components components and majority incomplete 1.0 and their their parameter, components and components and parameter, and and return their parameter, their parameter, return and return and return All of the Most of the Majority of the Just enough of the required required required required documents and documents and documents and documents and 1.0 sufficient sufficient sufficient number sufficient number number of test number of test of test outputs of test outputs outputs outputs provided provided provided provided All of the Most of the Majority of the Just enough of the required required required required documents and documents and documents and documents and 1.0 sufficient sufficient sufficient number sufficient number number of test number of test of test outputs of test outputs outputs outputs provided provided provided provided
Punjab Assignment Help
Buy Online Assignment Help services for JAVA ASSIGNMENT with Punjab Assignment Help at [email protected]
0 notes
Text
ITC538 | DESIGNING OBJECT ORIENTED PROGRAM
New Post has been published on https://punjabassignmenthelp.com/itc538-designing-object-oriented-program/
ITC538 | DESIGNING OBJECT ORIENTED PROGRAM
ITC538 | DESIGNING OBJECT ORIENTED PROGRAM | JAVA
JAVA ASSIGNMENT HELP
Task
Assessment 2 has 20 marks in total. Marks will be scaled according to the value of the assessment.
There are two tasks in assessment 2, Task 1 and Task 2 as below:
Task 1: Value 10 marks
Suppose you are commissioned by the Australian Football Association (AFL) to write a program designed to produce statistics based on complete scores recorded in a season. These scores are kept in a file called afl.txt (available on interact resources). You are also given the following information about a football season:
League consists of 18 football teams
There are 22 rounds in each season
In each round teams play against each other and the score of each team is recorded as an integer and kept in the text file referred to above (aft.txt)
Your task is to write a complete java program (a java class with the main method) called ProcessScores, which will read the scores from the text file provided, store the scores in an array of integers and then using a number of independent staticmethods, calculate and display the required statistics relating the afl scores.
The java class you are required to author will contain the following static methods:
lowest will take the array of scores as an argument and return the lowest score in the season highest will take the array of scores as an argument and return the highest score in the season
range will take the array of scores as an argument and return the difference between the highest score and the lowest score in the season
average will take the array of scores as an argument and return the average of all scores in the season
median will take the array of scores as an argument and return the median score in the season
mode will take the array of scores as an argument and return the mode of the scores in the season
Note that all of the methods described above, should be static methods; user defined methods (you have the write the definition of each yourself); and completely independent of each other (you should not invoke anyone of them within the other method definition). Also, the original array of scores should not be modified by any of the methods.
Ensure that the program is appropriately documented throughout and thoroughly tested to demonstrate its correct operation.
You need to submit java and class files, a short discussion to explain the logic on how the problem has been solved, and sample output (for detail please see marking guide and presentation below).
Task 2: Value 10 marks
Design a class named Light to represent a conference hall light. The class contains:
Three constants named LOW, MEDIUM, and HIGH with the values 1, 2, and 3 to denote Charles Sturt University Subject Outline the light brightness.
A private int data field named brightness that specifies the brightness of the light having a default value of LOW.
A private boolean data field named on that specifies whether the light is on or off having a default value of false.
A string data field named color that specifies the color of the light having a default value of red.
The accessor and mutator methods for all three data fields.
A no-arg/default constructor that creates a default light.
A method named toString() that returns a string description for the light. If the light is on, the method returns the fan brightness and color in one combined string. If the light is not on, the method returns the fan color along with the string “light is off” in one combined string. Draw the UML diagram for the class and then implement the class.
Write a test program TestLight that creates two Light objects. Assign high brightness, color yellow, and turn it on to the first object. Assign medium brightness, color blue, and turn it off to the second object. Display the objects by invoking their respective toString methods.
Ensure that the program is appropriately documented throughout and thoroughly tested to demonstrate its correct operation.
You need to submit java and class files, a short discussion to explain the logic on how the problem has been solved, UML diagram, and sample output (for detail please see marking guide and presentation below).
Rationale
This assignment has been designed to allow students to test and demonstrate their ability to:
design and implement algorithms in Java (learning outcome 1);
interpret and evaluate design requirements expressed in Unified Modelling Language (UML) (learning outcome 2);
use object-oriented techniques and Java resources to develop small applications consisting of a number of classes (learning outcome 4);
apply testing and debugging techniques in program development (learning outcome 5);
Marking criteria
Assessment 2 (Total Marks 20)
Task 1 (Total Marks 10)
Criteria Marks HD DI CR PS Program a. Execution: Program executes Provided java Provided java perfectly Provided java launches, executes and program executes program may be without program executes terminates without 1.0 without crashing incomplete and/or crashing without crashing crashing; program executes with minimal executes with towards with some errors as specified. errors some errors intended output
Implement Implement Implement Implement and integrate ProcessScores ProcessScores class ProcessScores classes with class with most of with majority of class with some all functions the functions and the functions and functions and
Criteria Marks HD DI CR PS
by integrate the mark integrate the mark then combine it maintaining class with it for class with it for with Marks class logical flow testing testing for testing Excellent naming, Good naming, Most naming, Some naming, indentation, indentation, indentation, indentation, header header and header and inline and inline header and inline inline comments comments comments included comments included included included
All of the Most of the Just enough of the required Majority of the d. Submission: the required required documents required documents documents with all documents and documents and components (analysis, 1.0 and sufficient sufficient number and sufficient sufficient number testing, and output) number of of test outputs number of test of test outputs test outputs outputs provided provided provided provided
Task 2 (Total Marks 10)
Criteria Marks HD DI CR PS Program Provided java a. Execution: Program executes Provided java program Provided java launches, executes and perfectly program may be executes program executes terminates without crashing; 1.0 without incomplete and/or without without crashing program executes as crashing executes with crashing with with some errors specified. towards some errors minimal errors intended output
Implement and Implement and Implement Light Implement Light integrate all of integrate most and TestLight and TestLight of the Light and classes with classes with some 6.0 the Light and TestLight majority functions functions and TestLight classes and combine them combine them for classes functionaliies for testing testing UML with all UML with most UML with UML with components components and majority incomplete 1.0 and their their parameter, components and components and parameter, and and return their parameter, their parameter, return and return and return All of the Most of the Majority of the Just enough of the required required required required documents and documents and documents and documents and 1.0 sufficient sufficient sufficient number sufficient number number of test number of test of test outputs of test outputs outputs outputs provided provided provided provided All of the Most of the Majority of the Just enough of the required required required required documents and documents and documents and documents and 1.0 sufficient sufficient sufficient number sufficient number number of test number of test of test outputs of test outputs outputs outputs provided provided provided provided
Punjab Assignment Help
Buy Online Assignment Help services for JAVA ASSIGNMENT with Punjab Assignment Help at [email protected]
0 notes
Text
300+ TOP VBA Interview Questions and Answers
VBA Interview Questions for freshers experienced :-
1. What is VBA or Visual Basic for Applications? VBA stands for Visual Basic for Applications; it is an event driven programming language developed by Microsoft. It is predominantly used with Microsoft office applications like MS-word, MS-Access, and MS-Excel. 2. Explain where you can write your VBA program for Macro? Module is the place where you can write VBA program for Macro, to insert a Module navigate to Insert -> Module 3. What are the comments style used in VBA? Comments are used to document the program logic and the user information with which other programmers can work seamlessly on the same code in future. There are mainly two methods in VBA to represent comments. Any statement that begins with a single quote is treated as comment Or you can use statement REM instead of single quotation mark (‘) 4. In VBA how we can declare variable and constant? In VBA, variable can be declared with the keyword “DIM” while constant is declared with keyword “Const.” 5. What are the data types in VBA? Data types in VBA are classified into two categories Numeric Data type Non-numeric Data type Byte String (fixed length) Integer String (variable length) Long Date Single Boolean Double Object Currency Variant (numeric) Decimal Variant (text) 6. What is ADO, ODBC and OLEDB? ADO: ActiveX Data Objects or ADO is a universal data access framework that encompasses the functionality of DAO ODBC: Open Database Connectivity or ODBC is a technology that enables a database client application connect to an external database OLEDB: It is a low-level programming interface designed to access a wide variety of data access object linking and embedding (OLE) 7. Explain about function pointers in VBA? The VBA (Visual Basic Information) have flexible applications, but there is a limitation to a function pointer in VBA. Windows API has inadequate support for function pointers because it has the ability to use the function but not the functional support to call back the function. It has inbuilt support for the call but not for a callback. 8. How “reference counting” in VBA is done? In VBA, soon a variable goes out of scope, the reference counter on the reference object is decremented. When you assign the object reference to another variable, the reference counter is incremented. While when your reference count reaches to zero it terminates the event. 9. How can you decrease the reference counter explicitly? To decrease the reference counter explicitly, you need to set a variable to “Nothing”. 10. What is COM (Component Object Model) objects in VBA? COM objects are usually .dll files, and are compiled executable programs.

VBA Interview Questions 11. How can you dial a phone number through VBA? In order to dial a phone number through VBA, you need to follow the following steps Shell command in VBA can be used to start the dialer present in Windows O.S To connect to your modem, phone number can be used With the help of send keys and shell command, you can dial to your user Sendkey dictate the windows to dial according to the keystrokes of the application while Shell activates the Windows application A macro can be used to initiate the card file program which triggers the auto dialer feature 12. What is the meaning of “Option Explicit”? Where it should be used? “Option Explicit” makes the declaration of variables mandatory. Line explicit function makes the compiler to determine all the variables that are not declared by the dim statement. This command diminishes the problem of type errors significantly. It is used in VBA because it deals with information rich application in which type errors are common. Before starting any, sub-procedures it can be used inside a module. 13. How can you pass arguments to VBA functions? When arguments are passed to VBA functions, they can be passed in two ways ByVal: When argument is passed by Value, then it means that only value is passed to the procedure, and any changes that are made to the argument inside the procedure will be lost when the procedure is exited ByRef: When the argument is passed by reference than the actual address of the argument is passed to the procedure. Any changes that are made to the argument inside the procedure will be recalled when the procedure is exited 14. Explain the method that are called from the ObjectContext object to notify MTS that the transaction was unsuccessful or successful? Setabort and setcomplete method are called from the ObjectContext object to notify MTS that the transaction was unsuccessful or unsuccessful 15. What is the code to find a last used Row in a column or last used Column of a row? To find the last row in a column, the command used is End(xlUp) and to find last column in a row, the command used is End(xlToLeft). 16. Mention the difference between the Subroutines and Functions in VBA? The difference between the Subroutines and Functions is that Subroutines never return a value, but functions does return values Subroutines could change the values of the actual arguments while a function could not change the value of actual arguments 17. What is the difference between CurrentRegion properties and UsedRange? CurrentRegion: The current region is a range bounded by any combination of blank columns and rows UsedRange: This property is used to select the range of used cells on a worksheet. It returns a Range object that represents the used range on the specific worksheet 18. How to debug a VBA code? To debug a VBA code, follow the steps Using Breakpoints (F9) Step by step execution (F8) Print & Immediate Window and Watch the window 19. How can you stop VBA script when it goes into the infinite loop? By pressing Cntrl+ Pause Break key one can stop VBA script when it goes into infinite loop. 20. Mention which property of menu cannot be set at runtime? At runtime Name property of menu cannot be set. 21. Mention whether VBA have dictionary structure? Yes, VBA does have a dictionary structure. You can set a reference to dictionary like Set dict = CreateObject(“Scripting.Dictionary”) OR Dim dict as New Scripting.Dictionary 22. Mention how can you comment and uncomment blocks of code in the office VBA editor? In office VBA editor, you can comment and uncomment blocks of code by following steps In the VBA editor go to View ->Toolbars -> Customise… OR right click on the tool bar and select Customise Select the edit menu on the left, under the commands tab When you scroll down you can see two icons, “Comment Block” and “Uncomment ” When you drag and drop these onto your toolbar, you will have an easy access to highlight a block of code and do action on it 23. What does goal seek feature in excel? It allows to adjust a value used in a formula to achieve specific goal. 24. What is solver? Solver is an ad in to use for what if analysis and it can find optimal value for a formula in one cell. 25. What is offset function in excel? It is a function which returns cell or ranges and move right or left by specified number of column and rows. 26. What is Choose function in excel? It is a lookup function which returns a value from a list of values based on position. 27. What does filter in excel? It is feature which allow to retrieve the set of data based on criteria. 28. What is sort function in excel? It allows to sort the range or table by ascending or descending. 29. What is number of rows and columns in excel 2019? 1,048,576 rows and 16,384 columns. 30. What is name manager in excel? It is designed to manage names. 31. What is IFERROR function in excel? It returns custom result when a function generates error. 32. What is slicer in excel? It is new way to filter the pivot table. 33. What is sparklines in excel? It is a tiny chart in cell which provides visual representation of data. 34. What is freeze pane in excel? it is excel feature which allows to keep visible rows and columns while scrolling to other area of sheet. 35. What does hyperlink in excel? It returns hyperlink from given destination. 36. What is ribbon? It is set of toolbars at top of the window. 37. What is Macro? It allows to record the repeated tasks. 38. What is function? It is routine or procedure which performs a specific task. 39. What sub procedure? It is procedure that doesn’t return values. 40. What is User defined function? It is custom function which could be created using VBA. 41. Can be UDF be called in a macro Yes 42 What is option explicit? If a module contains Option Explicit, then variable must be declared all the variables explicitly. 43. What is array? It is group of variable and it is capable of storing more than one variable. 44. What is ReDim? It is used to size or resize a dynamic array that has been already declared. 45. What is scope of variable in excel vba? it has defined scope and it could be local variable, module level, project level and global level. 46. How to comment in excel vba? using apostrophe 47. What is variant in excel vba? It is default data type and it can hold any type of data. 48. What is CurrentRegion Properties? It is a range bounded any combination of columns and rows. 49. What is UsedRange? It is used to select the range of used cells. 50. Is vba has dictionary structure? Yes, it has Dictionary Structure. 51. what is scenario manager in excel? It is set of values that saves and could substitute cells on a worksheet and create different scenarios to view the results. VBA Questions and Answers Pdf Download Read the full article
0 notes