#threadlocal
Explore tagged Tumblr posts
Visit Tumblr Blog
Explore Tumblr blogs with no restrictions, modern design and the best experience.
Last Seen Tumblr Blogs


Fun Fact
70% of Tumblr users say the Dashboard is their favorite place to spend time online.
Text
2 notes
·
View notes
Text
Splunk is a popular choice for log analytics. I am a java developer and really love to use splunk for production analytics. I have used splunk for more than 5 years and like its simplicity. This article is a list of best practices that I have learned from good splunk books and over my splunk usage in everyday software projects. Most of the learnings are common for any software architect however it becomes important to document them for new developers. This makes our life easier in maintaining the software after it goes live in production. Almost any software becomes difficult change after its live in production. There are some many things you may need to worry about. Using these best practices while implementing splunk in your software will help you in long run. First Thing First : Keep Splunk Logs Separate Keep splunk log separate from debug / error logs. Debug logs can be verbose. Define a separate splunk logging file in your application. This will also save you on licensing cost since you will not index unwanted logs. Use Standard Logging Framework Use existing logging framework to log to splunk log files. Do not invent your own logging framework. Just ensure to keep the log file separate for splunk. I recommend using Asynchronous logger to avoid any performance issues related to too much logging. Some popular choice of logging frameworks in Java are listed below Log4j SLF4J Apache commons logging Logback Log In KEY=VALUE Format Follow Key=Value format in splunk logging - Splunk understands Key=Value format, so your fields are automatically extracted by splunk. This format is also easier to read without splunk too. You may want to follow this for all other logs too. Use Shorter KEY Names Keep the key name short - preferable size should be less than 10 characters. Though you may have plenty of disc space. Its better to keep a tap on how much you log since it may create performance problems in long run. At the same time keep them understandable. Use Enums For Keys Define a Java Enum for SplunkKeys that has Description of each key and uses name field as the splunk key. public enum SplunkKey TXID("Transaction id"); /** * Describes the purpose of field to be splunked - not logged */ private String description; SplunkKey(String description) this.description = description; public String getDescription() return description; Create A Util Class To Log In Splunk Define a SplunkAudit class in project that can do all splunk logging using easy to call methods. public class SplunkAudit private Map values = new HashMap(); private static ThreadLocal auditLocal = new ThreadLocal(); public static SplunkAudit getInstance() SplunkAudit instance = auditLocal.get(); if (instance == null) instance = new SplunkAudit(); auditLocal.set(instance); return instance; private SplunkAudit() public void add(SplunkKey key, String message) values.put(key.name(), message); public void flush() StringBuilder fullMessage = new StringBuilder(); for (Map.Entry val : values.entrySet()) fullMessage.append(val.getKey()); fullMessage.append("="); fullMessage.append(val.getValue()); fullMessage.append(" "); //log the full message now //log.info(fullMessage); Collect the Splunk Parameters (a collection of key,value pairs ) in transaction and log them at the end of transaction to avoid multiple writes. Use Async Log Writer Its recommended to use async logger for splunk logs. Async logging will perform logging in a separate thread. Below are some options Async Logger Appender for Log4j Logback Async Appender Setup Alerts Setup Splunk queries as alerts - get automatic notifications. Index GC Logs in Splunk Index Java Garbage Collection Logs separately in splunk.
The format of GC log is different and it may get mixed with your regular application logs. Therefore its better to keep it separate. Here are some tips to do GC log analytics using splunk. Log These Fields Production logs are key to debug problems in your software. Having following fields may always be useful. This list is just the minimum fields, you may add more based on your application domain. ThreadName Most important field for Java application to debug and identify multithreading related problems. Ensure every thread has a logical name in your application. This way you can differentiate threads. For example transaction threads and background threads may have different prefix in thread name. Ensure to give a unique id for each thread. Its super easy to set thread names in java. One line statement will do it. Thread.currentThread().setName(“NameOfThread-UniqueId”) Thread Count Print count of threads at any point in time in JVM. Below one liner should provide you java active thread count at any point in JVM. java.lang.Thread.activeCount() Server IP Address Logging the server IP address become essential when we are running the application on multiple servers. Most enterprise application run cluster of servers. Its important to be able to differentiate errors specific to a special server. Its easy to get IP address of current server. Below line of code should work for most places (unless the server has multiple ip addresses) InetAddress.getLocalHost().getHostAddress() Version Version of software source from version control is important field. The software keeps changing for various reasons. You need to be able to identify exact version that is currently live on production. You can include your version control details in manifest file of deployable war / ear file. This can be easily done by maven. Once the information is available in your war/ear file, it can be read in application at runtime and logged in splunk log file. API Name Every application performs some tasks. It may be called API or something else. These are the key identifier of actions. Log unique API names for each action in your application. For example API=CREATE_USER API=DELETE_USER API=RESET_PASS Transaction ID Transaction id is a unique identifier of the transaction. This need not be your database transaction id. However you need a unique identifier to be able to trace one full transaction. User ID - Unique Identifier User identification is important to debug many use cases. You may not want to log user emails or sensitive info, however you can alway log a unique identifier that represents a user in your database. Success / Failure of Transaction Ensure you log success or failure of a transaction in the splunk. This will provide you a easy trend of failures in your system. Sample field would look like TXS=S (Success transaction) TXS=F (Failed transaction) Error Code Log error codes whenever there is a failure. Error codes can uniquely identify exact scenario therefore spend time defining them in your application. Best way is to define enum of ErrorCodes like below public enum ErrorCodes INVALID_EMAIL(1); private int id; ErrorCodes(int id) this.id = id; public int getId() return id; Elapsed Time - Time Taken to Finish Transaction Log the total time take by a transaction. It will help you easily identify the transactions that are slow. Elapsed Time of Each Major Component in Transaction If you transaction is made of multiple steps, you must also include time take for each step. This can narrow down your problem to the component that is performing slow. I hope you find these tip useful. Please share with us anything missed in this page.
0 notes
Text
Understanding the Java Virtual Machine (JVM): Internals and Optimization

Introduction
Briefly introduce the JVM and its role in running Java applications.
Highlight why understanding JVM internals is crucial for developers.
Mention key aspects like performance, memory management, and optimizations.
1. JVM Architecture: An Overview
Explain how JVM acts as an abstraction layer between Java code and the underlying hardware.
Key components:
Class Loader: Loads bytecode into memory.
Runtime Memory Areas: Heap, Stack, Method Area, etc.
Execution Engine: Converts bytecode into native code.
Garbage Collector (GC): Manages memory automatically.
2. JVM Memory Management
Heap vs. Stack Memory: What each is used for.
Method Area & Runtime Constant Pool: Storage for metadata and constants.
Garbage Collection (GC) Mechanisms:
Serial, Parallel, CMS, G1, and ZGC collectors.
When and how GC runs.
Tuning GC for performance (using JVM options like -XX:+UseG1GC).
3. Just-In-Time (JIT) Compilation
How JIT compiles frequently used bytecode into native machine code for performance.
Difference between:
Interpreter Mode (slower execution but quick startup).
JIT Compilation (optimizes hot code paths).
JVM optimizations like:
Method Inlining
Loop Unrolling
Escape Analysis
4. JVM Optimization Techniques
Tuning JVM with Command-line Flags
-Xms and -Xmx for memory allocation.
-XX:+PrintGCDetails for monitoring GC.
Profiling and Monitoring Tools
JVisualVM, JConsole, Java Flight Recorder.
Code-level Optimizations
Reducing object creation to avoid excessive GC.
Using efficient data structures (ArrayList vs. LinkedList).
Avoiding memory leaks (proper use of WeakReferences, ThreadLocal).
5. JVM Performance Best Practices
Selecting the right GC algorithm for different workloads.
Analyzing JVM logs to detect performance bottlenecks.
Using Ahead-of-Time (AOT) Compilation (like GraalVM) for even faster execution.
Conclusion
Summarize key takeaways: JVM architecture, memory management, JIT compilation, and optimizations.
Emphasize the importance of tuning JVM settings for different applications.
WEBSITE: https://www.ficusoft.in/core-java-training-in-chennai/
0 notes
Text
java q
try-catch block with a return statement typically looks like this there’s a return statement in the finally block, it will override the return in both try and catch, as finally always executes last:
…
to access a non-static (instance) variable or method from a static context (like a static method), you need an instance of the class.
Hprof file (Heap Profiler) is a binary file generated by Java applications to capture memory snapshots or heap dumps.
ThreadLocal in Java is a class that provides thread-local variables. Each thread accessing a ThreadLocal variable has its own, independent copy of the variable, ensuring that it’s not shared across threads. This is particularly useful when you want to prevent concurrent access issues or ensure that certain data is not shared across threads, for example, in scenarios involving user sessions, transaction contexts, or object caching within a thread.
top command Linux top command is a popular utility in Unix and Linux systems used to monitor system performance and resource usage in real-time.
public String reverseString(String s) { char[] chars = s.toCharArray(); int left = 0; int right = chars.length - 1;while (left < right) { // Swap characters at left and right char temp = chars[left]; chars[left] = chars[right]; chars[right] = temp;
O(n), where n is the length of the string.
Bean A bean is a generic term in Spring for any object managed by the Spring container. A bean is an instance of a class that is created, Component--Components are classes annotated with @Component A component is a specific type of bean, marked with a Spring stereotype annotation, such as @Component,
0 notes
Text
) Explain the internal working of Spring Boot. Spring Boot works by automatically setting up default configurations based on the tools our project uses. It includes built-in servers like Tomcat to run our applications. Special starter packages make it easy to connect with other technologies. We can customize settings with simple annotations and properties files. The Spring Application class starts the app, and Spring Boot Actuator offers tools for monitoring and managing it
) How does a Spring application get started? A Spring application typically starts by initializing a Spring ApplicationContext, which manages the beans and dependencies. In Spring Boot, this is often triggered by calling SpringApplication.run() in the main method, which sets up the default configuration and starts the embedded server if necessary.
What is a Spring Bean? A Spring Bean is an object managed by the Spring framework. The framework creates, configures, and connects these beans for us, making it easier to manage dependencies and the lifecycle of objects.
Spring Boot dependency management makes it easier to handle the dependencies that our project depends on. Instead of manually keeping track of them, Spring Boot helps us manage them automatically
If a starter dependency includes conflicting versions of libraries with other dependencies, Spring Boot's dependency management resolves this by using a concept called "dependency resolution." It ensures that only one version of each library is included in the final application, prioritizing the most compatible version. This helps prevent runtime errors caused by conflicting dependencies and ensures the smooth functioning of the application
How to disable a specific auto-configuration class? We can disable specific auto-configuration classes in Spring Boot by using the exclude attribute of the @EnableAutoConfiguration annotation or by setting the spring.autoconfigure.exclude property in our application.properties or application.yml file.
Describe the flow of HTTPS requests through a Spring Boot application. In a Spring Boot application, HTTPS requests first pass through the embedded server's security layer, which manages SSL/TLS encryption. Then, the requests are routed to appropriate controllers based on URL mappings.
The @SpringBootApplication annotation is a convenience annotation that combines @Configuration, @EnableAutoConfiguration, and @ComponentScan annotations. It is used to mark the main class of a Spring Boot application and trigger auto-configuration and component scanning. On the other hand, @EnableAutoConfiguration specifically enables Spring Boot's auto-configuration mechanism, which attempts to automatically configure our application based on the jar dependencies we have added.
I would:
Use dependency injection to manage dependencies.
Utilize Spring Profiles for environment-specific configurations.
Group related beans in separate configuration classes.
Use @ComponentScan to automatically discover beans.
You have a singleton bean that needs to be thread-safe. What approaches would you take to ensure its thread safety? I would:
Use synchronized methods or blocks to control access to critical sections.
Use ThreadLocal to provide thread-confined objects.
Implement stateless beans where possible to avoid share
To enable Spring Boot Actuator, we simply add the spring-boot-starter-actuator dependency to our project’s build file. O
The dev-tools dependency in Spring Boot provides features that enhance the development experience. It enables automatic restarts of our application when code changes are detected, which is faster than restarting manually.
To test a Spring Boot application, we use different tools and annotations. For testing the whole application together, we use @SpringBootTest. When we want to test just a part of our application, like the web layer, we use @WebMvcTest
How do you handle exceptions in Spring Boot applications? In Spring Boot, I handle errors by creating a special class with @ControllerAdvice or @RestControllerAdvice. This class has methods marked with @ExceptionHandler that deal with different types of errors. These methods help make sure that when something goes wrong, my application responds in a helpful way, like sending a clear error message or a specific error code.
) How can you disable specific auto-configuration classes in Spring Boot? We can disable specific auto-configuration classes in Spring Boot by using the @SpringBootApplication annotation with the exclude attribute. For example, @SpringBootApplication(exclude = {DataSourceAutoConfiguration.class}) will disable the DataSourceAutoConfiguration class.
Versioning in REST APIs helps manage changes without breaking existing clients. It allows different versions of the API to exist at the same time, making it easier for clients to upgrade gradually. We can version REST APIs in several ways: include the version number in the URL (e.g., /api/v1/resource), add a version parameter in the URL (e.g., /api/resource?version=1), use custom headers to specify the version (e.g., Accept: application/vnd.example.v1+json), or use media types for versioning (e.g., application/vnd.example.v1+json).
ResponseEntity in Spring Boot is used to customize responses. It lets us set HTTP status codes, add custom headers, and return response data as Java objects. This flexibility helps create detailed and informative responses. For example, new ResponseEntity<>("Hello, World!", HttpStatus.OK) sends back "Hello, World!" with a status code of 200 OK.
To disable the default server and enable a different one in Spring Boot, exclude the default server dependency in the pom.xml or build.gradle file and add the dependency for the desired server. For example, to switch from Tomcat to Jetty, exclude the Tomcat dependency and include the Jetty dependency in our project configuration.
@ComponentScan annotation in Spring tells the framework where to look for components, services, and configurations. It automatically discovers and registers beans in the specified packages, eliminating the need for manual bean registration and making it easier to manage and scale the application's architecture. EnableAutoConfiguration annotation in Spring Boot tells the framework to automatically configure our application based on the libraries we have included. This means Spring Boot can set up our project with the default settings that are most likely to work well for our setup.
EnableAsync annotation in Spring enables asynchronous method execution. It allows methods to run in the background on a separate thread, improving performance by freeing up the main thread for other tasks.
RestController annotation in Spring marks a class as a RESTful web service controller. It combines @Controller and @ResponseBody, meaning the methods in the class automatically return JSON or XML responses, making it easy to create REST APIs.
EnableScheduling is an annotation in Spring Framework used to enable scheduling capabilities for methods within a Spring application. It allows methods annotated with @Scheduled to be executed based on specified time intervals or cron expressions
0 notes
Text
全面解析多執行緒與同步技術:SYNC、CAS、ThreadLocal
Overview of Content 在這篇全面解析多執行緒與同步技術的文章中,我們將深入探討多執行緒的安全性,從基本的執行緒安全考量點到 Java synchronized 的詳細用法,包括方法、同步區塊、靜態方法和靜態物件的同步 我們還會探討多執行緒之間的協作機制,如 wait 方法與 notify / notifyAll,以及鎖的釋���時機。此外,我們將詳細介紹 ReentrantLock 機制,包括可重入鎖、顯式鎖與隱式鎖、公平鎖與非公平鎖,並解析死鎖與活鎖的概念,樂觀鎖與悲觀鎖的對比 文章還涵蓋了 CAS 原子操作及其在 JDK 中的應用,並通過簡單範例、手動實現及源碼分析,讓讀者全面了解 ThreadLocal 如何實現執行緒隔離。這篇文章將為讀者提供深入的多執行緒與同步技術知識,幫助解決實際開發中的各種挑戰 以下可能會混用…

View On WordPress
0 notes
Text
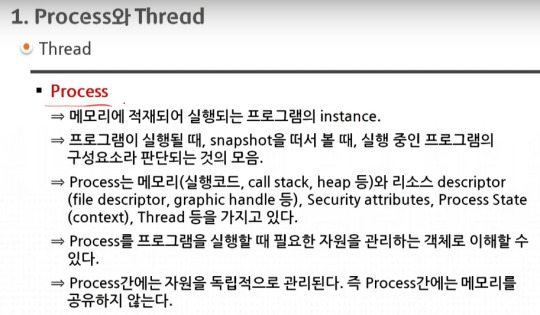
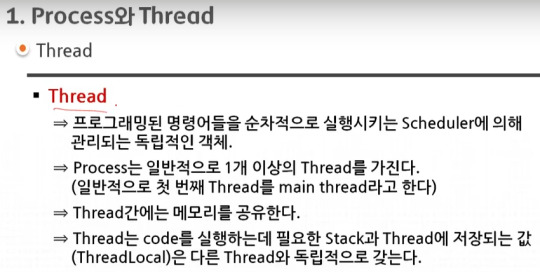
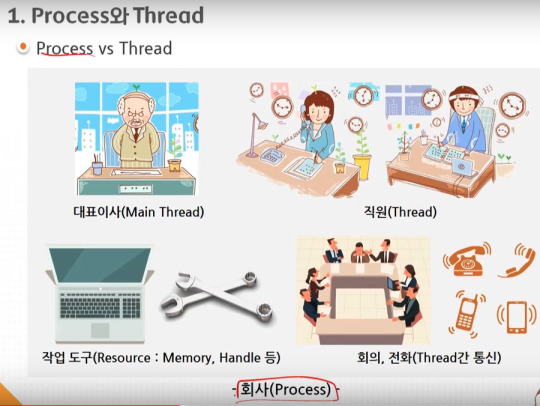
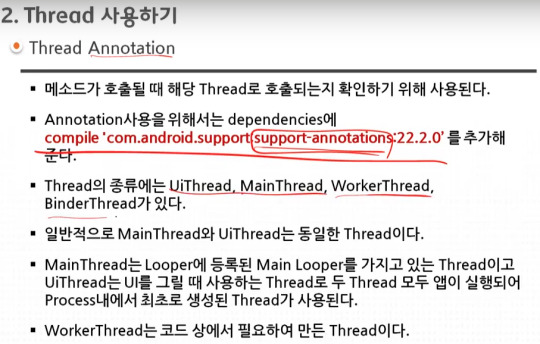
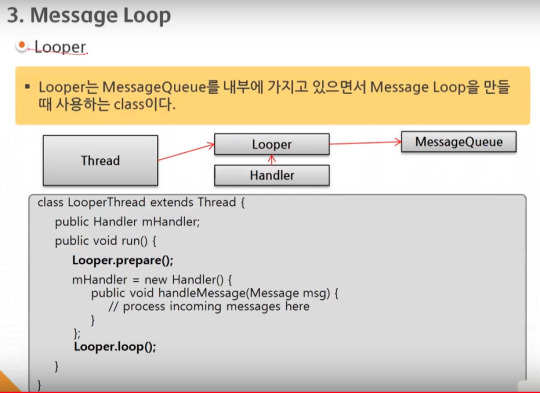
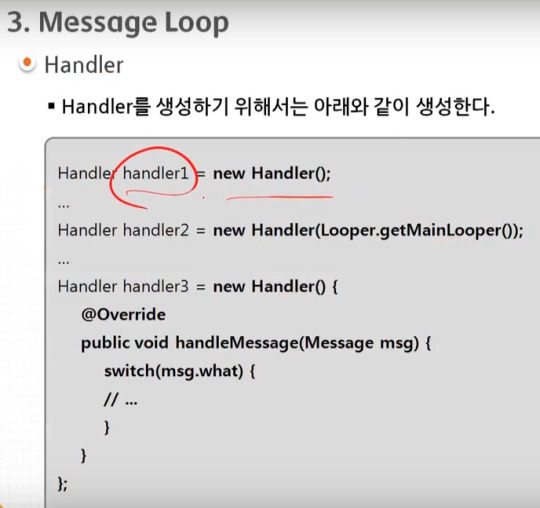
android 중급 1강 Thread(스레드)1 tacademy
original source : https://youtu.be/qt-l0MIdhTM
=========================================================
.
.
=========================================================
.
.

=========================================================
.
.

=========================================================
.
.


=========================================================
.
.


=========================================================
.
.

=========================================================
.
.

=========================================================
.
.

=========================================================
.
.
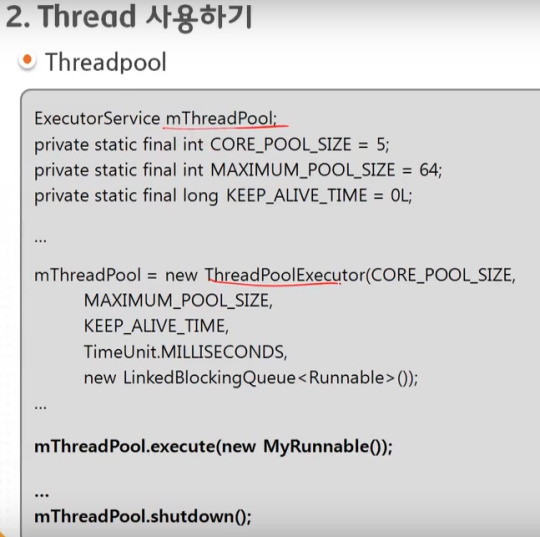
ThreadPoolExecutor를 이용해서 ThreadPool을 만든다.
=========================================================
.
.

=========================================================
.
.

=========================================================
.
.
=========================================================
.
.

=========================================================
.
.
=========================================================
.
.

=========================================================
.
.

0 notes
Text
Concurrent thread-local handoff in Java 17 in detail
Concurrent thread-local handoff is a new feature in Java 17 that allows multiple threads to efficiently transfer ownership of a thread-local variable to another thread. Thread-local variables are a convenient way to store per-thread state, but transferring ownership of these variables between threads can be challenging and often requires locking, which can result in poor performance. The…
View On WordPress
0 notes
Text
JDK 20: The new features in Java 20

For more than 25 years, Java has empowered developers to design and build the next generation of robust, scalable, and secure applications,” said Georges Saab, senior vice president of development, Java Platform and chair, OpenJDK Governing Board, Oracle. “The innovative new enhancements in Java 20 reflect the vision and invaluable efforts the global Java community has contributed throughout Java’s existence. With the support provided by Oracle’s ongoing Java technology leadership and community stewardship, Java has never been more relevant as a contemporary language and platform that helps developers improve productivity.”
Oracle on March 21, 2023, announced the availability of Java 20, the latest version of the world’s number one programming language and development platform. Java 20 (Oracle JDK 20) delivers thousands of performance, stability, and security improvements, including platform enhancements that will help developers improve productivity and drive innovation and growth across their organizations
New Features
These are the features that made into Java 20 release are incubator or preview features. These are features that still need to be completed and must be explicitly activated (with –enable-preview in the java and javac commands) in order to be able to test them.
Vector API (Fifth Incubator) – JEP 438
The Vector API was first proposed by JEP 338 in JDK 16, and then it was re-incubated in JDK17, JDK18, JDK19 and JDK20.
To explain how the Java Vector API abstraction works, we need to explore different CPU architectures and provide a basic understanding of data-parallel computation. In contrast to a regular computing operation, as in 1+1, where two “pieces of data” are added in one operation, a data-parallel operation is executing a simple operation (e.g., +) on multiple “pieces of data” at the same time. This mode of operation is called SIMD (Single Instruction, Multiple Data), whereas the traditional way of execution is called SISD (Single Instruction, Single Data). The performance speed-up results from applying the same operation on more than one “piece of data” within one CPU cycle. As a simple example: Instead of adding each element of an array A with each element of an array B, we take chunks of array A and array B and operate simultaneously. The two modes are illustrated below and should provide evidence of why SIMD should increase computational performance.

Here is simple example, we want to find hypotenuse value of a triangle:
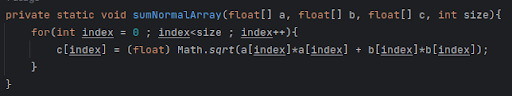
The same code converted into Vector API looks like this:
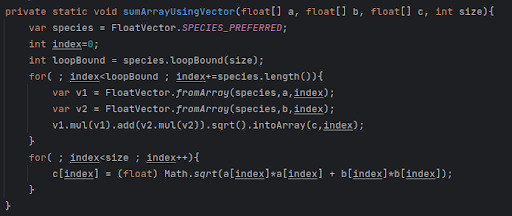
To explain this, we are dividing array into small parts and finding the hypotenuse of all values together. AVX compatible CPUs can handle 256 Bits while AVX-512 can provide 512 bits of data-width. One operation usually takes 32 Bits of data-width, so if we take 256 Bits of CPU and 32 Bits of data, we can perform same operation on 256/32=8 values of an array. But it changes CPU by CPU, here “FloatVector.SPECIES_PREFERRED” provides that value. Then we are dividing array into 8 parts, until we can. But last part of an array can be between 1-7 too, which cannot be grouped to 8, so we have to perform that part manually. There is another option mask, which checks that array size can be grouped or not and we can pass that mask value in “FloatVector.fromArray” and “FloatVector.IntoArray” method like below code, but it is less performant:

This feature is yet not added in latest IDEs, so you have to add vector APIs’ module using below command:
–add-modules=jdk.incubator.vector
Scoped Values (Incubator) – JEP 429
Scoped values allow a value (i.e., any object) to be stored for a limited time in such a way that only the thread that wrote the value can read it. If multiple threads use the same ScopedValue field, it may contain a different value from the point of view of each thread.
If you are familiar with ThreadLocal variables, this will sound familiar. In fact, scoped values are a modern alternative for thread locals. In ThreadLocal, it stores value in a map, with Thread being the key and value being the values, so values are stored until that thread dies or we remove it from map using .remove() method, otherwise the value will be stored in map forever, which can cause memory leak and new threads are being created with the current thread so all values from current thread will be duplicated, hence it can create memory footprint. ScopedValues solve this problem.
In ScopedValues, we can pass that object value in “ScopedValue.where(…)” and then we can pass runnable method in “.run()” like below:

Scoped values are usually created as public static fields like above example, so they can be retrieved from any method without us having to pass them as parameters to those methods.
MatchException for Exhausting Switch
An exhaustive switch (i.e., a switch that includes all possible values) throws a MatchException (rather than an IncompatibleClassChangeError) if it is determined at runtime that no switch label matches.
That can happen if we subsequently extend the code but only recompile the changed classes. The best way to show this is with an example:
Using the Position record from the “Record Patterns” chapter, we define a sealed interface Shape with the implementations Rectangle and Circle:

In addition, we write a ShapeDebugger that prints different debug information depending on the Shape implementation:

Summary:
Hence, to conclude Java20 offers mainly with “scoped values,” we get a very useful construct in Java 20 to provide a thread and possibly a group of child threads with a read-only, thread-specific value during their lifetime.
All other JEPs are minimally (or not at all) modified resubmissions of previous JEPs.
Java’s ability to boost performance, stability, and security continues to make it the world’s most popular programming language.
Read More JDK 20: The new features in Java 20
0 notes
Text
How to Use Java 19 Virtual Threads?

A preview feature of Java 19 includes Virtual Threads, a compact implementation of Java threads. High-throughput concurrent applications can be written, maintained, and observed with a great deal fewer work thanks to virtual threads. The well-known thread-per-request style of programming is given fresh life by virtual threads, enabling it to scale with almost ideal hardware use.
Virtual Threads can be supported by existing applications and libraries with no modification because they are fully compatible with the current "Thread" API. By supporting the current debugging and profiling interfaces, virtual threads make it simple to troubleshoot, debug, and profile virtual threads using current tools and methods.
The primary output of OpenJDK's Project Loom, virtual threads are introduced to the Java platform for the first time in Java 19; this is the key deliverable. This is simultaneously one of the biggest improvements to Java in a long time and a hardly noticeable change. Virtual Threads radically alter how the Java runtime communicates with the underlying operating system, removing major barriers to scalability, but they make only minor adjustments to how we create and manage concurrent systems. Virtual Threads behave almost identically to the threads we are used to, and there is hardly any additional API surface. There is more unlearning than learning to be done to use virtual threads successfully.
Virtual Threads
A different Java.lang.Thread implementation is virtual threads. Threads that use Java's garbage-collected heap to store their stack frames rather than the large operating system-allocated memory chunks. The memory footprint for a virtual thread starts at just a few hundred bytes and extends and contracts automatically as the call stack grows and shrinks, so we don't have to anticipate how much stack space a thread would need or make a general estimate for all threads.
Platform threads, which remain the unit of scheduling, are the only threads that the operating system is aware of. The Java runtime makes arrangements for code to execute on a virtual thread by mounting it on a platform thread known as a carrier thread. When a virtual thread is mounted, the necessary stack frames are temporarily copied from the heap to the carrier thread's stack, and the virtual thread borrows the carrier stack while it is mounted. Code running in a virtual thread can be unmounted from the carrier thread, and any updated stack frames copied are returned to the heap, enabling the carrier thread to work on anything else when it might otherwise block due to IO, locking, or other resource availability (such as running another virtual thread.) Virtual Threads are unmounted from their carriers rather than blocking when a blocking operation on them is encountered in almost all of the blocking places in the JDK.
There is not much to understand to use virtual threads because they are just threads and have minimal additional API surface of their own. But to use them successfully, there are quite a few things we need to relearn.
Everyone Out of the Pool.
Overuse of ThreadLocal
Everyone Out of the Pool
The patterns of thread production are the hardest to unlearn. Java developers have learned that it is generally far better to let ExecutorService manage and pool threads in a policy-driven way than to create threads directly. Java 5 introduced the java.util.concurrent package, which includes the ExecutorService framework. But pooling turns into an antipattern when dealing with virtual threads. (We don't have to stop using ExecutorService or the encapsulation of policy that it offers; we can acquire an ExecutorService that produces a new virtual thread per task by using the new factory function Executors::newVirtualThreadPerTaskExecutor )
Because they are so lightweight, virtual threads can be created even for brief operations, and attempting to reuse or recycle them is pointless. Virtual Threads were created specifically to handle brief tasks like an HTTP fetch or a JDBC query.
Overuse of ThreadLocal
As a result of virtual threads, libraries could also need to modify how they use ThreadLocal. The usage of ThreadLocal to cache resources that are expensive to allocate, not thread-safe, or just to prevent repeated allocation of a frequently used object is one of its occasional (and, some would argue, misuse) applications (e.g., ASM uses a ThreadLocal to maintain a per-thread char[] buffer, used for formatting operations.) This is an ad-hoc kind of pooling; if these objects need to be pooled, they should be pooled explicitly. A ThreadLocal is used to amortize the production cost of a costly resource across numerous activities that might execute in the same thread.
API & Platform Changes
A preview feature is virtual threads and the accompanying APIs. This means that to support virtual threads, the-enable-preview switch is required.
There is no new VirtualThread base type because virtual threads are just java.lang.Thread implementations. But there are several new API points for creating and analyzing threads that have been added to the Thread API. A new Thread.Builder class, new factory methods for Thread::ofVirtual and Thread::ofPlatform, and Thread::startVirtualThread to start a task on a virtual thread in one step are all included. Although they are only used to create platform threads, the old thread builders continue to function as before.
Virtual and platform threads behave differently in a few specific ways. Virtual threads are always daemon threads; they are unaffected by the Thread::setDaemon function. Virtual threads have primacy at all times. NORM PRIORITY, which is unchangeable. Some (defective) legacy techniques, such as ThreadGroup and the Thread methods halt, suspend, and delete, are not supported by virtual threads. A thread's virtuality can be determined using the function Thread::isVirtual.
Preparing the JDK
Although Project Loom's major output is virtual threads, the JDK has undergone several enhancements to guarantee that programs will use virtual threads effectively.
New socket implementations: To better support virtual threads, JEP 353 (Reimplement the Legacy Socket API) and JEP 373 (Reimplement the Legacy DatagramSocket API) replaced the versions of Socket, ServerSocket, and DatagramSocket (including making blocking methods interruptible in virtual threads.)
Virtual-thread-awareness: Virtual threads are now known to almost all blocking sites in the JDK, and they will unmount a virtual thread instead of stopping it.
Revisiting the use of ThreadLocal: Because of the anticipated shifting thread usage patterns, many ThreadLocal uses in the JDK were revised.
Revisiting locking: Critical intrinsic locks were replaced with ReentrantLock because acquiring an intrinsic lock (synchronised) currently pins a virtual thread to its carrier. (In the future, the relationship between virtual threads and intrinsic locks will likely be enhanced.)
Improved thread dumps: Greater control over thread dumps is offered to filter out virtual threads, group relevant virtual threads together, or create dumps in machine-readable forms that can be post-processed for improved observability.
Even while virtual threads are Project Loom's major focus, several Loom side projects improve on virtual threads. The first is a straightforward framework for organized concurrency, which provides a potent way to manage and coordinate collaborating teams of virtual threads. Extent local variables are another option; they are comparable to thread locals but are better suited (and more efficient) for use with virtual threads.
Thanks for reading! In this blog, we focus on how to use Java Virtual Threads and their Importance in Java Programming. If you are looking for Java development services we got your back, at Sanesquare Technologies we provide the best Java development services. Feel free to contact us to get a free consultation
0 notes
Text
マルチスレッドと仮想スレッド
現在エルヴァートマップは、 Javaで作成した常駐ツールで分割・アップロードしています。このツールは特定のフォルダを監視しており、Photoshopマクロ(jsx)でpngファイルが更新されると、読み込んで処理するのです。ツールの内容は以下のとおりです。
更新されたファイルを画像として読み込み、8640x3840をマルチスレッドで144x160のパーツに分割します。個々のタスクは既存のファイルをキャッシュから読み込み、画素に変更がないかどうか確認します。変更があればファイルを保存(とキャッシュ置き換え)し、アップロード用のタスクを生成します。タスクはすべてスレッドプールで実行します。
FTPアップロード中はCPUやネットワークの使用率が高くなります。PCの不安定さ(フリーズ、ネットワーク切断)の原因の一つはこれではないかと考え、今回、このスレッドプールをJava19で導入された仮想スレッドに変えてみました。
仮想スレッドは機能的にはスレッドプールと類似ですが、プラットフォームスレッド (以下スレッド) を直接扱わずにVM内でタスク管理し、適宜割り当てることでCPUのコンテキストスイッチを回避し、効率低下を抑止します。ブロッキングによるスレッド占有も解消されます。
変更の結果、 ピークではCPUやネットワークの使用率に変化はないようですが、山が急峻になり、全体的にややスムーズに動作するようになったと感じています。ただ、落とし穴がありました。初回から「socket closed」というメッセージが出て、その後も不定期に出ていました。正常動作しているし…と放っておいたのですが、今日、そのメッセージの後に「アップロード失敗」のメッセージが出たのです。
調査したところ、FTPクライアントにThreadLocalを使用しているのが原因でした。これまでスレッドとFTPクライアントのインスタンスは1:1でした。しかし仮想スレッドに変更したことにより、タスクの処理中に別のスレッドが割り当てられる可能性が生まれました。新たに割り当てられたスレッドに、既にクローズされたFTPクライアントが紐付いていたのです。正常動作していたのは、リトライによるものでした。今回リトライがことごとく失敗し、「アップロード失敗」になったということです。
仮想スレッドの解説には、「仮想スレッドを使うならThreadLocalを使うな」とありました。まさにそのままでした。
ひとまず、FTPクライアントをThreadLocalから取るのをやめ、タスクごとに毎回生成するようにしました。効率を考えればプールだろうと考えています。
0 notes
Text
In Java, if you want to create variables that have individual copies in threads, then you need to use ThreadLocal class.
With this, each thread will store a version of the variable and any changes will cause that instance of the value in the thread to be changed and nowhere else.
0 notes
Photo

🎉 kotlinx.coroutines 1.6.0 released! ▸ Reworked kotlinx-coroutines-test ▸ Multithreaded coroutines for Kotlin/Native ▸ API for limiting concurrency without creating additional threads ▸ Thread-safe write access to ThreadLocal ▸ Migration to Java 8 https://t.co/RjgYo28RQj
0 notes
Text
Spring mvc integration with prometheus Example
In this article ,we will see how we can monitor spring MVC applications using prometheus tool . You wont get much documentation for this setup on web. Prometheus is mostly configured with spring boot easily. But in order to configure it with spring MVC based application , it requires some additional configurations - Prometheus Prometheus is a time-series monitoring application written in Go. It can run on a server, in a docker container, or as part of a Kubernetes cluster (or something similar). Prometheus collects, stores, and visualizes time-series data so that you can monitor your systems. You can tell Prometheus exactly where to find metrics by configuring a list of "scrape jobs". Applications that are being monitored can provide metrics endpoints to Prometheus using any one of the many client libraries available; additionally, separate exporters can gather metrics from applications to make them available in Prometheus. Metrics get stored locally for 15 days, by default, and any Prometheus server can scrape another one for data. Additionally, remote storage is another option for Prometheus data - provided there is a reliable remote storage endpoint. Benefits: The option of "service discovery" allows Prometheus to keep track of all current endpoints effortlessly. Outages are quickly detected .The PromQL query language is incredibly flexible and Turing-complete. There's also a very low load on the services monitored (metrics get stored in memory as they get generated), allowing fewer resources to get used. Additionally, Prometheus users can control traffic volumes, access metrics in the browser, and allow for easy reconfiguration. Step 1 : Spring MVC application pom.xml configuration Below prometheus dependencies are required in pom.xml for project - 0.6.0 io.prometheus simpleclient ${prometheus.version} io.prometheus simpleclient_hotspot ${prometheus.version} io.prometheus simpleclient_servlet ${prometheus.version} io.prometheus simpleclient_pushgateway ${prometheus.version} io.prometheus simpleclient_spring_web ${prometheus.version} com.fasterxml.jackson.core jackson-core 2.5.2 Step 2 : Spring MVC application web.xml configuration We need configure MetricsServlet to capture the metrics of our spring mvc application as below - PrometheusServlet io.prometheus.client.exporter.MetricsServlet PrometheusServlet /metrics Step 3: Add an interceptor class This will intercept all the requests coming to application and capture the metrics to be exposed to prometheus - package com.myjavablog.config; import io.prometheus.client.Counter; import io.prometheus.client.Gauge; import io.prometheus.client.Histogram; import io.prometheus.client.Summary; import org.apache.log4j.Logger; import org.springframework.web.method.HandlerMethod; import org.springframework.web.servlet.ModelAndView; import org.springframework.web.servlet.handler.HandlerInterceptorAdapter; import javax.servlet.http.HttpServletRequest; import javax.servlet.http.HttpServletResponse; /** * @author anupb */ public class PrometheusMetricsInterceptor extends HandlerInterceptorAdapter { private static Logger logger = Logger.getLogger(PrometheusMetricsInterceptor.class); private static final Histogram requestLatency = Histogram.build() .name("service_requests_latency_seconds") .help("Request latency in seconds.") .labelNames("systemId", "appId", "type", "name", "method").register(); private ThreadLocal timerThreadLocal; @Override public boolean preHandle(HttpServletRequest request, HttpServletResponse response, Object handler) throws Exception { return super.preHandle(request, response, handler); } @Override public void postHandle(HttpServletRequest request, HttpServletResponse response, Object handler, ModelAndView modelAndView) throws Exception { String name = this.getName(request, handler).toLowerCase(); String method = request.getMethod().toUpperCase(); timerThreadLocal = new ThreadLocal(); timerThreadLocal.set(requestLatency.labels(name, method).startTimer()); super.postHandle(request, response, handler, modelAndView); } @Override public void afterCompletion(HttpServletRequest request, HttpServletResponse response, Object handler, Exception ex) throws Exception { super.afterCompletion(request, response, handler, ex); if (timerThreadLocal.get() != null) { timerThreadLocal.get().observeDuration(); } } @Override public void afterConcurrentHandlingStarted(HttpServletRequest request, HttpServletResponse response, Object handler) throws Exception { super.afterConcurrentHandlingStarted(request, response, handler); } private String getName(HttpServletRequest request, Object handler) { String name = ""; try { if (handler != null && handler instanceof HandlerMethod) { HandlerMethod method = (HandlerMethod) handler; String className = ((HandlerMethod) handler).getBeanType().getName(); name = className + "." + method.getMethod().getName(); } else { name = request.getRequestURI(); } } catch (Exception ex) { logger.error("getName", ex); } finally { return name; } } } Step 4: Add prometheus initialization configuration This will expose the metrics to prometheus server - package com.myjavablog.config; public class PrometheusConfig { private static Logger logger = Logger.getLogger(PrometheusConfig.class); @PostConstruct public void initialize() { logger.info("prometheus init..."); DefaultExports.initialize(); logger.info("prometheus has been initialized..."); } } Step 5: Add an interceptor to spring-mvc.xml You need to first add the schema location as below - http://www.springframework.org/schema/mvc http://www.springframework.org/schema/mvc/spring-mvc-3.0.xsd Then you need to add below tag - Step 6: Add configuration to applicationcontext.xml Once all this configuration is done , you can add the application URL in prometheus. These parameters are useful to monitor your spring MVC application. Read the full article
0 notes
Text
ThreadLocalクラスとは
ThreadLocalクラスは、スレッド毎にクラス変数を持つための方法。
0 notes