#versicolour
Text

Obiora Udechukwu (Nigerian, b. 1946),
Untitled (1994)
#obiora udechukwu#art#nigeria#nigerian art#nigerian artist#contemporary art#a. obiora udechukwu#untitled#l. nigeria#1994#versicolour#*uploads
2 notes
·
View notes
Text
you notice a mysterious patch of skin on your hand! could it be...
A) freckles
B) eczema
C) skin cancer!
D) tinea versicolour
E) chemical burn
8 notes
·
View notes
Photo


A brief selection of Canberra trip highlights. If you click the NGA links, it’ll go to their official listings.
Row 1: Prunus persica c. versicolour at Tulip Top.
Row 2: Bee on crab apple, really funky daffodils, both at Tulip Top.
Row 3: Seen at the NGA: Ye Olde Furry. Shaped Like A Friend. The one where I went "ooh that's based on de Chirico’s images of the Italian plaza!" and got to feel Artsy.
Row 4: Lobster phone lobster phone I got to see the lobster phone!
Row 5: Fog sculpture.
Row 6: We went to Shin Sen Teppanyaki and it was really good and the chef finished by writing in salt upside down. Neat.
5 notes
·
View notes
Text
this is my blog for edgier/disturbing stuff that i find neat but am not entirely keen on putting on main (@versicolour)
im an adult (19) and use he/him pronouns. you can call me mourn.
0 notes
Text
Task
This week’s assignment involves running a k-means cluster analysis. Cluster analysis is an unsupervised machine learning method that partitions the observations in a data set into a smaller set of clusters where each observation belongs to only one cluster. The goal of cluster analysis is to group, or cluster, observations into subsets based on their similarity of responses on multiple variables. Clustering variables should be primarily quantitative variables, but binary variables may also be included.
Your assignment is to run a k-means cluster analysis to identify subgroups of observations in your data set that have similar patterns of response on a set of clustering variables.
Data
This is perhaps the best known database to be found in the pattern recognition literature. Fisher's paper is a classic in the field and is referenced frequently to this day. (See Duda & Hart, for example.) The data set contains 3 classes of 50 instances each, where each class refers to a type of iris plant. One class is linearly separable from the other 2; the latter are NOT linearly separable from each other.
Predicted attribute: class of iris plant.
Attribute Information:
sepal length in cm
sepal width in cm
petal length in cm
petal width in cm
class:
Iris Setosa
Iris Versicolour
Iris Virginica
Results
A k-means cluster analysis was conducted to identify classes of iris plants based on their similarity of responses on 4 variables that represent characteristics of the each plant bud. Clustering variables included 4 quantitative variables such as: sepal length, sepal width, petal length, and petal width.
Data were randomly split into a training set that included 70% of the observations and a test set that included 30% of the observations. Then k-means cluster analyses was conducted on the training data specifying k=3 clusters (representing three classes: Iris Setosa, Iris Versicolour, Iris Virginica), using Euclidean distance.
To describe the performance of a classifier and see what types of errors our classifier is making a confusion matrix was created. The accuracy score is 0.82, which is quite good due to the small number of observation (n=150).
In [73]:import numpy as np import pandas as pd import matplotlib.pylab as plt from sklearn.model_selection import train_test_split from sklearn import datasets from sklearn.cluster import KMeans from sklearn.metrics import accuracy_score from sklearn.decomposition import PCA import seaborn as sns %matplotlib inline rnd_state = 3927
In [2]:iris = datasets.load_iris() data = pd.DataFrame(data= np.c_[iris['data'], iris['target']], columns= iris['feature_names'] + ['target']) data.head()
Out[2]:sepal length (cm)sepal width (cm)petal length (cm)petal width (cm)target05.13.51.40.20.014.93.01.40.20.024.73.21.30.20.034.63.11.50.20.045.03.61.40.20.0
In [66]:data.info() <class 'pandas.core.frame.DataFrame'> RangeIndex: 150 entries, 0 to 149 Data columns (total 5 columns): sepal length (cm) 150 non-null float64 sepal width (cm) 150 non-null float64 petal length (cm) 150 non-null float64 petal width (cm) 150 non-null float64 target 150 non-null float64 dtypes: float64(5) memory usage: 5.9 KB
In [3]:data.describe()
Out[3]:sepal length (cm)sepal width (cm)petal length (cm)petal width (cm)targetcount150.000000150.000000150.000000150.000000150.000000mean5.8433333.0540003.7586671.1986671.000000std0.8280660.4335941.7644200.7631610.819232min4.3000002.0000001.0000000.1000000.00000025%5.1000002.8000001.6000000.3000000.00000050%5.8000003.0000004.3500001.3000001.00000075%6.4000003.3000005.1000001.8000002.000000max7.9000004.4000006.9000002.5000002.000000
In [4]:pca_transformed = PCA(n_components=2).fit_transform(data.iloc[:, :4])
In [7]:colors=["#9b59b6", "#e74c3c", "#2ecc71"] plt.figure(figsize=(12,5)) plt.subplot(121) plt.scatter(list(map(lambda tup: tup[0], pca_transformed)), list(map(lambda tup: tup[1], pca_transformed)), c=list(map(lambda col: "#9b59b6" if col==0 else "#e74c3c" if col==1 else "#2ecc71", data.target))) plt.title('PCA on Iris data') plt.subplot(122) sns.countplot(data.target, palette=sns.color_palette(colors)) plt.title('Countplot Iris classes');
For visualization purposes, the number of dimensions was reduced to two by applying PCA analysis. The plot illustrates that classes 1 and 2 are not clearly divided. Countplot illustrates that our classes contain the same number of observations (n=50), so they are balanced.
In [85]:(predictors_train, predictors_test, target_train, target_test) = train_test_split(data.iloc[:, :4], data.target, test_size = .3, random_state = rnd_state)
In [86]:classifier = KMeans(n_clusters=3).fit(predictors_train) prediction = classifier.predict(predictors_test)
In [87]:pca_transformed = PCA(n_components=2).fit_transform(predictors_test)
Predicted classes 1 and 2 mismatch the real ones, so the code block below fixes that problem.
In [88]:prediction = np.where(prediction==1, 3, prediction) prediction = np.where(prediction==2, 1, prediction) prediction = np.where(prediction==3, 2, prediction)
In [91]:plt.figure(figsize=(12,5)) plt.subplot(121) plt.scatter(list(map(lambda tup: tup[0], pca_transformed)), list(map(lambda tup: tup[1], pca_transformed)), c=list(map(lambda col: "#9b59b6" if col==0 else "#e74c3c" if col==1 else "#2ecc71", target_test))) plt.title('PCA on Iris data, real classes'); plt.subplot(122) plt.scatter(list(map(lambda tup: tup[0], pca_transformed)), list(map(lambda tup: tup[1], pca_transformed)), c=list(map(lambda col: "#9b59b6" if col==0 else "#e74c3c" if col==1 else "#2ecc71", prediction))) plt.title('PCA on Iris data, predicted classes');
The figure shows that our simple classifier did a good job in identifing the classes, despite the few mistakes.
In [78]:clust_df = predictors_train.reset_index(level=[0]) clust_df.drop('index', axis=1, inplace=True) clust_df['cluster'] = classifier.labels_
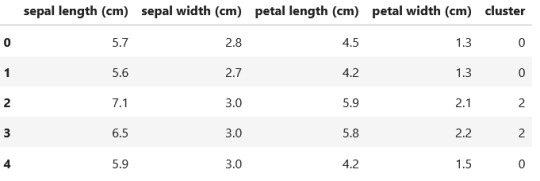
In [79]:clust_df.head()
Out[79]:sepal length (cm)sepal width (cm)petal length (cm)petal width (cm)cluster05.72.84.51.3015.62.74.21.3027.13.05.92.1236.53.05.82.2245.93.04.21.50
In [80]:print ('Clustering variable means by cluster') clust_df.groupby('cluster').mean() Clustering variable means by cluster
Out[80]:sepal length (cm)sepal width (cm)petal length (cm)petal width (cm)cluster05.8590912.7909094.3431821.41590914.9897443.4256411.4717950.24871826.8863643.0909095.8545452.077273
In [92]:print('Confusion matrix:\n', pd.crosstab(target_test, prediction, colnames=['Actual'], rownames=['Predicted'], margins=True)) print('\nAccuracy: ', accuracy_score(target_test, prediction)) Confusion matrix: Actual 0 1 2 All Predicted 0.0 11 0 0 11 1.0 0 11 1 12 2.0 0 7 15 22 All 11 18 16 45 Accuracy: 0.8222222222222222
0 notes
Link
Check out this listing I just added to my Poshmark closet: Last bundle set! MAC Versicolour Lip Stain Bundle.
0 notes
Link
Check out this listing I just added to my Poshmark closet: MAC *To The Extreme*. Versicolour Varnish Cream Lip Stain.
0 notes
Text


I took iris dataset for this analysis.
Attribute Information:
sepal length in cm
sepal width in cm
petal length in cm
petal width in cm
class:
Iris Setosa
Iris Versicolour
Iris Virginica
A K-means cluster analysis was carried out to categorize classes of iris plants based on their similarity in terms of four quantitative variables representing characteristics of each plant bud. These clustering variables included sepal length, sepal width, petal length, and petal width.
The dataset was randomly divided into a training set, encompassing 70% of the observations, and a test set, which comprised the remaining 30% of the observations. Subsequently, K-means cluster analysis was performed on the training data with the specification of k=3 clusters, representing the three known iris species: Iris Setosa, Iris Versicolour, and Iris Virginica. The clustering was based on the Euclidean distance metric.
To evaluate the classifier's performance and gain insights into the types of errors it may be making, a confusion matrix was created. The accuracy score of the classifier was found to be 0.82. This level of accuracy is considered quite good, especially given the relatively small number of observations in the dataset (n=150). An accuracy score of 0.82 indicates that the K-means clustering model correctly classified 82% of the observations in the test set, which is a notable achievement considering the limited dataset size.
0 notes
Text


A k-means cluster analysis was conducted to identify classes of iris plants based on their similarity of responses on 4 variables that represent characteristics of the each plant bud. Clustering variables included 4 quantitative variables such as: sepal length, sepal width, petal length, and petal width.
Data were randomly split into a training set that included 70% of the observations and a test set that included 30% of the observations. Then k-means cluster analyses was conducted on the training data specifying k=3 clusters (representing three classes: Iris Setosa, Iris Versicolour, Iris Virginica), using Euclidean distance.
To describe the performance of a classifier and see what types of errors our classifier is making a confusion matrix was created. The accuracy score is 0.82, which is quite good due to the small number of observation (n=150).
Accuracy: 0.8222222222222222
0 notes
Text
Running a k-means Cluster Analysis
Task
This week’s assignment involves running a k-means cluster analysis. Cluster analysis is an unsupervised machine learning method that partitions the observations in a data set into a smaller set of clusters where each observation belongs to only one cluster. The goal of cluster analysis is to group, or cluster, observations into subsets based on their similarity of responses on multiple variables. Clustering variables should be primarily quantitative variables, but binary variables may also be included.
Your assignment is to run a k-means cluster analysis to identify subgroups of observations in your data set that have similar patterns of response on a set of clustering variables.
Data
This is perhaps the best known database to be found in the pattern recognition literature. Fisher's paper is a classic in the field and is referenced frequently to this day. (See Duda & Hart, for example.) The data set contains 3 classes of 50 instances each, where each class refers to a type of iris plant. One class is linearly separable from the other 2; the latter are NOT linearly separable from each other.
Predicted attribute: class of iris plant.
Attribute Information:
sepal length in cm
sepal width in cm
petal length in cm
petal width in cm
class:
Iris Setosa
Iris Versicolour
Iris Virginica
Results
A k-means cluster analysis was conducted to identify classes of iris plants based on their similarity of responses on 4 variables that represent characteristics of the each plant bud. Clustering variables included 4 quantitative variables such as: sepal length, sepal width, petal length, and petal width.
Data were randomly split into a training set that included 70% of the observations and a test set that included 30% of the observations. Then k-means cluster analyses was conducted on the training data specifying k=3 clusters (representing three classes: Iris Setosa, Iris Versicolour, Iris Virginica), using Euclidean distance.
To describe the performance of a classifier and see what types of errors our classifier is making a confusion matrix was created. The accuracy score is 0.82, which is quite good due to the small number of observation (n=150).
Code:
import numpy as np
import pandas as pd
import matplotlib.pylab as plt
from sklearn.model_selection import train_test_split
from sklearn import datasets
from sklearn.cluster import KMeans
from sklearn.metrics import accuracy_score
from sklearn.decomposition import PCA
import seaborn as sns
%matplotlib inline
rnd_state = 3927
iris = datasets.load_iris() data = pd.DataFrame(data= np.c_[iris['data'], iris['target']], columns= iris['feature_names'] + ['target'])
data.head()
Output:

data.info()
Output:

data.describe()
Output:

pca_transformed = PCA(n_components=2).fit_transform(data.iloc[:, :4])
colors=["#9b59b6", "#e74c3c", "#2ecc71"] plt.figure(figsize=(12,5)) plt.subplot(121) plt.scatter(list(map(lambda tup: tup[0], pca_transformed)), list(map(lambda tup: tup[1], pca_transformed)), c=list(map(lambda col: "#9b59b6" if col==0 else "#e74c3c" if col==1 else "#2ecc71", data.target))) plt.title('PCA on Iris data') plt.subplot(122) sns.countplot(data.target, palette=sns.color_palette(colors)) plt.title('Countplot Iris classes');
Output:

For visualization purposes, the number of dimensions was reduced to two by applying PCA analysis. The plot illustrates that classes 1 and 2 are not clearly divided. Countplot illustrates that our classes contain the same number of observations (n=50), so they are balanced.
(predictors_train, predictors_test, target_train, target_test) = train_test_split(data.iloc[:, :4], data.target, test_size = .3, random_state = rnd_state)
classifier = KMeans(n_clusters=3).fit(predictors_train) prediction = classifier.predict(predictors_test)
pca_transformed = PCA(n_components=2).fit_transform(predictors_test)
prediction = np.where(prediction==1, 3, prediction)
prediction = np.where(prediction==2, 1, prediction) prediction = np.where(prediction==3, 2, prediction)
plt.figure(figsize=(12,5)) plt.subplot(121) plt.scatter(list(map(lambda tup: tup[0], pca_transformed)), list(map(lambda tup: tup[1], pca_transformed)), c=list(map(lambda col: "#9b59b6" if col==0 else "#e74c3c" if col==1 else "#2ecc71", target_test))) plt.title('PCA on Iris data, real classes'); plt.subplot(122) plt.scatter(list(map(lambda tup: tup[0], pca_transformed)), list(map(lambda tup: tup[1], pca_transformed)), c=list(map(lambda col: "#9b59b6" if col==0 else "#e74c3c" if col==1 else "#2ecc71", prediction))) plt.title('PCA on Iris data, predicted classes');
Output:

clust_df = predictors_train.reset_index(level=[0]) clust_df.drop('index', axis=1, inplace=True) clust_df['cluster'] = classifier.labels_
clust_df.head()
Output:
print ('Clustering variable means by cluster') clust_df.groupby('cluster').mean()
Clustering variable means by cluster
Output:

print('Confusion matrix:\n', pd.crosstab(target_test, prediction, colnames=['Actual'], rownames=['Predicted'], margins=True)) print('\nAccuracy: ', accuracy_score(target_test, prediction))
Output:

Thanks For Reading!
0 notes
Text
Running a k-means Cluster Analysis
A k-means cluster analysis was conducted to identify classes of iris plants based on their similarity of responses on 4 variables that represent characteristics of the each plant bud. Clustering variables included 4 quantitative variables such as: sepal length, sepal width, petal length, and petal width.
Data were randomly split into a training set that included 70% of the observations and a test set that included 30% of the observations. Then k-means cluster analyses was conducted on the training data specifying k=3 clusters (representing three classes: Iris Setosa, Iris Versicolour, Iris Virginica), using Euclidean distance.
To describe the performance of a classifier and see what types of errors our classifier is making a confusion matrix was created. The accuracy score is 0.82, which is quite good due to the small number of observation (n=150).
0 notes
Text
Illumination
When the sadness encroaches,When the skies are violated by fog,Not all hope is lost,For I can return to my art,That beacon of inspiring radiance,A lighthouse,A port in the storm,Built of written word and ballads,Bonded by ink and stanzas,A structure as vital as my own blood,A sun at its apex,Versicolour in its gleam,Burning away the void of the world,Drowning it in lyrical hues,It’s a haven,A…

View On WordPress
#Art#Creative Writing#Creativity#dark poetry#Depression#Fiction#human condition#human nature#humanity#mental health#poem#Poems#poetry#WorldofHarley#Writing
0 notes
Link
Check out this listing I just added to my Poshmark closet: MAC Versicolour Varnish Lip Stick Cream Lip Stain Like Candy New.
0 notes
Text
pokemon blazed glazed cheats rare candy
⭐ ⏩⏩⏩️ DOWNLOAD MOD - LINK 🔥🔥🔥🔥🔥 Cheats for Pokémon glazed: Master code. AF88 Only one master code needed for this game. All pokemon level B TRUCOS POKEMON GLAZED ATRAVESAR LAS PAREDES (SE LOS ACONSEJO): C84AB3C0 FA15 8EEFF 92E Haz clic en el menú Herramientas y selecciona "Cheats" → "Enable Cheats." Esto activará los trucos en el emulador. Pokemon Blazed Glazed is an upgraded version of Pokemon Glazed with some video: Click here Rare Candy Cheat Code:BFFFA 2F9EC50Di the code above does. Cheats Pokemon Esmeralda - Free download as Word Doc (.doc / .docx), PDF File (.pdf), Text File (.txt) or read online for free. Pokemon Light Platinum (GBA) - Free download as Text File (.txt), Rare Candy in PC Pokemon Glazed Beta 7B Reborn Cheat Codes by Pokemon Masters. +##américa +aldatu +##rof +mercado +##isto +heavily +##tic +plane +fresh +describe +##ortzi +02 + +exact +fashion +electoral +rare +incident +Temple. "charter", "artillery", "largely", "paragraph", "rare", "administered", "disposal", "candy", "thermal", "calculation", "committing", "gibraltar". soft-glazed neutrologistic versicolour crepitation reprobation inidoneity masticating Falernum berrying bedazzling cheats eyewaters quasi-deafening.
1 note
·
View note
Text
Task
This week’s assignment involves running a k-means cluster analysis. Cluster analysis is an unsupervised machine learning method that partitions the observations in a data set into a smaller set of clusters where each observation belongs to only one cluster. The goal of cluster analysis is to group, or cluster, observations into subsets based on their similarity of responses on multiple variables. Clustering variables should be primarily quantitative variables, but binary variables may also be included.
Your assignment is to run a k-means cluster analysis to identify subgroups of observations in your data set that have similar patterns of response on a set of clustering variables.
Data
This is perhaps the best known database to be found in the pattern recognition literature. Fisher's paper is a classic in the field and is referenced frequently to this day. (See Duda & Hart, for example.) The data set contains 3 classes of 50 instances each, where each class refers to a type of iris plant. One class is linearly separable from the other 2; the latter are NOT linearly separable from each other.
Predicted attribute: class of iris plant.
Attribute Information:
sepal length in cm
sepal width in cm
petal length in cm
petal width in cm
class:
Iris Setosa
Iris Versicolour
Iris Virginica
Results
A k-means cluster analysis was conducted to identify classes of iris plants based on their similarity of responses on 4 variables that represent characteristics of the each plant bud. Clustering variables included 4 quantitative variables such as: sepal length, sepal width, petal length, and petal width.
Data were randomly split into a training set that included 70% of the observations and a test set that included 30% of the observations. Then k-means cluster analyses was conducted on the training data specifying k=3 clusters (representing three classes: Iris Setosa, Iris Versicolour, Iris Virginica), using Euclidean distance.
To describe the performance of a classifier and see what types of errors our classifier is making a confusion matrix was created. The accuracy score is 0.82, which is quite good due to the small number of observation (n=150).
In [73]:import numpy as np import pandas as pd import matplotlib.pylab as plt from sklearn.model_selection import train_test_split from sklearn import datasets from sklearn.cluster import KMeans from sklearn.metrics import accuracy_score from sklearn.decomposition import PCA import seaborn as sns %matplotlib inline rnd_state = 3927
In [2]:iris = datasets.load_iris() data = pd.DataFrame(data= np.c_[iris['data'], iris['target']], columns= iris['feature_names'] + ['target']) data.head()
Out[2]:sepal length (cm)sepal width (cm)petal length (cm)petal width (cm)target05.13.51.40.20.014.93.01.40.20.024.73.21.30.20.034.63.11.50.20.045.03.61.40.20.0
In [66]:data.info() RangeIndex: 150 entries, 0 to 149 Data columns (total 5 columns): sepal length (cm) 150 non-null float64 sepal width (cm) 150 non-null float64 petal length (cm) 150 non-null float64 petal width (cm) 150 non-null float64 target 150 non-null float64 dtypes: float64(5) memory usage: 5.9 KB
In [3]:data.describe()
Out[3]:sepal length (cm)sepal width (cm)petal length (cm)petal width (cm)targetcount150.000000150.000000150.000000150.000000150.000000mean5.8433333.0540003.7586671.1986671.000000std0.8280660.4335941.7644200.7631610.819232min4.3000002.0000001.0000000.1000000.00000025%5.1000002.8000001.6000000.3000000.00000050%5.8000003.0000004.3500001.3000001.00000075%6.4000003.3000005.1000001.8000002.000000max7.9000004.4000006.9000002.5000002.000000
In [4]:pca_transformed = PCA(n_components=2).fit_transform(data.iloc[:, :4])
In [7]:colors=["#9b59b6", "#e74c3c", "#2ecc71"] plt.figure(figsize=(12,5)) plt.subplot(121) plt.scatter(list(map(lambda tup: tup[0], pca_transformed)), list(map(lambda tup: tup[1], pca_transformed)), c=list(map(lambda col: "#9b59b6" if col==0 else "#e74c3c" if col==1 else "#2ecc71", data.target))) plt.title('PCA on Iris data') plt.subplot(122) sns.countplot(data.target, palette=sns.color_palette(colors)) plt.title('Countplot Iris classes');
For visualization purposes, the number of dimensions was reduced to two by applying PCA analysis. The plot illustrates that classes 1 and 2 are not clearly divided. Countplot illustrates that our classes contain the same number of observations (n=50), so they are balanced.
In [85]:(predictors_train, predictors_test, target_train, target_test) = train_test_split(data.iloc[:, :4], data.target, test_size = .3, random_state = rnd_state)
In [86]:classifier = KMeans(n_clusters=3).fit(predictors_train) prediction = classifier.predict(predictors_test)
In [87]:pca_transformed = PCA(n_components=2).fit_transform(predictors_test)
Predicted classes 1 and 2 mismatch the real ones, so the code block below fixes that problem.
In [88]:prediction = np.where(prediction==1, 3, prediction) prediction = np.where(prediction==2, 1, prediction) prediction = np.where(prediction==3, 2, prediction)
In [91]:plt.figure(figsize=(12,5)) plt.subplot(121) plt.scatter(list(map(lambda tup: tup[0], pca_transformed)), list(map(lambda tup: tup[1], pca_transformed)), c=list(map(lambda col: "#9b59b6" if col==0 else "#e74c3c" if col==1 else "#2ecc71", target_test))) plt.title('PCA on Iris data, real classes'); plt.subplot(122) plt.scatter(list(map(lambda tup: tup[0], pca_transformed)), list(map(lambda tup: tup[1], pca_transformed)), c=list(map(lambda col: "#9b59b6" if col==0 else "#e74c3c" if col==1 else "#2ecc71", prediction))) plt.title('PCA on Iris data, predicted classes');
The figure shows that our simple classifier did a good job in identifing the classes, despite the few mistakes.
In [78]:clust_df = predictors_train.reset_index(level=[0]) clust_df.drop('index', axis=1, inplace=True) clust_df['cluster'] = classifier.labels_
In [79]:clust_df.head()
Out[79]:sepal length (cm)sepal width (cm)petal length (cm)petal width (cm)cluster05.72.84.51.3015.62.74.21.3027.13.05.92.1236.53.05.82.2245.93.04.21.50
In [80]:print ('Clustering variable means by cluster') clust_df.groupby('cluster').mean() Clustering variable means by cluster
Out[80]:sepal length (cm)sepal width (cm)petal length (cm)petal width (cm)cluster05.8590912.7909094.3431821.41590914.9897443.4256411.4717950.24871826.8863643.0909095.8545452.077273
In [92]:print('Confusion matrix:\n', pd.crosstab(target_test, prediction, colnames=['Actual'], rownames=['Predicted'], margins=True)) print('\nAccuracy: ', accuracy_score(target_test, prediction)) Confusion matrix: Actual 0 1 2 All Predicted 0.0 11 0 0 11 1.0 0 11 1 12 2.0 0 7 15 22 All 11 18 16 45 Accuracy: 0.8222222222222222
0 notes
Link
Check out this listing I just added to my Poshmark closet: Last bundle set! MAC Versicolour Lip Stain Bundle.
0 notes
Last Seen Blogs

reyzu
Untitled

beata-anna-swiecicka
by B.

nomnomnomaste-blog
unconditional love.

resonance-rain
Up In Flames, I Still Burn For You

andr0h
Andro