#visualisationdata
Photo


DATA VISULAISATION "MINI PROJECT"
Express Me
Creating an conversational starter, to help bring the city’s mental health and body awareness campany to the streets. Encouraging medial aid support for the city of Melbourne, through the use of visualising their emotional, through a beautiful colour language.
Allowing for the city of Melbourne to be in control, of their own mental health, bring a personal or social connection of your heart rate. By a visual expression of your emotional status. Simply by wearing a bracelet or watch, similar to a Fitbit.
1 note
·
View note
Video
vimeo
HeatLIFE Biofeedback System This video shows the biofeedback visual display. Showcasing through colour, pattern and sound of the stages emotional reactions linked with ones heartbeat. Showing the journey of ones heart, illustrating a story to help communicate, a situation or problem wanting to be spoken about. Aiding an experience to connect people with the right people to positively aid and support, during a personal experience.
0 notes
Photo
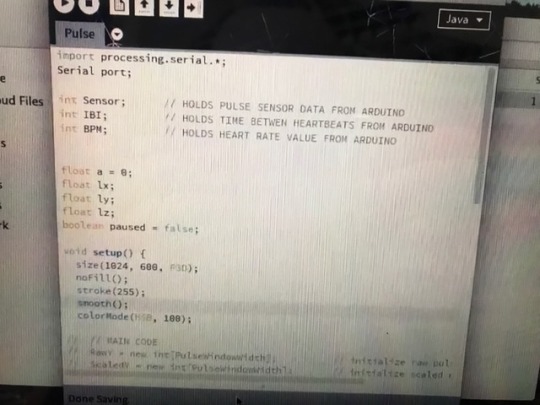

Processing Biofeedback The next stage was exploring new processing codes to display the biofeedback in different formats. Understanding that not all feedback systems visually would work, this was trial and error stage. Trying to keep the main focus of showing the biofeedback in a way that would allow for the user to change and enhance an experience, using it as a personal toolkit for human physiology. This stage was really enjoyable, learning a new program and seeing the language of the code reflect upon the visualisation of the biofeedback, was a successful design moment.
0 notes
Photo
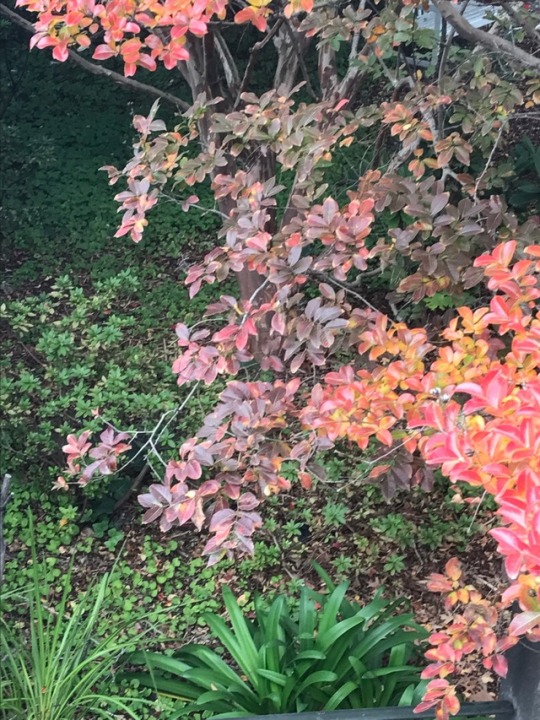

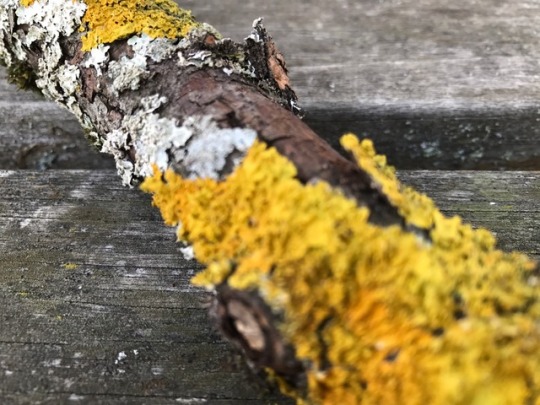
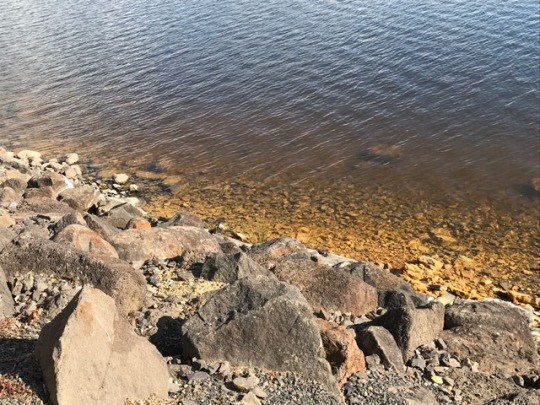
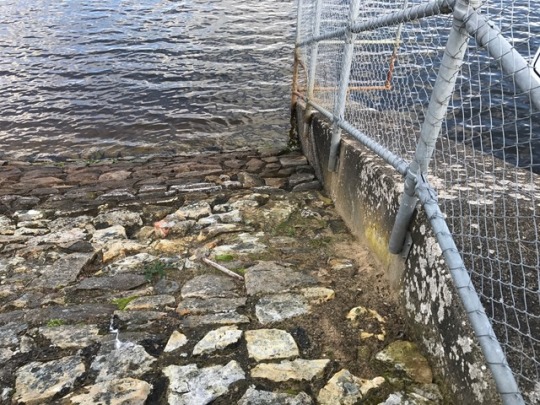

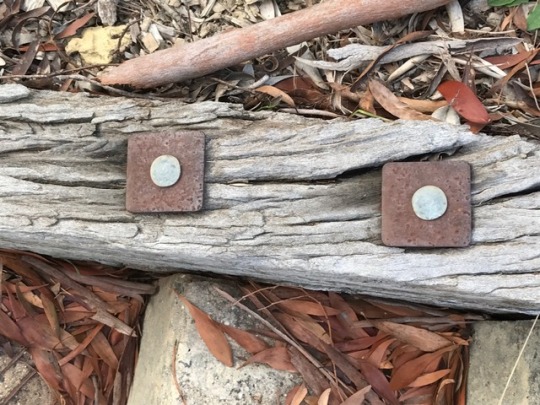
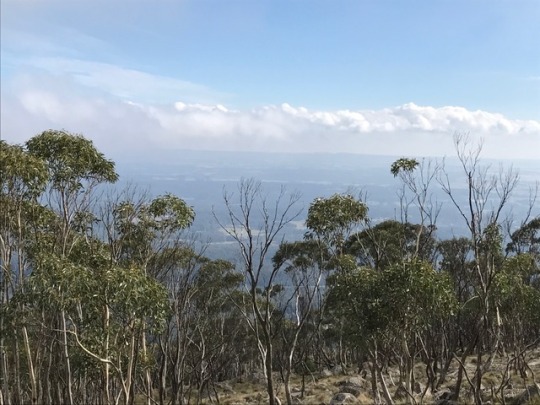
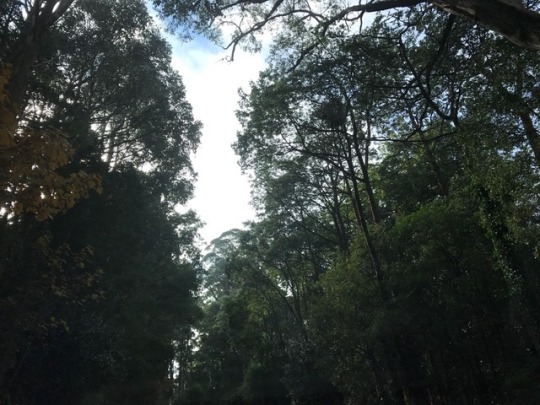
The Colour of the Country
Seeing the contrast in sensors in the country highlights the tone and texture of colour and patterns in the environment. Seeing how the humans sensors of sight, sound and smell have a significant relaxing tone to ones heartbeat.
Creating a new sensory system to help relaxation and be able to change a person’s emotion from a change in environment. Showing the rich colour compared to the city can significantly improve an experience, been taken away beauty of nature.
0 notes
Video
undefined
tumblr
Colour Data Visualisation Trialling different lights to see the reactions off heart rate change. Seeing the data similar to George Khut's style of allowing the person to become within one's self to be able to read their true body's messages. Magically using a child's night light to explore methods of relaxation, but the beautiful visualisation of the colours and story it tells through light.
0 notes
Photo


Matthias Müller's Magical Movies Müller showcase such talent in highlighting meaningful data, through short videos. Expressing the key to inspiration for new processing visualisation of data to be illustrated as a story, not simply as facts. The key to visualisation of data is having the correct context and expressing the purpose of the meaning from the data. Research: https://m.facebook.com/theacidmathspiral/posts/1212871015488966
0 notes
Photo


Behind Your Eyes, Between your Ears George Khut creating a fascination and passion within body focus contemporary interaction of brainwave patterns with James P. Brown, to focus upon the alpha brainwave rhythms. Exploring the reactions of closing your eyes and quietening your mind. Providing a dynamic attention between the mindset and environment, the theory of thinking and being. The participates wore a wireless brainwave sensor, providing a 70's aura sci fi photography and 19th century spiritual imagery for the data. Visualising the alpha wave activity and the movement from the face, using a camera to highlight connections. The video and portraits from the sittings created platforms for reflection and a relationship between biomedical imagery technology and embodiment t of physical practice and contemporary human cultural behaviour. Research and Inspiration http://www.georgekhut.com/portfolio/behind-your-eyes-between-your-ears-liveworks/
0 notes
Last Seen Blogs

peppermintstranger
Pepper

aereizana
Farz

dokidobe
yellow.dr.monv

castiels-destiny
Mental Health and Fishing

siciliaetnamare-blog
B&B Sicilia Etna Mare