#disk I/O monitoring tool
Explore tagged Tumblr posts
Visit Tumblr Blog
Explore Tumblr blogs with no restrictions, modern design and the best experience.
Last Seen Tumblr Blogs


Fun Fact
Mobile US users spent an average of 115.8 minutes on Tumblr app monthly.
Text
Introducing Spike Sleuth, a real-time Linux disk I/O monitoring tool designed to help you identify and analyze unexpected disk activity spikes. Born from the need to pinpoint elusive IOPS alerts, Spike Sleuth offers a lightweight solution that logs processes, users, and files responsible for high disk usage without adding overhead. Whether you're a developer, system administrator, or solutions architect, this tool provides the insights needed to maintain optimal system performance. Discover how Spike Sleuth can enhance your system monitoring and help you stay ahead of performance issues. #Linux #Monitoring #OpenSource #SystemAdmin #DevOps
#devops monitoring#disk I/O monitoring tool#iops monitoring#linux bash script#linux disk monitoring#linux performance#linux sysadmin tools#real-time monitoring linux#systemd service#troubleshoot disk spikes
0 notes
Text
How Do I Find Out Linux CPU Utilization and Usage?
How do I find out Linux Disk utilization and I/O usage?
How to check memory utilization and usage in Linux
30 Linux System Monitoring Tools Every SysAdmin Should Know
33 notes
·
View notes
Text

SYSTEM ADMIN INTERVIEW QUESTIONS 24-25
Table of Content
Introduction
File Permissions
User and Group Management:
Cron Jobs
System Performance Monitoring
Package Management (Red Hat)
Conclusion
Introduction
The IT field is vast, and Linux is an important player, especially in cloud computing. This blog is written under the guidance of industry experts to help all tech and non-tech background individuals secure interviews for roles in the IT domain related to Red Hat Linux.
File Permissions
Briefly explain how Linux file permissions work, and how you would change the permissions of a file using chmod. In Linux, each file and directory has three types of permissions: read (r), write (w), and execute (x) for three categories of users: owner, group, and others. Example: You will use chmod 744 filename, where the digits represent the permission in octal (7 = rwx, 4 = r–, etc.) to give full permission to the owner and read-only permission to groups and others.
What is the purpose of the umask command? How is it helpful to control default file permissions?umask sets the default permissions for newly created files and directories by subtracting from the full permissions (777 for directories and 666 for files). Example: If you set the umask to 022, new files will have permissions of 644 (rw-r–r–), and directories will have 755 (rwxr-xr-x).
User and Group Management:
Name the command that adds a new user in Linux and the command responsible for adding a user to a group. The Linux useradd command creates a new user, while the usermod command adds a user to a specific group. Example: Create a user called Jenny by sudo useradd jenny and add him to the developer’s group by sudo usermod—aG developers jenny, where the—aG option adds users to more groups without removing them from other groups.
How do you view the groups that a user belongs to in Linux?
The group command in Linux helps to identify the group a user belongs to and is followed by the username. Example: To check user John’s group: groups john
Cron Jobs
What do you mean by cron jobs, and how is it scheduled to run a script every day at 2 AM?
A cron job is defined in a crontab file. Cron is a Linux utility to schedule tasks to run automatically at specified times. Example: To schedule a script ( /home/user/backup.sh ) to run daily at 2 AM: 0 2 * * * /home/user/backup.sh Where 0 means the minimum hour is 2, every day, every month, every day of the week.
How would you prevent cron job emails from being sent every time the job runs?
By default, cron sends an email with the output of the job. You can prevent this by redirecting the output to /dev/null. Example: To run a script daily at 2 AM and discard its output: 0 2 * * * /home/user/backup.sh > /dev/null 2>&1
System Performance Monitoring
How can you monitor system performance in Linux? Name some tools with their uses.
Some of the tools to monitor the performance are: Top: Live view of system processes and usage of resource htop: More user-friendly when compared to the top with an interactive interface. vmstat: Displays information about processes, memory, paging, block IO, and CPU usage. iostat: Showcases Central Processing Unit (CPU) and I/O statistics for devices and partitions. Example: You can use the top command ( top ) to identify processes consuming too much CPU or memory.
In Linux, how would you check the usage of disk space?
The df command checks disk space usage, and Du is responsible for checking the size of the directory/file. Example: To check overall disk space usage: df -h The -h option depicts the size in a human-readable format like GB, MB, etc.
Package Management (Red Hat)
How do you install, update, or remove packages in Red Hat-based Linux distributions by yum command?
In Red Hat and CentOS systems, the yum package manager is used to install, update, or remove software. Install a package: sudo yum install httpd This installs the Apache web server. Update a package: sudo yum update httpd Remove a package:sudo yum remove httpd
By which command will you check the installation of a package on a Red Hat system?
The yum list installed command is required to check whether the package is installed. Example: To check if httpd (Apache) is installed: yum list installed httpd
Conclusion
The questions are designed by our experienced corporate faculty which will help you to prepare well for various positions that require Linux such as System Admin.
Contact for Course Details – 8447712333
2 notes
·
View notes
Text
Optimizing Performance on Enterprise Linux Systems: Tips and Tricks
Introduction: In the dynamic world of enterprise computing, the performance of Linux systems plays a crucial role in ensuring efficiency, scalability, and reliability. Whether you're managing a data center, cloud infrastructure, or edge computing environment, optimizing performance is a continuous pursuit. In this article, we'll delve into various tips and tricks to enhance the performance of enterprise Linux systems, covering everything from kernel tuning to application-level optimizations.
Kernel Tuning:
Adjusting kernel parameters: Fine-tuning parameters such as TCP/IP stack settings, file system parameters, and memory management can significantly impact performance. Tools like sysctl provide a convenient interface to modify these parameters.
Utilizing kernel patches: Keeping abreast of the latest kernel patches and updates can address performance bottlenecks and security vulnerabilities. Techniques like kernel live patching ensure minimal downtime during patch application.
File System Optimization:
Choosing the right file system: Depending on the workload characteristics, selecting an appropriate file system like ext4, XFS, or Btrfs can optimize I/O performance, scalability, and data integrity.
File system tuning: Tweaking parameters such as block size, journaling options, and inode settings can improve file system performance for specific use cases.
Disk and Storage Optimization:
Utilizing solid-state drives (SSDs): SSDs offer significantly faster read/write speeds compared to traditional HDDs, making them ideal for I/O-intensive workloads.
Implementing RAID configurations: RAID arrays improve data redundancy, fault tolerance, and disk I/O performance. Choosing the right RAID level based on performance and redundancy requirements is crucial.
Leveraging storage technologies: Technologies like LVM (Logical Volume Manager) and software-defined storage solutions provide flexibility and performance optimization capabilities.
Memory Management:
Optimizing memory allocation: Adjusting parameters related to memory allocation and usage, such as swappiness and transparent huge pages, can enhance system performance and resource utilization.
Monitoring memory usage: Utilizing tools like sar, vmstat, and top to monitor memory usage trends and identify memory-related bottlenecks.
CPU Optimization:
CPU affinity and scheduling: Assigning specific CPU cores to critical processes or applications can minimize contention and improve performance. Tools like taskset and numactl facilitate CPU affinity configuration.
Utilizing CPU governor profiles: Choosing the appropriate CPU governor profile based on workload characteristics can optimize CPU frequency scaling and power consumption.
Application-Level Optimization:
Performance profiling and benchmarking: Utilizing tools like perf, strace, and sysstat for performance profiling and benchmarking can identify performance bottlenecks and optimize application code.
Compiler optimizations: Leveraging compiler optimization flags and techniques to enhance code performance and efficiency.
Conclusion: Optimizing performance on enterprise Linux systems is a multifaceted endeavor that requires a combination of kernel tuning, file system optimization, storage configuration, memory management, CPU optimization, and application-level optimizations. By implementing the tips and tricks outlined in this article, organizations can maximize the performance, scalability, and reliability of their Linux infrastructure, ultimately delivering better user experiences and driving business success.
For further details click www.qcsdclabs.com

#redhatcourses#redhat#linux#redhatlinux#docker#dockerswarm#linuxsystem#information technology#enterpriselinx#automation#clustering#openshift#cloudcomputing#containerorchestration#microservices#aws
1 note
·
View note
Text
How Hostzop Offers 24/7 Expert Support for Dedicated Servers in India
In today's digital-first economy, downtime is not just an inconvenience — it's a liability. Enterprises and growing companies rely heavily on robust server infrastructure to power mission-critical applications, manage significant transactions, support ERP systems, and enable seamless digital experiences. But having the proper hardware alone isn't enough. What truly sets a hosting provider apart is the caliber and availability of its technical support.

The support framework often decides between sustained growth and operational bottlenecks for enterprises seeking Dedicated Server Hosting in India. Hostzop has built its reputation on more than just premium infrastructure — the 24/7 expert support system ensures peace of mind, performance stability, and business continuity.
Tiered Technical Expertise at All Hours
Unlike generic hosting support desks that rely on scripted responses, Hostzop maintains a tiered support architecture staffed by certified professionals across networking, Linux, Windows, and virtualization platforms.
Level 1: Immediate Response
The first layer of support is designed for rapid acknowledgment and basic troubleshooting. Available via live Chat, ticketing system, and phone, this team ensures that no client query goes unanswered, regardless of the hour.
Level 2: Advanced Diagnostics
For deeper technical analysis, Level 2 engineers step in with domain-level expertise. They provide precise resolutions for persistent latency issues, kernel-level errors, or sudden configuration misalignments.
Level 3: Infrastructure Specialists
This elite team handles complex networking challenges, hypervisor tuning, hardware diagnostics, and multi-node configurations — critical for businesses utilizing advanced Dedicated Server Hosting in India setups like clustered databases, GPU servers, and high-availability architectures.
Round-the-Clock Monitoring & Alert Systems
Hostzop's proactive support philosophy is embedded in its enterprise-grade monitoring tools. Every Dedicated Server Hosting in India deployment is connected to Hostzop's proprietary monitoring platform — EdgeOS — which tracks:
CPU, Memory, and Disk utilization
Uptime and I/O anomalies
Network throughput and packet loss
Service availability (HTTP, FTP, Mail, etc.)
Threshold breaches trigger real-time alerts, ensuring the technical team can take corrective actions before the client notices an issue.
This proactive approach reduces mean time to resolution (MTTR), avoids performance degradation, and protects businesses from sudden outages, especially those handling time-sensitive workloads like ecommerce, fintech, or media streaming.
Expert Assistance Across Use Cases
Support at Hostzop isn't just reactive — it's consultative. The engineering team understands that Dedicated Server Hosting in India spans many use cases. Hence, their support strategy adapts to different environments:
Application Hosting
Support for clients hosting ERP platforms such as SAP, Odoo, or Tally includes database tuning, middleware configuration (like Apache, NGINX, or Tomcat), and performance profiling.
RDP & VDI Environments
Businesses leveraging Hostzop servers for remote desktop access benefit from support on RDP licensing, GPU passthrough for enhanced rendering, session isolation, and bandwidth optimization.
AI/ML Workloads
GPU-dense configurations often require specific driver installations, CUDA dependencies, and container orchestration, which Hostzop's technical specialists handle with precision.
Compliance Hosting
From PCI-DSS to GDPR, support includes guidance on secure port management, encryption setup, firewall hardening, and audit readiness for clients in banking, healthcare, and ecommerce domains.
Rapid Hardware Replacement & Onsite Engineering
Hostzop's infrastructure is powered by AdaniConneX Chennai 1 — a Tier 4 data center allowing concurrent maintainability and fault tolerance. Within this ecosystem, hardware issues are handled swiftly through:
Hot-swappable components: Ensuring drives, PSUs, and RAM can be replaced without server shutdown.
24/7 onsite engineering: Trained personnel available inside the data center to act on physical issues, minimizing disruption.
Automated failover and data replication: In cases where uptime is critical, replication systems take over while support restores the failed node.
This is a critical differentiator in the Indian hosting landscape, where many providers still operate on delayed replacement models or rely on third-party facilities with minimal physical presence.
Seamless Communication Channels
Support is only practical if clients can reach it easily. Hostzop offers multichannel communication and multilingual support to cater to India's diverse business community.
Contact Modes:
Live Chat via website (Instant access)
Phone Support for voice-based resolution
Email/Ticketing with SLA-based responses
WhatsApp & Telegram for quick remote updates and link sharing
Communication Features:
Transparent ticket history and logs
Real-time updates and resolution timelines
Escalation matrix for priority cases
Whether it's a late-night deployment or an early morning traffic spike, support is not just available — it is accountable.
Knowledge Base, Documentation & Self-Help
Hostzop maintains a growing knowledge base of well-documented guides, use-case walkthroughs, and troubleshooting manuals to empower system administrators and in-house tech teams. These cover:
OS reinstallation and patching
SSL configuration and renewal
Firewall and IP table rules
Snapshot creation and rollback
Load balancing setup
Backup scheduling and recovery
For companies looking to scale their DevOps pipelines, Hostzop's API documentation allows complete automation of server deployment, volume management, snapshot cloning, and firewall rule sets — all with expert assistance on standby.
Uptime-Backed SLAs with Human Accountability
Hostzop doesn't just promise 24/7 support — it legally backs it. Every plan under Dedicated Server Hosting in India has an SLA of 99.98% uptime, with documented penalties and response times for various severity levels.
Severity Level Initial Response Time Resolution Commitment
Critical (P1) 10 minutes Within 1 hour
High (P2) 30 minutes Within 4 hours
Medium (P3) 1 hour Within 12 hours
Low (P4) 4 hours Within 24 hours
This transparency ensures that businesses remain in control, even when emergencies arise.
Human-Centric Support for Indian Enterprises
Support is not just about technology — it's about understanding business pressures. Indian companies often deal with sudden surges in web traffic during festivals, flash sales, or financial year-end processes. Hostzop's team understands these dynamics and offers pre-surge consultations, custom scaling plans, and resource reservations — all through its 24/7 support arm.
From Chennai-based SMEs to pan-India tech conglomerates, businesses trust Hostzop to ensure their digital backbone stays resilient, no matter the hour or demand.
Final Thought
Choosing a provider for Dedicated Server Hosting in India is more than a hardware decision — it's a long-term partnership. With Hostzop's unwavering commitment to 24/7 expert support, backed by Tier 4 infrastructure and proactive engineering, enterprises don't just get a server — they gain a vigilant support system that's always operational, accountable, and one step ahead.
0 notes
Text
Performance Optimization Techniques for Desktop Applications

In today’s fast-paced digital world, users expect desktop applications to run smoothly and efficiently. Whether you’re working with a custom software development company or developing applications in-house, optimizing the performance of your desktop software is crucial to delivering an excellent user experience. Slow load times, lagging interfaces, or excessive resource consumption can frustrate users and lead to lost productivity or customers. In this blog, we’ll explore key techniques to improve the performance of desktop applications and keep them running at their best.
1. Efficient Memory Management
One of the biggest culprits for slow desktop applications is poor memory usage. To optimize performance:
Avoid memory leaks by ensuring all allocated resources are properly released.
Use profiling tools to identify which parts of your code consume the most memory.
Implement object pooling to reuse objects instead of creating new ones repeatedly.
Choose appropriate data structures that minimize memory overhead.
2. Optimize CPU Usage
High CPU consumption can slow down not just your application but the entire system. To reduce CPU load:
Minimize the use of busy-wait loops and prefer event-driven programming.
Offload intensive computations to background threads to keep the UI responsive.
Use efficient algorithms and optimize loops and recursive functions.
Profile CPU usage regularly to spot bottlenecks.
3. Improve Disk I/O Performance
Reading and writing to disk can often become a bottleneck:
Cache frequently accessed data in memory instead of repeated disk access.
Use asynchronous I/O operations to avoid blocking the main thread.
Compress data when storing large files to reduce read/write times.
Clean up temporary files regularly to keep disk usage optimal.
4. Reduce Startup Time
Users value quick access to applications:
Load only essential components during startup and defer others until needed.
Use lazy loading techniques to load modules or resources on demand.
Precompile or cache frequently used resources for faster access.
5. Optimize UI Rendering
A smooth and responsive UI greatly enhances user satisfaction:
Minimize unnecessary redraws or reflows in the UI.
Use hardware acceleration when available for graphics-intensive applications.
Batch UI updates to reduce processing overhead.
Keep the UI thread free from heavy computations.
6. Utilize Profiling and Monitoring Tools
Regularly monitoring your application’s performance helps identify issues early:
Use profiling tools like Visual Studio Profiler, Intel VTune, or Valgrind.
Monitor application behavior in different environments and usage scenarios.
Collect performance metrics and analyze trends over time.
7. Keep Dependencies Lightweight
Sometimes external libraries or frameworks can bloat your application:
Review and remove unused dependencies.
Opt for lightweight or native libraries instead of heavy frameworks.
Update dependencies regularly to benefit from performance improvements.
Optimizing desktop applications requires a combination of smart coding practices, regular profiling, and attention to detail. By applying these techniques, developers can ensure their applications run efficiently, providing users with a seamless and enjoyable experience. Whether you are part of a software development company or managing your own projects, prioritizing performance will set your software apart.
If you want to deliver top-notch software, partnering with reliable software development services can help you integrate these optimization strategies effectively while meeting your business goals.
#custom desktop application development services#desktop application development services#desktop application development company
0 notes
Text
In today’s digital era, database performance is critical to the overall speed, stability, and scalability of modern applications. Whether you're running a transactional system, an analytics platform, or a hybrid database structure, maintaining optimal performance is essential to ensure seamless user experiences and operational efficiency.
In this blog, we'll explore effective strategies to improve database performance, reduce latency, and support growing data workloads without compromising system reliability.
1. Optimize Queries and Use Prepared Statements
Poorly written SQL queries are often the root cause of performance issues. Long-running or unoptimized queries can hog resources and slow down the entire system. Developers should focus on:
Using EXPLAIN plans to analyze query execution paths
Avoiding unnecessary columns or joins
Reducing the use of SELECT *
Applying appropriate filters and limits
Prepared statements can also boost performance by reducing parsing overhead and improving execution times for repeated queries.
2. Leverage Indexing Strategically
Indexes are powerful tools for speeding up data retrieval, but improper use can lead to overhead during insert and update operations. Indexes should be:
Applied selectively to frequently queried columns
Monitored for usage and dropped if rarely used
Regularly maintained to avoid fragmentation
Composite indexes can also be useful when multiple columns are queried together.
3. Implement Query Caching
Query caching can drastically reduce response times for frequent reads. By storing the results of expensive queries temporarily, you avoid reprocessing the same query multiple times. However, it's important to:
Set appropriate cache lifetimes
Avoid caching volatile or frequently changing data
Clear or invalidate cache when updates occur
Database proxy tools can help with intelligent query caching at the SQL layer.
4. Use Connection Pooling
Establishing database connections repeatedly consumes both time and resources. Connection pooling allows applications to reuse existing database connections, improving:
Response times
Resource management
Scalability under load
Connection pools can be fine-tuned based on application traffic patterns to ensure optimal throughput.
5. Partition Large Tables
Large tables with millions of records can suffer from slow read and write performance. Partitioning breaks these tables into smaller, manageable segments based on criteria like range, hash, or list. This helps:
Speed up query performance
Reduce index sizes
Improve maintenance tasks such as vacuuming or archiving
Partitioning also simplifies data retention policies and backup processes.
6. Monitor Performance Metrics Continuously
Database monitoring tools are essential to track performance metrics in real time. Key indicators to watch include:
Query execution time
Disk I/O and memory usage
Cache hit ratios
Lock contention and deadlocks
Proactive monitoring helps identify bottlenecks early and prevents system failures before they escalate.
7. Ensure Hardware and Infrastructure Support
While software optimization is key, underlying infrastructure also plays a significant role. Ensure your hardware supports current workloads by:
Using SSDs for faster data access
Scaling vertically (more RAM/CPU) or horizontally (sharding) as needed
Optimizing network latency for remote database connections
Cloud-native databases and managed services also offer built-in scaling options for dynamic workloads.
8. Regularly Update and Tune the Database Engine
Database engines release frequent updates to fix bugs, enhance performance, and introduce new features. Keeping your database engine up-to-date ensures:
Better performance tuning options
Improved security
Compatibility with modern application architectures
Additionally, fine-tuning engine parameters like buffer sizes, parallel execution, and timeout settings can significantly enhance throughput.
0 notes
Text
📊 Monitoring Systems and Services with Prometheus: Real-Time Insights for Modern Infrastructure
In today’s fast-moving DevOps world, real-time monitoring is not optional—it’s essential. As systems become increasingly dynamic, cloud-native, and microservices-driven, traditional monitoring solutions often fall short. That’s where Prometheus, an open-source monitoring and alerting toolkit, shines.
🚀 Why Prometheus?
Prometheus, a project under the Cloud Native Computing Foundation (CNCF), is built for reliability, scalability, and multi-dimensional monitoring in dynamic environments. It’s the go-to solution for Kubernetes environments and modern microservices architectures.
Key Benefits:
Pull-based metrics collection via HTTP
Powerful multi-dimensional data model
PromQL (Prometheus Query Language) for flexible queries
Easy integration with Grafana for dashboards
Built-in alerting with Alertmanager
🔍 Core Components of Prometheus
1️⃣ Prometheus Server – Scrapes and stores time-series data 2️⃣ Exporters – Collect metrics from services, systems, and applications (e.g., Node Exporter, Blackbox Exporter) 3️⃣ Pushgateway – Allows ephemeral jobs to push metrics 4️⃣ Alertmanager – Manages alerts and routes notifications (email, Slack, PagerDuty) 5️⃣ Grafana – Visualizes Prometheus data in customizable dashboards
Setting Up Prometheus (Basic Workflow)
Install Prometheus on your server or Kubernetes cluster.
Configure the prometheus.yml file to define scrape jobs and targets.
Deploy exporters on the target systems (e.g., node_exporter for system metrics).
Use PromQL to query real-time data and analyze performance metrics.
Set alert rules and connect Alertmanager to handle incidents.
📈 What Can You Monitor?
System metrics (CPU, memory, disk I/O)
Application metrics (API latency, error rates)
Kubernetes cluster health
Database performance
Uptime checks & network availability
💡 Real Use Case: Prometheus + Kubernetes
Prometheus excels in containerized environments. By integrating with Kubernetes, it can automatically discover services, collect pod-level metrics, and scale horizontally with minimal overhead. It’s often paired with Kube-State-Metrics, cAdvisor, and Grafana for a full-stack observability setup.
✅ Final Thoughts
Prometheus isn’t just a tool—it’s a monitoring ecosystem designed for modern infrastructure. Whether you're managing bare metal, VMs, or Kubernetes clusters, Prometheus gives you the power to observe, alert, and act with precision.
By combining it with Grafana and Alertmanager, you can transform raw metrics into actionable insights and build a truly resilient system.
📖 Start building your monitoring stack today with Prometheus — and never fly blind again.
For more insights, follow: Hawkstack Technologies
#Prometheus#Monitoring#DevOps#Observability#Grafana#Kubernetes#CloudNative#Alerting#OpenSourceTools#SRE#Metrics#RedHat#MonitoringWithPrometheus#HawkstackTechnologies
0 notes
Text
Difference Between Server Management and Server Monitoring?
Certainly! Server management and server monitoring are distinct but closely related aspects of maintaining a server’s health, performance, and availability. Here’s a breakdown of the two:
Server Management
Server management involves the comprehensive administration, configuration, and upkeep of servers to ensure they operate optimally and meet business requirements. It focuses on proactive and reactive actions to maintain the server’s overall health.
Key Aspects:
1. Configuration and Setup:
• Installing operating systems and software.
• Configuring server roles, permissions, and security settings.
2. Maintenance:
• Applying software updates and patches.
• Performing regular backups and managing storage.
3. Optimization:
• Adjusting server settings for improved performance.
• Allocating resources such as CPU, memory, and disk space efficiently.
4. Troubleshooting and Repairs:
• Diagnosing and fixing hardware or software issues.
• Replacing faulty components.
5. Security:
• Implementing firewalls, antivirus software, and intrusion detection systems.
• Ensuring compliance with regulatory standards.
6. Resource Management:
• Scaling resources up or down based on demand.
• Managing user access and workloads.
Server Monitoring
Server monitoring, on the other hand, is the process of continuously tracking a server’s performance, availability, and health. It focuses on identifying and alerting administrators about potential issues in real time to prevent downtime or service disruptions.
Key Aspects:
1. Performance Tracking:
• Monitoring CPU usage, memory usage, disk I/O, and network traffic.
• Identifying bottlenecks or performance degradation.
2. Availability Checks:
• Ensuring the server and its services are up and running.
• Tracking uptime and downtime.
3. Alerting and Notifications:
• Setting thresholds for resource usage or errors.
• Sending alerts (e.g., email, SMS) when issues are detected.
4. Log Analysis:
• Reviewing server logs to identify errors or unusual activity.
• Analyzing trends over time for predictive insights.
5. Integration with Tools:
• Using tools like Nagios, Zabbix, or SolarWinds for automated monitoring.
• Employing dashboards for real-time visualization of server health.
6. Proactive Measures:
• Detecting potential hardware failures.
• Identifying security breaches or unauthorized access.
Key Differences
Feature Server Management Server Monitoring
Purpose Administering and maintaining the server. Observing and analyzing server performance.
Scope Broad, includes all aspects of server operation. Narrow, focuses on performance and health tracking.
Nature Proactive and reactive. Mostly proactive (real-time monitoring).
Tools Configuration tools, backup solutions. Monitoring software, alert systems.
Outcome Stability, efficiency, and security. Timely detection of issues to prevent downtime.
How They Work Together
• Server monitoring provides the data and alerts that inform server management decisions.
• For instance, if server monitoring detects high CPU usage, server management might involve adding more resources or optimizing workloads.
By combining effective server management with continuous monitoring, organizations can ensure their servers operate reliably and efficiently. Let me know if you’d like specific examples or tools for either!
0 notes
Text
Generative AI in IT Workspace: The Future of Real-Time Decision-Making, Downtime Prevention, and Infrastructure Optimization
The role of IT in enterprise operations has evolved beyond managing infrastructure. Today, IT is at the heart of every strategic initiative—from enabling remote work and maintaining cybersecurity to ensuring seamless customer experiences. Amidst this complexity, Generative AI in the IT workspace is emerging as a transformative force. It empowers teams to shift from reactive problem-solving to proactive and predictive operations.

This blog explores how Generative AI is revolutionizing IT environments through real-time decision-making, minimizing downtime, and optimizing infrastructure for scalable, intelligent operations.
1. Understanding Generative AI in the Context of IT Operations
Generative AI is not just about generating text or code—it’s about simulating reasoning, pattern recognition, and intelligent action. In the IT workspace, this translates to:
Generating actionable insights from vast, unstructured logs
Creating automated scripts for issue resolution
Simulating infrastructure changes before deployment
Learning from past incidents to prevent future failures
Unlike traditional AI models focused on classification or regression, Generative AI builds upon large language models (LLMs) and foundation models to perform autonomous tasks, suggest solutions, and dynamically evolve with the IT ecosystem.
2. Real-Time Decision-Making Powered by Generative AI
Why Real-Time Matters
Milliseconds matter in IT—whether it’s detecting a DDoS attack or reallocating cloud resources to meet demand spikes. Real-time decision-making improves:
Incident response speed
System reliability
End-user satisfaction
How Generative AI Makes It Happen
Conversational Interfaces: AI copilots integrated into tools like Microsoft Teams or Slack provide real-time alerts, recommendations, and command execution capabilities.
Streaming Data Analysis: Generative AI processes live telemetry and logs, summarizing anomalies or performance trends instantly.
Context-Aware Actions: The AI understands current configurations, dependencies, and SLAs to offer decisions aligned with business impact.
Example: If a database shows high latency, the AI might suggest a query optimization, initiate a failover, or provision additional compute resources—automatically or with human approval.
3. Downtime Prevention Through Predictive and Autonomous Action
The High Cost of Downtime
Downtime costs businesses an average of $5,600 per minute, according to Gartner. From lost revenue to reputational damage, the consequences are severe. Prevention requires foresight—and this is where Generative AI excels.
Key Capabilities of Generative AI in Downtime Prevention
Anomaly Detection with Root Cause Suggestions AI agents can analyze historical outages and detect early warning signs, offering probable causes and quick fixes before issues escalate.
Predictive Maintenance of Infrastructure By learning patterns in system degradation, AI can forecast component failures—whether it’s a memory leak, disk I/O bottleneck, or CPU overheating.
Self-Healing Systems Generative AI can autonomously trigger scripts to restart services, rebalance workloads, or isolate affected containers without waiting for human input.
Real-world use case: In Kubernetes environments, AI agents can monitor node health and proactively reschedule workloads from a failing pod to prevent service disruption.
4. Infrastructure Optimization for Efficiency and Scalability
Why Optimization Is a Moving Target
In cloud-native environments, optimization isn’t a one-time task—it’s a continuous loop. You’re balancing cost, performance, latency, and availability across hybrid or multi-cloud setups. Generative AI simplifies this complexity.
What Generative AI Does Differently
Dynamic Resource Allocation: Based on real-time application load and user behavior, AI recommends or initiates scaling operations—horizontal or vertical.
Configuration Tuning: From serverless functions to container orchestration, the AI tunes parameters like memory limits, concurrency thresholds, and storage policies.
Cloud Cost Intelligence: Generative AI generates contextual cost breakdowns and optimization strategies (e.g., moving workloads to spot instances or lower-tier storage).
Impact: IT leaders can expect 20–30% cost reduction and 40% better resource utilization with AI-powered infrastructure insights.
5. Generative AI Agents as Digital Co-Pilots for IT Teams
Generative AI isn't replacing IT professionals—it’s augmenting their capabilities. AI copilots embedded in the workspace offer:
Task Automation: From provisioning virtual machines to rolling out security patches.
Knowledge Retrieval: Pulling relevant SOPs, architecture diagrams, or config files in seconds.
Incident Collaboration: Summarizing events, compiling response timelines, and suggesting RCA documentation.
The result? Faster resolution, reduced human error, and a smarter IT workforce.
6. Seamless Integration Across ITSM, DevOps, and Monitoring Tools
Generative AI platforms can be integrated with:
ITSM platforms like ServiceNow and Zendesk
Monitoring tools like Datadog, Prometheus, and New Relic
CI/CD pipelines in GitLab, Jenkins, or Azure DevOps
Once connected, the AI doesn't just observe—it acts:
Auto-generates tickets from alerts
Suggests remediation based on past fixes
Adds intelligent context to every incident report
This fusion enables closed-loop automation—from issue detection to ticket resolution, entirely streamlined.
7. Security, Governance, and Human Oversight
Adopting Generative AI in IT demands a strong foundation of:
Data privacy and access controls
AI model explainability and auditing
Fail-safes and human-in-the-loop mechanisms
With the right governance, organizations can ensure that AI recommendations align with compliance frameworks like ISO 27001, NIST, or GDPR.
8. Business Impact and ROI of Generative AI in IT
According to a McKinsey report (2024), companies that embedded Generative AI into their IT operations saw:
60% reduction in mean time to resolution (MTTR)
35% improvement in system uptime
3x increase in employee productivity for Level 1 support
When measured over a year, the ROI is substantial—both in dollars and in strategic agility.
Conclusion: The AI-Driven IT Future Is Here
As businesses demand always-on services, secure platforms, and lightning-fast innovation, IT teams can no longer rely on manual operations alone. Generative AI in the IT workspace is the intelligent engine that powers real-time decisions, prevents downtime, and optimizes infrastructure—continuously.
It’s not a tool of the future—it’s the competitive advantage of today.
0 notes
Text
Thin Provisioning Deep Dive: Maximizing SAN Storage Capacity Without Risk
Storage efficiency has become a top priority for IT leaders navigating exponential data growth, tight budgets, and the need for operational agility. One technology stands out for its ability to squeeze more value out of every storage dollar in SAN environments: thin provisioning. While the promise of allocating just the storage actually in use is attractive, thin provisioning also poses challenges that require careful planning and oversight. This deep-dive will unpack the real benefits, examine the risks, share practical use cases, and outline actionable best practices for deploying thin provisioning in your SAN solution infrastructure.
Why Thin Provisioning? Unpacking the Benefits
Cost Savings Without Compromise
Traditional storage provisioning forces administrators to allocate the full requested capacity from day one, resulting in significant “dead on arrival” storage. Thin provisioning breaks this pattern. It enables you to assign more virtual storage to hosts than physically exists on the system, only using physical capacity as data is actually written.
Reduced upfront capital expenditure: By provisioning storage “just in time,” enterprises avoid over-purchasing disks and arrays. IDC research estimates organizations can cut capital storage costs by up to 33% through thin provisioning, especially in rapidly expanding data environments.
Optimized utilization rates: Classic thick provisioning can leave average utilization rates lingering between 20-30%. Thin provisioned SANs regularly see utilization jump to 60-80%, significantly increasing ROI on hardware investments.
Defers hardware upgrades: Because storage is consumed based on actual use, purchasing cycles are extended, and organizations face less pressure to scramble for additional hardware.
Flexibility and Agility in a Dynamic Landscape
Modern enterprises must respond rapidly to evolving workload demands. Thin provisioning offers the ability to:
Quickly provision storage for new projects or virtual machines without lengthy procurement or physical configuration.
Scale allocated capacity up or down seamlessly, supporting DevOps workflows and cloud-native applications that thrive on adaptability.
Simplify storage management, as administrators focus on logical provisioning and pool management rather than micromanaging LUNs.
Green IT and Operational Efficiency
By consuming less power, cooling, and floor space, thin provisioning also contributes to sustainability targets and operational cost reduction. Fewer idle drives spinning in racks means a smaller environmental and budgetary footprint.
Navigating Risks and Strategies for Mitigation
No technology comes without trade-offs. The primary concerns with thin provisioning fall into two categories: over-allocation (oversubscription) and potential performance impacts.
The Over-Allocation Challenge
Thin provisioning’s power comes from presenting more capacity to servers than is actually available. However, if actual consumption approaches or exceeds the physical space, it can result in “out-of-space” errors, data loss, or application downtime.
Mitigation strategies include:
Continuous monitoring: Leverage SAN software tools and SNMP-based alerts to track real capacity usage, free space in pools, and growth trends in real time.
Automated thresholds and notifications: Set utilization alarms at 70%, 85%, and 95% so administrators can react well before a crisis occurs.
Scheduled audits: Regularly review allocation versus usage across applications. Identify and retire unused LUNs.
Performance Overheads
Thin provisioning can introduce extra I/O when the system needs to allocate new blocks or manage metadata, which may result in additional latency compared to pre-allocated (thick provisioned) storage.
To mitigate performance risks:
Ensure the storage controller has sufficient cache and CPU to handle provisioning overhead.
Use high-performance disk arrays or all-flash backends for heavy I/O workloads.
Monitor IOPS and latency metrics at the pool and LUN levels, not just physical disks.
Thin Provisioning in Action: Key Use Cases
Virtual Infrastructure Environments
VMware, Hyper-V, and KVM-based data centers are prime beneficiaries of thin provisioning, as virtual machines often request large amounts of disk that remain unused for long periods. Thin provisioning allows hosting organizations to grow clusters without investing in capacity that might never be used, all while maintaining flexibility for rapid scale-up.
Test and Development Sandboxes
Development, QA, and test environments typically need large amounts of temporary space. Thin provisioning enables IT to grant generous LUNs to teams, knowing the underlying consumption is likely far less. This drastically reduces wasted capacity in sandbox environments.
Database Storage
While mission-critical databases sometimes favor thick provisioning for guaranteed throughput (think high-frequency trading or ERP), many production and analytics environments benefit from thin provisioning, especially when columns or “future growth” are sized for maximum but rarely utilized.
Cloud Service Providers
Multi-tenant clouds or managed hosting providers leverage thin provisioning to maximize density across customer workloads, lowering per-customer costs and shortening new-user onboarding times.
Disaster Recovery and Backup
Thin provisioning in DR sites or backup arrays reduces storage footprints for infrequently used replicated data sets, deferring expensive hardware purchases until absolutely necessary.
Best Practices for Deploying and Managing Thin Provisioning
1. Know Your Workloads
Assess which applications are suitable for thin provisioning. Critical production databases demanding the lowest latency may be assigned thick-provisioned disks, while dev/test, file shares, or archival systems can maximize savings with thin provisioning.
2. Plan for Over-Allocation
Map out “worst-case” consumption scenarios. Many organizations safely oversubscribe at 3x or 4x physical capacity, but this relies on accurate forecasting of growth, regular monitoring, and proactive expansion when thresholds are approached.
3. Invest in Robust Monitoring Tools
Select SAN platforms that support detailed monitoring, alerting, and automation. Consider dashboards that offer historical trending, instant notifications, and integration with enterprise monitoring solutions like Nagios or Splunk.
4. Document and Communicate Policies
Ensure all teams who request storage understand the implications of thin provisioning. Document policies for allocation, user responsibility, and escalation procedures if growth exceeds projections.
5. Regularly Review and Reclaim Space
Unused LUNs or volumes: Routinely retire and reclaim resources that are no longer needed.
Zero detection and unmap commands: Use features that detect all-zero blocks and return unused space to the pool, increasing available capacity.
6. Balance Thin and Thick Provisioning
Mixed environments are common. Use thin provisioning where it offers the most benefit, but don’t hesitate to assign thick disks for workloads requiring predictable performance.
7. Test Failover and Recovery Procedures
Simulate near-capacity events and failover scenarios in a lab environment. Use these exercises to fine-tune alerting, reporting, and recovery strategies so your team is prepared for real-world incidents.
The Road Ahead for Thin Provisioning
Thin provisioning has reached maturity in most enterprise SAN storage deployments, but its role continues to expand alongside more intelligent storage solutions. Advances in AI-powered analytics, predictive maintenance, and integration with container-based workloads are making thin provisioning even more automated and resilient.
Adopting thin provisioning isn’t just a tactical win for today’s cost-conscious storage teams; it’s a strategic move that will enable business agility as demands on storage continue to scale. By balancing aggressive space savings with strong governance and modern monitoring tools, enterprises can unlock dramatic efficiency gains without exposing themselves to unnecessary risks.
0 notes
Text
Solved COMP 3700: Project 2 auDiskTool - A Tool for Monitoring Disk Devices
1. Building your Linux disk monitoring tool – auDiskTool In this project, you have a Linux tool called – auDiskTool – to monitor disk performance (i.e., I/O transfer rates) in a Linux system. Your auDiskTool can output a file containing a list of reports (attached at the end) that help system administrators in configuring the Linux system to achieve good disk I/O performance. The monitoring…
0 notes
Text
Postal SMTP install and setup on a virtual server

Postal is a full suite for mail delivery with robust features suited for running a bulk email sending SMTP server. Postal is open source and free. Some of its features are: - UI for maintaining different aspects of your mail server - Runs on containers, hence allows for up and down horizontal scaling - Email security features such as spam and antivirus - IP pools to help you maintain a good sending reputation by sending via multiple IPs - Multitenant support - multiple users, domains and organizations - Monitoring queue for outgoing and incoming mail - Built in DNS setup and monitoring to ensure mail domains are set up correctly List of full postal features
Possible cloud providers to use with Postal
You can use Postal with any VPS or Linux server providers of your choice, however here are some we recommend: Vultr Cloud (Get free $300 credit) - In case your SMTP port is blocked, you can contact Vultr support, and they will open it for you after providing a personal identification method. DigitalOcean (Get free $200 Credit) - You will also need to contact DigitalOcean support for SMTP port to be open for you. Hetzner ( Get free €20) - SMTP port is open for most accounts, if yours isn't, contact the Hetzner support and request for it to be unblocked for you Contabo (Cheapest VPS) - Contabo doesn't block SMTP ports. In case you are unable to send mail, contact support. Interserver
Postal Minimum requirements
- At least 4GB of RAM - At least 2 CPU cores - At least 25GB disk space - You can use docker or any Container runtime app. Ensure Docker Compose plugin is also installed. - Port 25 outbound should be open (A lot of cloud providers block it)
Postal Installation
Should be installed on its own server, meaning, no other items should be running on the server. A fresh server install is recommended. Broad overview of the installation procedure - Install Docker and the other needed apps - Configuration of postal and add DNS entries - Start Postal - Make your first user - Login to the web interface to create virtual mail servers Step by step install Postal Step 1 : Install docker and additional system utilities In this guide, I will use Debian 12 . Feel free to follow along with Ubuntu. The OS to be used does not matter, provided you can install docker or any docker alternative for running container images. Commands for installing Docker on Debian 12 (Read the comments to understand what each command does): #Uninstall any previously installed conflicting software . If you have none of them installed it's ok for pkg in docker.io docker-doc docker-compose podman-docker containerd runc; do sudo apt-get remove $pkg; done #Add Docker's official GPG key: sudo apt-get update sudo apt-get install ca-certificates curl -y sudo install -m 0755 -d /etc/apt/keyrings sudo curl -fsSL https://download.docker.com/linux/debian/gpg -o /etc/apt/keyrings/docker.asc sudo chmod a+r /etc/apt/keyrings/docker.asc #Add the Docker repository to Apt sources: echo "deb https://download.docker.com/linux/debian $(. /etc/os-release && echo "$VERSION_CODENAME") stable" | sudo tee /etc/apt/sources.list.d/docker.list > /dev/null sudo apt-get update #Install the docker packages sudo apt-get install docker-ce docker-ce-cli containerd.io docker-buildx-plugin docker-compose-plugin -y #You can verify that the installation is successful by running the hello-world image sudo docker run hello-world Add the current user to the docker group so that you don't have to use sudo when not logged in as the root user. ##Add your current user to the docker group. sudo usermod -aG docker $USER #Reboot the server sudo reboot Finally test if you can run docker without sudo ##Test that you don't need sudo to run docker docker run hello-world Step 2 : Get the postal installation helper repository The Postal installation helper has all the docker compose files and the important bootstrapping tools needed for generating configuration files. Install various needed tools #Install additional system utlities apt install git vim htop curl jq -y Then clone the helper repository. sudo git clone https://github.com/postalserver/install /opt/postal/install sudo ln -s /opt/postal/install/bin/postal /usr/bin/postal Step 3 : Install MariaDB database Here is a sample MariaDB container from the postal docs. But you can use the docker compose file below it. docker run -d --name postal-mariadb -p 127.0.0.1:3306:3306 --restart always -e MARIADB_DATABASE=postal -e MARIADB_ROOT_PASSWORD=postal mariadb Here is a tested mariadb compose file to run a secure MariaDB 11.4 container. You can change the version to any image you prefer. vi docker-compose.yaml services: mariadb: image: mariadb:11.4 container_name: postal-mariadb restart: unless-stopped environment: MYSQL_ROOT_PASSWORD: ${DB_ROOT_PASSWORD} volumes: - mariadb_data:/var/lib/mysql network_mode: host # Set to use the host's network mode security_opt: - no-new-privileges:true read_only: true tmpfs: - /tmp - /run/mysqld healthcheck: test: interval: 30s timeout: 10s retries: 5 volumes: mariadb_data: You need to create an environment file with the Database password . To simplify things, postal will use the root user to access the Database.env file example is below. Place it in the same location as the compose file. DB_ROOT_PASSWORD=ExtremelyStrongPasswordHere Run docker compose up -d and ensure the database is healthy. Step 4 : Bootstrap the domain for your Postal web interface & Database configs First add DNS records for your postal domain. The most significant records at this stage are the A and/or AAAA records. This is the domain where you'll be accessing the postal UI and for simplicity will also act as the SMTP server. If using Cloudflare, turn off the Cloudflare proxy. sudo postal bootstrap postal.yourdomain.com The above will generate three files in /opt/postal/config. - postal.yml is the main postal configuration file - signing.key is the private key used to sign various things in Postal - Caddyfile is the configuration for the Caddy web server Open /opt/postal/config/postal.yml and add all the values for DB and other settings. Go through the file and see what else you can edit. At the very least, enter the correct DB details for postal message_db and main_db. Step 5 : Initialize the Postal database and create an admin user postal initialize postal make-user If everything goes well with postal initialize, then celebrate. This is the part where you may face some issues due to DB connection failures. Step 6 : Start running postal # run postal postal start #checking postal status postal status # If you make any config changes in future you can restart postal like so # postal restart Step 7 : Proxy for web traffic To handle web traffic and ensure TLS termination you can use any proxy server of your choice, nginx, traefik , caddy etc. Based on Postal documentation, the following will start up caddy. You can use the compose file below it. Caddy is easy to use and does a lot for you out of the box. Ensure your A records are pointing to your server before running Caddy. docker run -d --name postal-caddy --restart always --network host -v /opt/postal/config/Caddyfile:/etc/caddy/Caddyfile -v /opt/postal/caddy-data:/data caddy Here is a compose file you can use instead of the above docker run command. Name it something like caddy-compose.yaml services: postal-caddy: image: caddy container_name: postal-caddy restart: always network_mode: host volumes: - /opt/postal/config/Caddyfile:/etc/caddy/Caddyfile - /opt/postal/caddy-data:/data You can run it by doing docker compose -f caddy-compose.yaml up -d Now it's time to go to the browser and login. Use the domain, bootstrapped earlier. Add an organization, create server and add a domain. This is done via the UI and it is very straight forward. For every domain you add, ensure to add the DNS records you are provided.
Enable IP Pools
One of the reasons why Postal is great for bulk email sending, is because it allows for sending emails using multiple IPs in a round-robin fashion. Pre-requisites - Ensure the IPs you want to add as part of the pool, are already added to your VPS/server. Every cloud provider has a documentation for adding additional IPs, make sure you follow their guide to add all the IPs to the network. When you run ip a , you should see the IP addresses you intend to use in the pool. Enabling IP pools in the Postal config First step is to enable IP pools settings in the postal configuration, then restart postal. Add the following configuration in the postal.yaml (/opt/postal/config/postal.yml) file to enable pools. If the section postal: , exists, then just add use_ip_pools: true under it. postal: use_ip_pools: true Then restart postal. postal stop && postal start The next step is to go to the postal interface on your browser. A new IP pools link is now visible at the top right corner of your postal dashboard. You can use the IP pools link to add a pool, then assign IP addresses in the pools. A pool could be something like marketing, transactions, billing, general etc. Once the pools are created and IPs assigned to them, you can attach a pool to an organization. This organization can now use the provided IP addresses to send emails. Open up an organization and assign a pool to it. Organizations → choose IPs → choose pools . You can then assign the IP pool to servers from the server's Settings page. You can also use the IP pool to configure IP rules for the organization or server. At any point, if you are lost, look at the Postal documentation. Read the full article
0 notes
Text
The iotop SECRET: Monitor & Speed Up Your Linux Like a Pro! ⚡
Struggling with slow Linux performance? Find out which processes are consuming your disk I/O and boost system speed using iotop! This tool helps you monitor, analyze, and troubleshoot disk usage like a pro.
💡 What You'll Learn in This Video: ✔️ What is iotop? Why it's a must-have tool for Linux performance monitoring ✔️ How to install and run iotop on Rocky Linux ✔️ Understanding iotop output & key metrics to detect high disk usage ✔️ Best iotop options & filters for efficient troubleshooting ✔️ Real-world scenarios: Catching high disk I/O processes in action 🛠
#Linux #iotop #LinuxPerformance #SystemMonitoring #LinuxTutorial
youtube
0 notes
Text
Top Site Reliability Engineering | SRE Online Training
Capacity Planning in SRE: Tools and Techniques

Capacity planning is one of the most critical aspects of Site Reliability Engineering (SRE). It ensures that systems are equipped to handle varying loads, scale appropriately, and perform efficiently, even under the most demanding conditions. Without adequate capacity planning, organizations risk performance degradation, outages, or even service disruptions when faced with traffic spikes or system failures. This article explores the tools and techniques for effective capacity planning in SRE.
What is Capacity Planning in SRE?
Capacity planning in SRE refers to the process of ensuring a system has the right resources (computing, storage, networking, etc.) to meet the expected workload while maintaining reliability, performance, and cost efficiency. It involves anticipating future resource needs and preparing infrastructure accordingly, avoiding overprovisioning, under-provisioning, or resource contention. Site Reliability Engineering Training
Effective capacity planning allows SRE teams to design systems that are resilient, performant, and capable of scaling with demand, ensuring seamless user experiences during periods of high load.
Tools for Capacity Planning in SRE
Prometheus Prometheus is an open-source monitoring system that gathers time-series data, which makes it ideal for tracking resource usage and performance over time. By monitoring metrics like CPU usage, memory consumption, network I/O, and disk utilization, Prometheus helps SRE teams understand current system performance and identify potential capacity bottlenecks. It also provides alerting capabilities, enabling early detection of performance degradation before it impacts end-users.
Grafana Often used in conjunction with Prometheus, Grafana is a popular open-source visualization tool that turns metrics into insightful dashboards. By visualizing capacity-related metrics, Grafana helps SREs identify trends and patterns in resource utilization. This makes it easier to make data-driven decisions on scaling, resource allocation, and future capacity planning.
Kubernetes Metrics Server For teams leveraging Kubernetes, the Metrics Server provides crucial data on resource usage for containers and pods. It tracks memory and CPU utilization, which is essential for determining whether the system can handle the current load and where scaling may be required. This data is also crucial for auto-scaling decisions, making it an indispensable tool for teams that rely on Kubernetes.
AWS Cloud Watch (or Azure Monitor, GCP Stackdriver) Cloud-native services like AWS CloudWatch offer real-time metrics and logs related to resource usage, including compute instances, storage, and networking. These services provide valuable insights into the capacity health of cloud-based systems and can trigger automated actions such as scaling up resources, adding more instances, or redistributing workloads to maintain optimal performance. SRE Certification Course
New Relic is a comprehensive monitoring and performance management tool that provides deep insights into application performance, infrastructure health, and resource usage. With advanced analytics capabilities, New Relic helps SREs predict potential capacity issues and plan for scaling and resource adjustments. It’s particularly useful for applications with complex architectures.
Techniques for Effective Capacity Planning
Historical Data Analysis One of the most reliable methods for predicting future capacity needs is by examining historical data. By analyzing system performance over time, SREs can identify usage trends and potential spikes in resource demand. Patterns such as seasonality, traffic growth, and resource consumption during peak times can help forecast future requirements. For example, if traffic doubles during certain months, teams can plan to scale accordingly.
Load Testing and Stress Testing Load testing involves simulating various traffic loads to assess how well the system performs under varying conditions. Stress testing goes one step further by testing the system’s limits to identify the breaking point. By performing load and stress tests, SRE teams can determine the system’s capacity threshold and plan resources accordingly.
Capacity Forecasting Forecasting involves predicting future resource requirements based on expected growth in user demand, traffic, or data. SREs use models that account for expected business growth, infrastructure changes, or traffic spikes to anticipate capacity needs in the coming months or years. Tools like historical data, trend analysis, and machine learning models can help build accurate forecasts.
Auto-Scaling Auto-scaling is an essential technique for dynamically adjusting system capacity based on real-time traffic demands. Cloud services like AWS, GCP, and Azure offer auto-scaling features that automatically add or remove resources based on pre-configured policies. These systems enable a more efficient capacity plan by automatically scaling up during periods of high demand and scaling down during off-peak times. SRE Course Online
Proactive Alerting Monitoring tools like Prometheus and Cloud Watch offer alerting mechanisms to notify SREs of imminent capacity issues, such as resource exhaustion. By setting thresholds and alerts for CPU, memory, or disk usage, SRE teams can proactively address problems before they escalate, allowing for more timely capacity adjustments.
Conclusion
Capacity planning in SRE is a critical discipline that requires both proactive and reactive strategies. By leveraging the right tools, including Prometheus, Grafana, and cloud-native monitoring services, SRE teams can ensure that their systems are always ready to handle traffic spikes and maintain high levels of reliability and performance. Techniques like historical data analysis, load testing, forecasting, auto-scaling, and proactive alerting empower SREs to anticipate, plan for, and mitigate potential capacity challenges. When implemented effectively, capacity planning ensures that systems are both cost-efficient and resilient, delivering seamless user experiences even during periods of high demand.
Visualpath is the Best Software Online Training Institute in Hyderabad. Avail complete Site Reliability Engineering (SRE) Training worldwide. You will get the best course at an affordable cost. For More Information Click Here
#SiteReliabilityEngineeringTraining#SRECourse#SiteReliabilityEngineeringOnlineTraining#SRETrainingOnline#SiteReliabilityEngineeringTraininginHyderabad#SREOnlineTraininginHyderabad#SRECoursesOnline#SRECertificationCourse
0 notes
Text
Mastering Stress Testing: Breaking Systems To Build Better Ones

When it comes to building resilient software, stress testing is like a rigorous obstacle course for your system, pushing it to its absolute limits. Think of it as bootcamp training where your app must endure and thrive under extreme conditions. For Developers, SDETs, and QAs, mastering stress testing is not just a skill—it's a necessity. In this comprehensive guide, we’ll dive deep into stress testing, with a focus on details, statistics, tools, and actionable insights.
What is Stress Testing?
Stress testing is a specialized form of performance testing designed to evaluate how an application behaves under extreme workloads, such as high user traffic, data processing, or resource constraints. Unlike load testing, which gradually increases demand, stress testing aims to push your system beyond its normal operational limits to identify breaking points and observe recovery mechanisms.
Types of Stress Testing
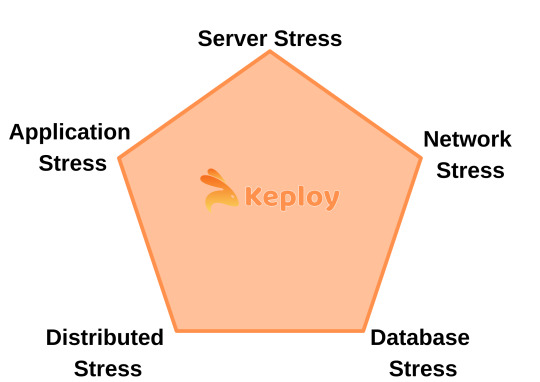
Server Stress Testing: Evaluates how servers handle requests during high loads.
Database Stress Testing: Assesses database integrity and performance under intense query execution.
Network Stress Testing: Tests bandwidth limitations, latency, and packet loss during heavy traffic.
Application Stress Testing: Simulates real-world scenarios where multiple components are stressed simultaneously.
Distributed Stress Testing: Involves testing distributed systems where several machines share the load.
Why is Stress Testing Important?
In today’s digital era, where downtime can cost businesses millions, stress testing ensures your system is ready for the worst-case scenarios. Let’s break it down:
Key Benefits of Stress Testing
Improved System Resilience: Identify weak points in infrastructure and fix them.
Enhanced User Experience: Avoid crashes during peak traffic events.
Prevent Revenue Loss: Minimize downtime costs during critical business operations.
Ensure Business Continuity: Build confidence in your system's reliability during disaster recovery.
Statistics Value
Cost of Downtime: A study by Gartner revealed that the average cost of IT downtime is $5,600 per minute, or $300,000 per hour for large enterprises.
User Retention: According to Google, 53% of users abandon a mobile site if it takes more than 3 seconds to load. Stress testing helps prevent such scenarios.
High-Traffic Events: Major e-commerce platforms like Amazon handle up to 760 sales per second during Black Friday. Without proper stress testing, they risk losing millions in revenue due to crashes.
The Stress Testing Process
To execute an effective stress test, you need a structured plan. Here's a detailed step-by-step approach:
1. Define Objectives
What to Measure: Response times, throughput, error rates, CPU/memory usage, disk I/O.
Performance Metrics: Set thresholds like max concurrent users, acceptable downtime, and recovery time.
Example:
Maximum response time: <500ms
Maximum downtime under stress: <5 minutes
2. Identify Scenarios
Choose scenarios that reflect real-world challenges. For example:
E-commerce: Simulate flash sales with sudden surges in user activity.
Streaming Apps: Test simultaneous video streaming by millions of users.
Banking Systems: Assess how the system handles bulk transactions on payday.
3. Simulate Extreme Loads
Start Small: Gradually increase the load to understand system behavior under normal conditions.
Push Limits: Exceed normal operational loads to identify the breaking point.
4. Monitor Metrics
Key metrics to track:
Response Times: Measure how long the system takes to process requests.
Error Rates: Monitor HTTP 500 or database connection errors.
Resource Utilization: CPU, memory, disk, and network usage.
System Recovery: Assess how quickly the system recovers after failure.
5. Analyze Results
Identify bottlenecks, such as database query slowdowns or server overloads.
Pinpoint the failure mode: Is it a crash, timeout, or data inconsistency?
6. Optimize and Retest
Fix the identified issues, optimize code, upgrade infrastructure if necessary.
Repeat the stress test until the system meets predefined benchmarks.
Top 5 Stress Testing Tools
Choosing the right tool is essential for effective stress testing. Here's a detailed comparison of popular tools:
Tool
Key Features
Best For
Cost
JMeter
Open-source, supports multiple protocols
Web apps, APIs
Free
Locust
Python-based, distributed testing
Scalable load scenarios
Free
BlazeMeter
Cloud-based, CI/CD integration
Continuous testing
Subscription
k6
Lightweight, JS scripting
Developer-centric performance testing
Free/Subscription
Gatling
Real-time metrics, supports HTTP/WebSocket
High-traffic simulation
Free/Subscription
Case Study: Apache JMeter
Scenario: An e-commerce platform preparing for a flash sale.
Setup: Simulated 100,000 users browsing products, adding items to the cart, and completing purchases.
Result: Identified a bottleneck in the payment gateway, which crashed under 50,000 concurrent users. Optimization reduced the gateway response time by 40%.
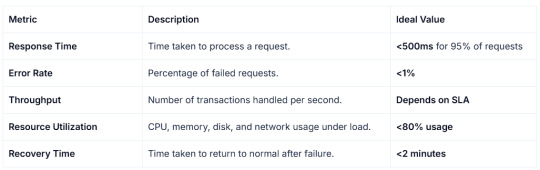
What the Stress Testing Metrics to look for?
Understanding the metrics is crucial for analyzing the results effectively. Here are the primary metrics you should focus on:
Common Challenges in Stress Testing
Defining Realistic Scenarios
Over-simplified scenarios can lead to inaccurate results.
Use production data to simulate user behavior accurately.
Monitoring and Logging
High loads generate massive logs, making it difficult to analyze.
Leverage log aggregation tools like Splunk or ELK Stack.
Infrastructure Constraints
Limited testing environments may not replicate production setups.
Use cloud-based testing solutions for scalability.
Automating Stress Tests
Frequent manual tests are time-consuming.
Integrate stress tests into CI/CD pipelines for continuous evaluation.
Real-World Examples
Netflix: Uses Chaos Monkey, a stress-testing tool that randomly disables components to test system resilience. It ensures uninterrupted streaming, even if parts of their infrastructure fail.
Slack: Simulated a load of 1 million messages per minute to test their message queuing system before launching a new feature. Stress testing helped identify and optimize bottlenecks.
Amazon: During Prime Day, stress tests simulate 10x normal traffic to ensure no disruptions occur during peak sales hours.
A Dynamic Duo for Stress and Regression Testing
Imagine pairing the precision of a seasoned drill sergeant with the sharp memory of a detective—this is what combining Keploy with k6 feels like for your testing strategy. k6, known for its developer-friendly scripting and ability to simulate extreme loads, ensures your system can survive the toughest conditions. Meanwhile, Keploy steps in like a detail-obsessed investigator, capturing real-world API interactions and verifying that nothing breaks, even after the chaos.
Here’s how they make magic together: After unleashing a storm of virtual users with k6, Keploy captures the real API calls, behaviors, and interactions and use them to generate automated regression test suite. By leveraging the strengths of k6 for performance testing and Keploy for regression testing, you can build a seamless testing workflows, which not only identify bottlenecks but can also ensure reliability, even under extreme conditions.
Conclusion
Stress testing is more than just breaking systems—it’s about building resilience and ensuring your application thrives in the real world. By incorporating structured stress tests, leveraging modern tools, and focusing on actionable metrics, you can create robust software that delights users, even under extreme conditions.
Remember, it’s not about avoiding stress but mastering it. So, let’s get those systems into the ring and stress them out—because that’s how you build software that’s ready for anything!
FAQ’s
What is the difference between stress testing and load testing?
Load testing gradually increases traffic to measure system capacity, while stress testing pushes the system beyond limits to identify failure points and recovery abilities.
What are some common challenges faced during stress testing?
Common challenges include defining realistic scenarios, managing large log data, infrastructure limitations, and automating tests for continuous evaluation.
What are the key metrics to track during a stress test?
Key metrics include response time (<500ms), error rate (<1%), throughput, resource utilization (<80%), and recovery time (<2 minutes).
0 notes