#wpf 3d chart
Explore tagged Tumblr posts
Visit Tumblr Blog
Explore Tumblr blogs with no restrictions, modern design and the best experience.
Last Seen Tumblr Blogs


Fun Fact
Tumblr has 4 main sources of revenue.
Text
Arction The Ultimate performance enhancer
Original Source: https://arctionltd.blogspot.com/2021/03/arction-ultimate-performance-enhancer.html
Are you looking for something to help you figure out massive amount of data in a simplified manner and in a blink of an eye? Look no more because Arction Ltd. is here with its LightningChart controls. Arction Ltd has been at the top of its game in manufacturing high-performance charting components for the visualization of huge data sets since 2007 and their strive for excellence continues even 10 years down the line. The company is known for specializing in the building high performance data visualization softwares. Arction Ltd has provided its expert solutions to many government as well as renowned private organizations like Samsung, Toyota, Nokia, U.S Airforce etc.
Product Overview
Though the company provides many products and services, its star product is the LightningChart. LightningChart.Net is the GPU accelerated 2D & 3D visualization SDK which contains over 100 interactive charts with functionalities that is needed for developing applications across diverse fields like: engineering, medicine, trading, financing, space and many more.
LightningChart .NET is the fastest data visualization SDK for WPF, WinForms and UWP and its GPU accelerated charting library helps in visualizing huge amount of data in lightning speed. The lightning charting library is available for Windows Forms, .Net, web and provide the most advanced charting solutions in the industry.
LightningChart offers:
There are many excellent features which are provided by the LightningChart controls. This includes 3D Charts, Polar View, Volume Rendering, XY charts, Signal Tools, Smith Charts, Maps and Trading charts.

Let’s look at what these charts have to offer:
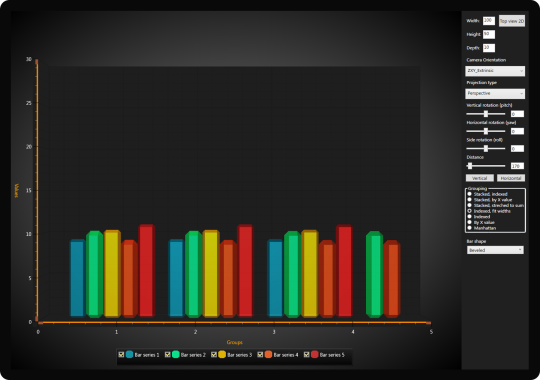
The 3D Chart has 3D scene settings with multiple light sources.
The series types that it offers are waterfall, rectangle planes, polygon, surface mesh and grid, mesh models, point-line, pie and bar charts. 3D models can be imported in .obj format
It can render and visualize huge surface sizes depending on the memory and space available
The Volume Rendering provides automatic and manual sampling rate for all channels.
For each channel it gives Separate Linear Transfer function It has three options available for Volume Rendering Ray function It provides modification of Voxel range which is dynamic in nature According to the voxel brightness of the channels it allocates volume thresholding accordingly
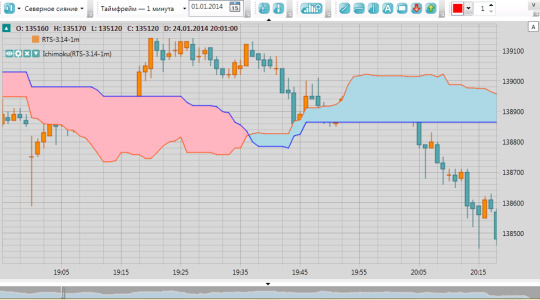
The Trading Charts includes trading data courses, technical indicators like Moving averages, Bollinger Band, RSI, MACD etc. along with drawing tools that includes Trend and regression lines, regression channels, Fibonacci arcs, fans and retracements, free-hand-annotations etc. All these features are in built in the application and the data can be loaded from rest API via file, internet, or setting by code.
Maps feature gives hundreds of world maps, continent maps and maps of specific areas.
It also provides on-line maps like street maps of specific areas. It gives multi terrain view including land, lakes, rivers, roads, cities etc. ESRI shape file data can be used to import maps.
The Signal Tools includes: SignalGenrator which is a signal generator component that combines various different waveforms into a single output SignalReader which generates real-time data signal files in many formats AudioInput and AudioOutput SpectrumCalculator which uses FFT algorithm to convert data between time domain and frequency domain
The Smith View gives series types like point-line and in normalized and absolute scales. The Polar View provides palette-colored point-line series, sectors and markers along with unlimited multiple amplitude and angle axes.
We all know that even when complex datasets are visualized in a simple and concise manner, gathering insights from them become a piece of cake. In the large ocean of data visualization tools provided by many companies, LightningChart controls by Arction Ltd stands out for obvious reasons. With advanced rendering technology and high-performance charting libraries for .NET and JavaScript, it makes its mark with outstanding execution performance. It further makes sure of utilizing memory and CPU resources efficiently while providing advanced data visualizations across platforms like web, mobile and desktop. Not only is their product amazing but also they give excellent customer service because of which they are trusted by industry leaders.
Moreover, it’s cost effective and will provide you the best value for your money. Their products and services are entirely customer centric and their commitment to their stakeholders is something to be reckoned with.
0 notes
Text
WPF Components For a World of Rich Visuals
If you need to develop new ideas, wpf components are what you need to build your dreams becoming reality. The limitless potential in the Windows Presentation Foundation (WPF) architecture can assist you visit your visions come alive in countless applications. An individual interface system is the backbone of Windows based applications, providing you a platform that connects you to definitely the world. Graphical implementation can now be come to a new level with flawless 3d transitions, grids, menus and transforms. The joy of data visualization is on the verge of revolution and wpf tools will be the step to making the longer term yours. What you need are proper designer based tools to help you unleash your potential. A wide range of different wpf controls are for sale to the needs you have. From rendering 3D effects to delivering lossless vector based graphics, the controls is needed you map your universe. You can now back your claims with impressive chart styling tools. Photos, audios and videos can all come alive with proper controls, making people live your thinking. In case you create the right interfaces, you are able to give each application a breath of latest life. The target on wpf isn't to provide some high technical specifications with an existing system. Many experts have created to help people evolve for the future. It is possible to shape your virtual destiny with such tools that dictate the very way you appear at things. As you go along after dark data binding, hyper panels and text boxes, you're transported in to a realm of creations. It's a world which each and every user can adjust, personalize and recreate determined by their choices. People share their whole world with the web, forums and social network. Anyone can engage them in a rich, visual experience that would transform their text alerts to slice of life experiences. With proper silverlight development tools, you may earn new spaces for sharing special moments using animation, photos and audio. Such tools will help you unite people at each phase with their life using an integration of desktop, notebook and traveling with a laptop. Whether you are thinking about creating another cinematic blockbuster or desire to impress people, Silverlight is the life force of the ideas and dreams. You can find unlimited scopes of creating magic by using these tools and platforms at the reach of one's fingertips. Be simple notion of shoot, share and connect may be changed into a virtual social hub. You could layer worlds within the other person, streamlining an individual experience compared to that of true to life. If you are using the Silverlight components to produce new user based interfaces, you might give applications another identity. Each day could add new dimensions and elements to modern computing, as users can personalize using the applications to make virtual bonds. It might become like true to life, only better. Together with the strength of wpf components and Silverlight components within your hand, you have a chance to alter the pulse of your computing universe. For more details about historical trending for WPF explore our web page.
0 notes
Photo
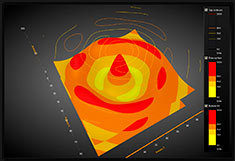
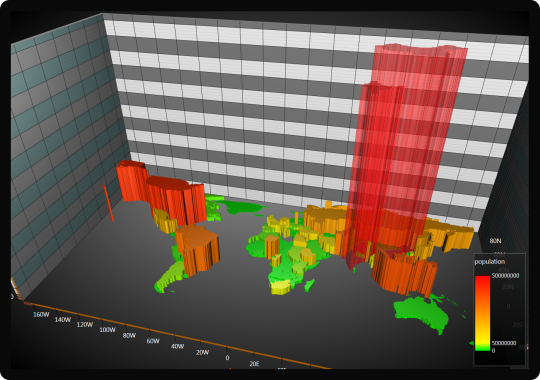
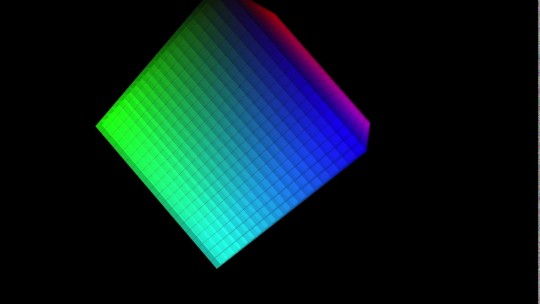
Three dimensional graphical systems are the most effective and the easiest way to visualize different types on information. The 3d wpf charts basically works on the base of two dimensional charts and just make the data on the chart more comfortable, informative and moving to the users.
#wpf 3d chart#wpf chart#wpf charts#fast wpf chart#best wpf chart#wpf charting#wpf chart example#best wpf charts#fastest wpf chart#wpf chart control#wpf chart examples#wpf graph control#wpf 3d surface chart#wpf charting control#3d wpf chart#wpf graph
1 note
·
View note
Text
A Detailed Comparison on LightningChart .NET Charting Components
Original Source: https://arctionltd.blogspot.com/2021/02/a-detailed-comparison-on-lightningchart.html
Arction has developed sophisticated charting library for both JavaScript and .NET based applications. For .NET applications, developers should use LightningChart .NET. On the other hand, LightningCharts JS is the charting library for the JavaScript app developers. Our charting library comes with arrays of features and versatile charting options. With LightningChart, you can create 2D and 3D charts. You can find appropriate charts for different applications. There are charts for trading applications. There are charts from other industries like science, engineering, banking, finance, etc.
Charting Performance Comparison
Arction is one of the leading developers for charting libraries. Our charting library LightningChart has been used by thousands of developers. They have appreciated the product for its rapid performance, features, personalization options, etc. At Arction, we focus on the development of high performance and feature-rich charting library. For an advanced charting library, performance comparison has been regarded as an important thing. We have participated in various performance comparisons with LightningChart. At Arction, we have noted high downloads of LightningChart by our competitors. It suggests that LightningCharts has emerged as the benchmark for the charting libraries.
Observations from Performance Comparison
So, what are our observations through performance comparison of LightningChart? It concludes that our charting library has been considered as a standard charting library by the competitors. They analyze various features of LightningChart, and replicate the features and performance. Arction has also obtained the following observations through performance comparison.

We have noted that large data set rendering performance of LightningCharts is 37200% better than the other similar charting libraries available in the market.
On the other hand, real-time rendering capacity of LightningCharts is almost 2300000% better than the average performance of the other charting libraries.
Such observations clearly tell that LightningChart is one of the most fast-performing charting libraries. Hence, there is no wonder that many developers love using our charting library for their application development projects.
How the Observations above Can Help Developers?
The observations from the performance comparison have significant meaning for the developers. A developer searches for a charting library that offers flawless performance. The observations listed above will encourage the developers to choose LightningChart. Here is how LightningChart can help the developers:
Using LightningChart will ensure better user-experience of an application. Charts will perform flawlessly. Rendering will be seamless. Hence, user-experience will be commendable with LightningChart.
Customer satisfaction will increase, when an application comes with high-end user experience. Using LightningChart for integrating the charts to your apps will fetch immense customer satisfaction.
An application will be commercially successful due to the presence of the high performing charts. For example, a trading application can enhance the conversion rate through providing high-quality and seamless performing charts.
LightningChart vs. SciChart
In 2016, there was a performance comparison between SciChart and LightningChart, made by SciChart. In this comparison, we had found that LightningCharts is 12500x faster than SciChart. At the beginning of the comparison, SciChart had claimed that they are 8x faster than LightningChart. In reality, LightningChart went miles ahead in terms of performance in comparison with SciChart.
WPF Chart Benchmark
This benchmark test was conducted in the year of 2013. In this test, LightningChart was tested for its WPF performance. The comparison was done between LightningChart and other .NET WPF charting controls. A benchmark application was developed. The application turns out flawless and high performing.
WinForms Chart Benchmark
In 2010, another similar performance comparison was conducted. LightningCharts was compared with other WinForms charting controls. The result of the test suggests that LightningChart is a high performing and cost-effective charting control.

All these comparisons and tests suggest that LightningChart is a leading charting library for the developers. Arction has developer LightningChart for both .NET framework and JavaScript applications. You can use the charting control based on your project requirements. Application developers can create flawless and top-notch performing applications with our LightningChart. Arction has a team of dedicated developers. We put consistently efforts to upgrade and update existing versions of LightningChart. Nevertheless, we also provide satisfactory customer support service to the developers. If you are facing any issues with LightningChart, you can contact us anytime for guidance on getting rid of technical issues.
0 notes
Text
What Are the New Features of LightningChart .NET V.10.0?
Original Source: https://arctionltd.blogspot.com/2021/01/what-are-new-features-of-lightningchart.html
Web developers have to incorporate graphs and charts on their web development projects. Using graphs and charts can help the data to be represented in a flawless manner. It helps the readers to interpret complex data in a simpler way. For adding charts and graphs, developers use professional charting library. If you want .NET charting library, LightningChart .NET is an excellent product for you. Developed by Arction, this charting library for .NET has hundreds of interactive charts to offer. At Arction, we have developed this charting library to support many demanding industries including engineering, finance, science, commerce, space, energy, defense, etc.
Features of LightningChart .NET
LightningChart comes with many useful features for the developers. It offers high performance, which makes the web development projects seamless and satisfactory for the clientele. Being a cost-effective platform, it helps the developers to earn better revenue through their projects. Another notable feature is the availability of 2D and 3D charts in the charting library. Along with 2D charts, demand is rising for 3D charts. We have developed LightningChart to offer fully customization to the users. Along with these features, the new version of the LightningChart comes with many new things in offering. So, what are the new features with LightningChart .NET V.10.0? You can find the answer in the following section.

What New We Offer?
Our LightningChart .NET V.10.0 comes with a few new things to offer to the users. LightningChart is available for both the WPF and WinForms applications. There are no differences in the features between WPF and WinForms charting controls. With the new version, we have made various improvements. Some of those improvements can be noted in the following section of this article.

UWP Platform
The major improvement with the new version of LightningChart is the support UWP platform. You can integrate our charting library to your UWP applications. It makes the process easier to create Microsoft Windows 10 based applications. You can create advanced charting applications for desktops, mobiles, Windows IoT devices, and XBOX. Not only different applications for different systems, but you can also develop different types of charts with our new version of LightningChart charting library. For example, you can build charts like 3D, 2D, Polar, Pie Charts, etc.
Faster Multiple 2D Series
With the new version of LightningChart, you can note many other improvements. Among those improvements, you can notice the faster performance for the multiple 2D series. Charting applications for multiple 2D series may become sluggish in performance. Hence, developers need charting controls that work faster. We have realized the demand of the modern-day developers, and thus we have turned the version 10 of LightningChart faster for dealing with multiple 2D series. Compared to LineCollection and PointLineSeries, our LighteningChart V.10.0 can deliver two to four times faster performance. For turning the API clearer, we have omitted all the obsolete properties and methods.
Improved Interactive Examples
We make endless efforts to provide improved interactive examples to users. With these improvements, developers can understand the crucial features LightningChart. They can easily extract example code projects. Addition of more examples makes things simpler for the new developers. These examples help the developers to learn the process of using charting libraries to create application with charts and graphs. For the new UWP platform, we have added 30 interactive examples. Many WPF projects were already there, and we have added some more interactive examples for WPF projects to help the developers. Browsing various examples has turned easier with the improved search function.
Built-in Functionalities
We have developed exclusive trader charts so that developers can create trading applications with ease. For making things even more convenient for them, trader charts come with built-in functionalities which include data cursors, color themes, data values, auto removal of non-trading time period, and many more. We have also introduced technical indicators for the trading charts, and these indicators can calculate data automatically based on the input parameters.
We are committed to add more improvements to LightningChart based on the feedback of the developers. Lightningfast performance and GPU-accelerated rendering are the features that developers will attain with our newly improved LightningChart .NET V.10.0. For support and more information, you can contact us anytime at Arction.
0 notes
Audio
With our amazing WPF Charts, You get full DirectX hardware acceleration, superior 2D and 3D rendering performance and real-time Line data Charts monitoring optimization. https://www.arction.com/wpf-chart/
0 notes
Text
Creating Charts Through C# using WPF
lot of people want their application to include various graphic elements that enhance the overall look and functionality of the application. This is mostly because of the reason that graphical elements do make the application much better and interesting. They have the ability to provide better assistance through the application and fulfill the requirements of the client. The major thing that is responsible for creating graphical elements in the application is WPF(windows presentation foundation). It works with a lot of programming languages to provide better graphical elements that help in displaying the information in a better way. The majority of the people use C# charts WPF to provide better chart data through the application.
About c# and charts via WPF
C# is basically a computer programming language that enables the user to create various applications and many more things through the coding of c#. It has various libraries that have different methods, which are further used while developing an application. Hence, an amazing bunch of features are provided by the c# language. There was a time when it was one of the most trending programming languages out there. Later it was replaced by different programming languages but it is still considered as one of the best programming languages of its time.
WPF (windows presentation foundation) is one of the best ways through which a person can add graphics to the application. It consists of various library elements or methods that further helps in creating a better application. It uses charts and many other graphic elements that make the application work well. The charts in WPF are majorly used to add the data in the form of a chart that can be either a bar chart or pie chart. It is the choice of the developer or the requirement of the client according to which a certain chart is added to the application or software.
Types of chart in WPF
The following are the list of various charts that are provided by the WPF:-
1. Mountain chart
2. Bar chart
3. Line chart
4. Plot chart
5. Bubble chart
6. Polygon chart
7. Column chart
8. 3D surface chart
9. Scatter chart
10. Polar chart
11. Smith chart
12. OHLC chart
These charts can be made through the WPF and can be embedded with c# programming language. Thus, it is quite amazing how this thing goes hand in hand and brings great outcomes as a well-designed application.
Working between c# and WPF
The c# and WPF both can work with another to provide a better application that has much better functionality. This is majorly done during the development process of the application. It is while writing the code when the WPF is linked to the C#. All the library functions, methods, and elements can be utilized in the c# language to create a much better application that works according to the need of the client.
0 notes
Photo

With our amazing WPF Charts, You get full DirectX hardware acceleration, superior 2D and 3D rendering performance and real-time Line data Charts monitoring optimization.
0 notes
Text
What are WPF and WPF Charting Controls?
Original Source : https://arctionltd.blogspot.com/2020/02/what-are-wpf-and-wpf-charting-controls.html
Many people are working in the professional world. Therefore, a lot of people require software that help them in getting their work done in an efficient manner. Therefore, WPF was designed to bring better working in the profession. The word WPF stands for Windows Presentation Foundation. It is used by a lot of people and enables various features and benefits. It considered as an effective way of linking things in an application or software. It is one of the most advanced ways of bringing better functionality to windows applications.
WPF (windows presentation foundation)
Windows presentation foundation helps in rendering the user interface components for different applications. It is very much similar to the windows forms with a very slight difference. It is also a part of the .Net framework. Thus, windows presentation foundation (WPF) brings all the user interface tools and methods that help in making a certain information or things look much better and provide accurate functionality. It helps in enhancing the application. The windows presentation foundation also provides you the facility to create a quality application that works very well and brings out the best from the application. It is such a great way of handling the entire framework of .Net And build applications that have a great user interface and work very much efficient. The WPF charting controls are very much useful while developing an application, to visualize data.
Features of WPF(windows presentation foundation)

The following are the various features of WPF(windows presentation framework):-
1. Direct 3D
This feature helps in making better 3D art as it is responsible for providing better graphics or images, but has handicaps: built in System.Windows. Media graphics interface is not efficient in performance. Therefore, low-level DirectX rendering attached with WPF gives the optimal performance.
2. Data binding
It also helps a lot in binding the data and properties.
3. Media service
It is very much efficient in providing media services.
4. Templates
It has many templates that help in displaying the information through the application in an efficient manner.
5. Animations
This allows the WPF to explore the possibility of providing animated graphics.
6. Imaging and effects
It is also very much useful in adding effects to the various graphical components.
7. Documentation
It involves the proper arrangement of the data in an effective way.
8. Text facility
You can make the text more appealing through the various graphical attributes of the WPF.
9. Alternative input
It is quite amazing how the alternative input works in the WPF.
10. Interoperability
It provides the feature to make the application work in a flexible way on various devices.
11. Accessibility
It has all the working and management done in a productive and efficient manner.
Thus, all these features make the website and other applications handle the work well. WPF (windows presentation foundation) involves all the various graphic elements and binds them together to bring out the best Wpf Charts Library. It creates good quality applications that are used by various people. It enables the developer to make such an application that satisfies all the needs of the client.
#Wpf Chart Control#Wpf Line Charts#Wpf Charts#Wpf Charting Controls#Winforms Graphs#Web Charts Library#Wpf Charts Library#Javascript Charting Components#Uwp Charts#Webgl Charts Library
0 notes
Text
Volumetric Visualization with analysing the non-proportional objects
Original Source: https://arctionltd.blogspot.com/2019/12/volumetric-visualization-with-analysing.html
Volumes are very common in the factory. The importance of this type of database can greatly enhance the evolution of the 3D data mining industry and the opportunity to create more in-depth reviews of the current operating system through its operating browser. General Chat Chat Lounge The list of facts can be captured by various scientists, or concession. Volumetric Visualization can also be caused by bodily stimuli such as the " Volumetric Visualization force" or the nervous system.
Information technologies
Complex technologies have shown that volume information plays an important role in medicine. It is used for the screening, aviation and treatment planning of advanced cancer. This type of data is also very important in analysing the non-proportional objects of the computer or ultrasound daily. Geopism surveys can also create large three-dimensional databases. Volumes containing volume data.
The voxel is the core of the sound. It can be represented as a point in the 3D space that is a specific shape and color. Volumetric Visualization provides the ability to maintain six scalar values. In general, the data has a fixed grid so that the height can be saved as a data table. In these cases, the entire time can be saved as a multi-list, and alt data can be presented as a * .csv file in your home storage. However, the database is usually split into smaller sections and each packet is saved as a bitmap image.
advanced algorithm
This method is possible thanks to an advanced algorithm to reduce the sample size that is used in the images. WPF Data Visualization RF provides the best tools for data mapping. A VPF lightning scheme can make visual data processing easy and fast: All tools can be integrated into a project using Microsoft Visual Studio tools, KSAML or code tracking. Control for creating VPF data is quickly becoming an integral part of Windows performance for desktops, and Lightning Chart is the best choice for this purpose. Volumetric Visualization and Data Visualization using the Lodging Chart is the fastest industrial graphics solution, with low-level patented Directs rendering technology and complete automation performance. With the release of the pillow, the strength of the leak is not an obstacle but an advantage. VPF lifting hart presents the following images: line chart, bar chart, bar chart, 3D chart, marginal chart, hot chart, chart area, polar chart, pie chart, and wax stock chart, as well as interactive and interactive graphics.
Wpf Data Visualization
Wpf Data Visualization allows you to create data on a random map of geographical maps as well as online and offline links. The Ultimate SDK Lighting Scheme is a VPF licensing scheme and an easy-to-use and fast VPF, with many maps and lighting, along with illustrations of countries with financial data, business dashboards, engineering, and complex 3D scenes. In the form of market data control! Data generation uses statistical graphics, charts, information graphics, and other tools to efficiently clean and communicates information. Wpf Data Visualization is the Numbers will be coded to deliver specific messages using numbers, rows, or columns. effectively helps consumers to analyze and corroborate data and evidence.
Big Data Support
Makes comprehensive data more accessible, understandable and usable. Consumers will have specific analytical functions, such as comparing or understanding the reason and illustrating the principles of graphical principles (e.g., tours or shows). Tables are typically used where user-specific measurements are visible, while different types of tables are used to display data and relationship relationships for one or more variables. Electrical Features: The GPU is fully powered up Set up real-time track tracking Big Data Set Support Audio / input segments are included Full multivariate contact compatibility Excellent 2D and 3D rendering performance
0 notes
Text
Different types of charts used in stock trading
Original Source: https://arctionltd.blogspot.com/2019/12/different-types-of-charts-used-in-stock.html
Charts are one of the most popular methods for making any decision relating to stock trading. However, it is important to understand how you should use them so that you can reach your objectives.
Charts would be available to you in several different ways:
1. Online third party developed free chart applications
2. Paid charting software
3. Broker web pages that display charts
4. Charts which have 3D Chart Control.
Investment programs which use charts
The main challenge that charts have are the specific chart settings. A lot of online sources will have the basic default settings. The important thing to notice is in using the charts, no matter what the source, is in configuring the charts and meeting your requirements. The main objective would be to use charts so that one wonders when one should sell, hold or even buy new stocks. This will seem to be simple but the signals must reflect the specific objectives to stimulate growth.
For instance, if you see the C# Chart WPF then you will see there are two lines with a fast average line which shows the average prices that is calculated in a short period of time. Along with this there is a slow average line which means the average prices that is calculated on a longer period of time.
What happens when the conventional evaluations take place?
The conventional evaluations of the moving average charts are such that when the price lines are cutting down then both fast and the slow line would be showing that it is selling signal. In addition to this when the prices go through both lines then there it would be a complete buy signal. If it is towards the middle then a watch signal would be shown when it would have been more prudent for holding the stock.
How often would you want to do the trading? Monthly and rarely trading:
If there is a daily or weekly trading then it can result in creating a lot of trades on a monthly bases and as a result of this it will help in diminishing a lot of losses.
For instance, there can be seen another functionality in the JavaScript generated charts like showing the buy, hold and sell signals. These charts are 3 Dimensional and they will show on three lines, the average price lines which are calculated with two types of moving averages on two lines and along with a trigger line on the third line. If the average price lines cross the trigger line then the signals would be generated.
In general you will be able to use the C# Chart WPF with added 3D Chart Control and see more functionality. For instance, when the prices of several things cut up and are in the bottom part of the charts then there would be new signals for selling. Similarly, if the price lines improve then the charts will reflect the data in the “watch” zone. These aspects will surely help people in more accurate stock trading.
Conclusion
In conclusion, it will be crucial to understand that dynamic and new charts would help in making stock trading more accurate and precise.
0 notes
Audio
With our amazing WPF Charts, You get full DirectX hardware acceleration, superior 2D and 3D rendering performance and real-time Line data Charts monitoring. Get More Information: https://www.arction.com/wpf-chart/
0 notes
Audio
With our amazing WPF Charts, You get full DirectX hardware acceleration, superior 2D and 3D rendering performance and real-time Line data Charts monitoring optimization.
0 notes
Audio
With our WPF Charts Control, You get full DirectX hardware acceleration, superior 2D and 3D rendering performance and real-time data monitoring optimization for WPF Scientific Charts.
0 notes
Text
C# Charts WPF Can Take Your Project To The Next Level
Original Source: https://arctionltd.blogspot.com/2020/03/c-charts-wpf-can-take-your-project-to.html
What is a Chart?
A chart is a visual representation of data. Gone are the days where one would have to physically input every piece of information that they want to feed into their chart. With the current technology available, one can easily input large amounts of information to make visually appealing charts quickly – and yet have fast runtime rendering.
What Are The Aspects That Must Be Kept In Mind Before Choosing The Right Platform For Your Charts?
Many aspects must be considered before choosing the right toolkit for your visually appealing chart that you are planning to make! Some of the most important factors to be considered are as follows:
Visual appeal: The type of chart that you are planning to use can make a big difference in the type of toolkit that you are planning to utilize. For instance, the end finish of a Bar Graph may be much more sophisticated and polished in certain types of toolkits as opposed to certain others. However, with C# Charts WPF, you can be assured that your charts come out looking posh and finished every single time.
Features: the chart toolkit must provide the visualization you are expecting, or to be easily created with the API. Heatmaps, 3D surfaces etc. are industry expectations today.
Configurability: the charts must have great set of configuration attributes (properties) to adjust the behaviour and the looks of the charts.
Performance: most chart toolkits have enough power for simple business-related power, but more advanced scientific, engineering or financial applications typically need a performance-oriented chart toolkit.
Getting a C# toolkit
Recommeded way is to Download a C# charts toolkit from C# Charts manufacturer web site, and install it. Then you will find charts in the Toolbox of Visual Studio. Alternatively you may want to use Nuget and browse the preferred C# Charts there, but note the examples and documentation are not typically available without going accessing them from manufacturer’s web site.
Why Chart?
Charting is ideal as it allows the creator to render and input a large amount of information in the form of visual representations. Especially for those projects that require the immediate attention of the reader, this is an ideal and present solution. It has been proven that visually attractive projects and pages are more likely to receive positive attention compared to those which uses large amounts of verbose data.
0 notes
Audio
With our WPF Charts Control, You get full DirectX hardware acceleration, superior 2D and 3D rendering performance and real-time data monitoring optimization for WPF Scientific Charts.
0 notes