#$ACWI
Explore tagged Tumblr posts
Visit Tumblr Blog
Explore Tumblr blogs with no restrictions, modern design and the best experience.
Last Seen Tumblr Blogs


Fun Fact
In 2020, Tumblr had 29.4 million users in the US.
Text
Protégé Partners: These factors ‘wreaked havoc’ in our bet against Buffett

Warren Buffett is trouncing Protégé Partners in a wager over whether hedge-fund management can provide better returns than a passive strategy. Now, Protégé and its co-founder Ted Seides are seeking vindication.
The duo laid out their opposing theses in 2008: Buffett said investors are best served over long time horizons with investing in low-cost index funds that track the broad markets as opposed to paying substantial management fees, active trading costs and so on. Protégé Partners, which invests in small hedge funds, countered that a more aggressive, and expensive, strategy would pay off.
To raise the stakes, Buffett and New York-based Protégé agreed the loser would give a charity of the winner’s choice $1 million based on whose strategy provided better returns over the course of a decade. Through a serendipitous chain of financial events, the winning charity actually stands to glean closer to $1.68 million.
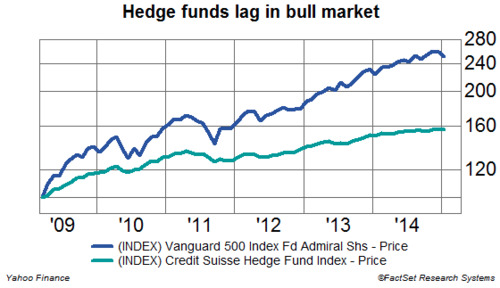
To say the Oracle of Omaha is winning the bet puts it lightly. Buffett’s cumulative return in the Vanguard 500 Index Fund Admiral Shares (VFIAX) is 63.5% over seven years, or 7.3% per year (the figures don’t sum due to compounding). Meanwhile, Protégé’s pick of five anonymous funds of hedge funds has returned a relatively paltry 19.6%, or 2.6% per year (the numbers are subject to change because the 2014 figures are still trickling in).
Santoli: Cry me a river that leads to Omaha
The lackluster performance isn’t limited to Protégé’s picks – the once vaunted hedge fund industry at large has broadly lagged its more mainstream, and less costly, peers since the bull market began in March 2009.
Protégé defended its business in a note written by Seides Thursday on the Yahoo Finance Contributors Network, saying, “We believe that those extrapolating the recent past to call for the demise of the hedge fund industry are probably a bit extreme.”
Blame it on … the Fed, S&P 500?
The firm, which was founded in 2002 by Jeffrey Tarrant and Seides, said management and performance fees accounted for 24.4% of the underperformance – representing just north of half of the overall gap of 43.9%. The other 19.5% came from two more surprising sources.
“We believe the headwinds faced by hedge funds have resulted from a combination of the substantial outperformance of the S&P 500 over global equity markets and the adverse impact of the Fed’s Zero Interest Rate Policy ... on hedge funds relative to other investment vehicles,” Protégé said in the note.
“Together these factors wreaked havoc on a bet whose prospects we initially felt quite confident.”
Digging into the details, Protégé said the S&P 500, an index of large capitalization U.S. companies, isn’t a fair benchmark for hedge funds that tend to diversify globally and have a bias toward small cap. stocks, calling it an “apples-to-oranges comparison.” Indeed, Protégé said its performance has essentially matched the MSCI ACWI, a much broader index that tracks roughly 85% of global investable equities.
Protégé’s funds also took on about half the risk of the Vanguard fund, which only wins if the market goes up. Unfortunately for Protégé, its funds were only about 40%-60% net long during a period in which stocks have been on the rise (save for 2008).
Protégé blames the rest of its plight on the Federal Reserve, which has kept short-term interest rates near zero since 2008 in its bid counter the worst financial crisis since the Great Depression. The central bank has also unleashed numerous rounds of bond purchases to put pressure on longer-term rates.
“The absolute level of interest rates has a direct effect on hedge fund returns,” Protégé said, adding, “we believe the Fed has had a dramatic impact on lowering hedge fund returns over the last six years.”
Vanguard’s fund, by its very nature, is always fully invested in equities. Not so for hedge funds. In fact, Protégé said funds generally keep between 0% and 90% of their net assets in cash, depending on the strategy they’re utilizing. With extremely low short-term rates, the funds don’t earn much on their cash holdings, giving the index fund yet another leg up.
Hedge funds also frequently employ a strategy called ��shorting” stocks, a bet the issue will decline in value. In order to make that trade, the fund must borrow shares from what’s called a beneficial owner with the help of an investment bank. The beneficial owner receives cash collateral from the borrower, for which it pays the borrower interest.
In order to make a profit, the owner reinvests the cash at a higher interest rate. Low short-term rates, plus increased scrutiny, have left lenders in a position where they end up making less profit on the transaction. To bolster their own returns, Protégé said, the lender is now paying the borrower lower rates on collateral. That trend, along with others in the securities lending space, has been painful for many funds.
Overall, the expected shortfall given the wonky market environment and fees over the period was 70.6%, according to Protégé’s calculation. That makes the actual 43.9% underperformance a bit more palatable, and leaves the residual return a tad higher than the management fees.
“If the bet continues on its course, there’s always the next ten years,” Protégé said in conclusion. “We happen to know firsthand that Warren couldn’t be more excited to watch that period unfold.”
Top Image: Reuters
19 notes
·
View notes
Text
Sticking to a long-term strategy in a short-term world
CNBC asked me to participate in a program called the Platinum Portfolio, in which each manager was asked to come on Squawk Box in the spring with three stocks they thought would do well over the next year. I happily accepted the invitation – and picked my stocks in April. I participated in my second interview on Monday – the official checkpoint on the performance of my picks. Spoiler alert: the interview drove home the very nature of our time-tested, long-term approach to investing.
Let’s take a step back for some context here. My whole investment view is that you buy the shares that score the best on our various factor composites, (Value; Earnings Quality; Financial Strength and dividend yield).
To build a Global High Dividend Yield portfolio, we look for stocks that:
are cheap, based upon our value composite;
have good earnings quality, i.e., their books are clean and their account practices are sound;
have good Financial Strength, or the ability to continue to pay a good dividend.
We then buy all the stocks from this group paying the highest dividend yields. Since we run our screens once a month, a stock that continues to meet our criteria gets a larger weight in the portfolio, as its multiple appearances in the screens add to our conviction that they should be among the better performers in the portfolio as a whole. So we end up with a concentrated, conviction-weighted portfolio.
Now, back to my Platinum Portfolio segment.
The three stocks I focused on for CNBC’s Platinum Portfolio are:
Canadian Oil Sands Ltd ($COSWF), which has a market cap of $8.7 Billion; a dividend yield of 7.14% and is cheaper than 68% of the stocks in our Large Stocks Universe based on our value composite.
Ecopetrol SA ($EC), which has a market cap of $64 Billion; a dividend yield of 7.55% and is cheaper than 81% of the stocks in our Large Stocks Universe based on our value composite.
Telefonica Brasil ($VIV), which has a market cap of $14.1 Billion; a dividend yield of 3.95% and is cheaper than 93% of the stocks in our Large Stocks Universe based on our value composite.
So far, so good.
Wait. Not so fast. At the time of segment earlier this week, the three stocks were down on average 6.42% since I debuted them in April, whereas the MSCI ACWI ($ACWI) was up 4.61% over the same period. (We use the ACWI because all three names are non-U.S. companies.) So, the question becomes, do we keep these names or switch to better names? It’s a natural question – and one that gets at the very heart of my investment view: look long term. Because if we as investors let the short-term drive us, the results will be predictably bad. And I passionately believe the only way to have long-term success investing in equities is to have a rules-based buy and sell discipline.
Don’t listen to your gut
I can’t imagine how someone who isn’t using a rules-based process could handle having three of their picks down when the market is up. The stress of making gut decisions must be killer. But I think the long-term results of making gut decisions in investing is overwhelmingly negative. According to a study by Dalbar, for the 30 years ending in 2013, the average equity fund investor earned just 3.69% a year versus a total return for the S&P 500 ($SPX) of 11.11% per year! Indeed, the average equity fund investor would have been better off leaving their money in U.S. T-Bills, which earned 4. 01% a year over the same period. What’s worse, Dalbar said that “attempts to correct irrational investor behavior through education have been futile.” (Story here.)
The whole point of quantitative investing is to use a strategy that has done very well over the long-term and has a very high base rate of beating its appropriate benchmark. But another benefit of using a strategy tested over the long-term is knowing going into it that you will have a failure rate. If a strategy has a 70% annual base rate for beating its benchmark, you know that you will underperform the benchmark in three of every 10 years. Conventional investors would never buy a stock that they thought was going to go down, whereas we quants place all of our faith in the probabilities – not possibilities – of success, and accept willingly that we’ll have our share of losers.
Now, I have no idea how the three stocks I selected will end up doing when they reach the one-year mark (we use an annual rebalancing method), but I do know what the odds of our strategy of buying cheap, high-quality global stocks are—high. Without the discipline of our automated buy and sell rules, I am quite sure that I would behave just as emotionally as the next guy. But my experience on Squawk Box really drives home the difficulty conventional investors must face in trying to achieve long-term success in a short-term world.
Finally, if an investor can’t embrace a quantitative, rules-based investment strategy, my recommendation is simple—put your money in an index fund and remove the stress and uncertainty that all of the short-term news throws your way.
12 notes
·
View notes
Text
Why You Should Ignore Expert Predictions About The Stock Market

You should ignore experts making predictions, you should avoid making predictions of your own, and you should definitely avoid any investment decision that is predicated on a subjective prediction. Predictions are everywhere in investing (price targets, GDP forecasts, S&P 500 earnings, EPS estimates, and so on), but they are usually worthless. This is especially important to remember when there are headlines like today's "S&P 3,000."
Our brains evolved to recognize patterns, which creates the side effect that we are pattern junkies. Whenever we see two of something, we automatically expect a third. This pattern-addiction makes us obsessed with the future. We usually turn to experts for predictions about the future, and the stock market is chock full of more forecasts than any other arena of interest or speculation. But the evidence below shows that economic and market forecasts are crap: in most cases you may as well flip a coin. I’ll explain why instead of relying on expert predictions, you should do your own research, focus on process, and always stick to your strategy.
Why We Love Experts
Experts are surrogate thinkers. They do the thinking so you don’t have to! We love experts because they allow us to outsource our thinking but also because of the psychological bias known as the “halo” effect. The better known, more intelligent, better looking, or more respected an expert forecaster is, the greater the confidence we have in their predictions.
So what is the record of expert forecasters? The most comprehensive study on the topic was conducted by Philip Tetlock, whose book Expert Political Judgment is a must read. In the book, he assesses 28,000 forecasts made by hundreds of experts in a variety of different fields. He finds their abilities lackluster:
These results plunk human forecasters into an unflattering spot along the performance continuum, distressingly closer to the chimp than to the formal statistical models. Moreover, the results cannot be dismissed as aberrations…Surveying these scores across regions, time periods, and outcome variables, we find support for one of the strongest debunking predictions: it is impossible to find any domain in which humans clearly outperformed crude extrapolation algorithms, less still sophisticated statistical ones. (my emphasis)
A similar study was conducted specifically for investing/market forecasts. The CXO Advisory group gathered 6,582 predictions from 68 different investing gurus made between 1998 and 2012, and tracked the results of those predictions. There were some very well-known names in the sample, but the average guru accuracy was just 47%--worse than a coin toss. Of the 68 gurus, 42 had accuracy scores below 50%.
Another study of analyst estimates conducted by David Dreman showed that across 400,000 different estimates, the average error was 43%! (It is interesting to note that Dreman was was of the "gurus" from the CXO study--but he was the 5th best overall with an accuracy of 64%).
Back to Tetlock’s study, which uncovered one variable that did effect whether the expert was more or less accurate:
It made virtually no difference whether participants had doctorates, whether they were economists, political scientists, journalists, or historians, whether they had policy experience or access to classified information, or whether they had logged many or few years of experience in their chosen line of work. The only consistent predictor was, ironically, fame, as indexed by a Google count: better-known forecasters—those more likely to be fêted by the media—were less well calibrated than their lower-profile colleagues.
The problem isn’t that these experts are dumb—indeed, they are usually very smart. The problem is that it is nearly impossible to predict outcomes in complex, adaptive systems like the stock market or the economy. J.P. Morgan (the original) had the only appropriate and accurate market forecast: “it will fluctuate.”
A Forecast Free Investing Process
Instead of basing your investment decisions on subjective forecasts, base them on simple rules or models. Many people don’t like models because they are impersonal and “backward looking.” We want insight and prediction; models just spit out an answer. Of course models aren’t perfect, but they can be really helpful.
Simple models almost always beat experts. They are consistent, data driven, and easy to apply. From wine prices (Orley Ashenfelter), to political elections (Nate Silver) to individual stock returns—models work; and they use information that is already available instead of relying on forecasts about the future.
Ben Graham was the father of investing models—his checklists for the defensive and enterprising investor were decades ahead of their time. Similar systematic approaches are gaining popularity in the form of smart/strategic/advanced beta. These tend to be watered down applications of great ideas like value, momentum, or quality, but they can be a good start. The key with a modeling approach is to be consistent and stick with it. It is always most tempting to abandon a model when it’s suffering through an inevitable period of underperformance—but that is the worst time to leave (think of a value strategy in 1999).
Quants are the heaviest model users, but the important point here is that you should have rules and a consistent process. Many of the most famous investors aren’t quants, but they often have a system: a set of rules consistently applied when buying and selling. Here are a few examples of model or rules based projections that have worked quite well for the market.
Shiller CAPE ratio (as Ben Carlson recently pointed out, CAPE is a strategic tool, not a timing tool)
GMO’s seven-year forecasts (based on simple principles like mean reversion)
Individual stock selection factors including value, momentum, yield, and quality
Altman’s Z score for bankruptcies
One frequent criticism of models is that using them is like driving by looking in the rear-view mirror. They only look backwards—at what has already happened—and never look forward to what will happen. But anyone making this objection is planting the axiom that others can successfully look out the windshield and accurately see what is coming. The evidence above suggests otherwise.
The CAPE ratio, for example, is very “backward looking,” because it uses data from the past 10-years. One of the most common criticisms of the CAPE ratio is that 10 year old data is irrelevant in today’s market environment (“it’s different this time!”) Yet as Meb Faber has shown, a simple strategy that buys markets with the lowest CAPE ratios does very well (read this). The beauty of the CAPE model is that if forces you into terrible situations where the forecasts for the future are dire. Low CAPE ratios result from very bad news, fear, and forecasters whose consensus is that the market is going to hell (think Greece, or Russia today).
We rely on stories and circumstances when we should care more about price. The story about each cheap market is always different, but the psychology that creates each attractive market opportunity is always the same. That is why investment models like CAPE work: they prey on the mistakes of fallible human investors and don’t get caught up in trying to figure out each new, market circumstance. A CAPE ratio tells you nothing about what will happen to any given country in the future, but it identifies markets that may have been mispriced.
Ignore Experts, Think For Yourself
Jiddu Krishnamurti, a great thinker and writer, spent his life urging others to investigate things for themselves rather than rely on experts. Two passages from his book Freedom from the Known urge us to step up our game:
For centuries we have been spoon-fed by our teachers, by our authorities, by our books, our saints. We say, ‘Tell me all about it—what lies beyond the hills and the mountains and the earth?’ and we are satisfied with their descriptions, which means that we live on words and our life is shallow and empty. We are second-hand people. We have lived on what we have been told, either guided by our inclinations, our tendencies, or compelled to accept by circumstances and environment. We are the result of all kinds of influences and there is nothing new in us, nothing that we have discovered for ourselves; nothing original, pristine, clear.
Krishnamurti highlights the importance of thinking for yourself and, often, standing alone. He could have been writing about many famous investors. In the passage below, if you replace “society” with “market,” and “a comfortable spiritual life” with “strong investing results," then you’ve got yourself one fine investment philosophy!
The traditional approach is from the periphery inwards…and [yet] when at last one comes to the centre one finds there is nothing there, because one’s mind has been made incapable, dull and insensitive. Having observed this process, one asks oneself, is there not a different approach altogether—that is, is it not possible to explode from the centre? The world accepts and follows the traditional approach. The primary cause of disorder in ourselves is the seeking of reality promised by another; we mechanically follow somebody who will assure us a comfortable spiritual life [strong investment results]. It is a most extraordinary thing that although most of us are opposed to political tyranny and dictatorship, we inwardly accept the authority, the tyranny, of another to twist our minds and our way of life. So if we completely reject, not intellectually but actually, all so-called…authority, it means that we stand alone and are already in conflict with society [the market]. (my emphasis)
Standing in conflict with the market is hard because it means you have to fight the popular opinion, which often built by experts making forecasts. But there is no evidence that expert opinion is worth listening to. Avoid expert forecasts, do your own research, focus on process (models/rules), and stick to your strategy. These rules are a solid foundation for a good investing process.
9 notes
·
View notes
Video
youtube
Seismic Shift: What Could It Mean For Stocks?
#$VBK#$IJJ#$ACWI#$IJK#$VT#$IWV#$SCHX#$SCHF#$IWP#$IWO#$SCHB#$IWN#$SPLV#$SLV#$XLI#$TLT#$MUB#$IBB#$EZU#$VV#$IWS#$IEF#$SPY#$VOO#$XLY#$XLP#$VGT
5 notes
·
View notes
Text
Time for Concern? Equities Markets Continue Reaching All-Time Highs
February was a solid month for stocks, with gains felt broadly across theworld. The S&P jumped +5.10% on the month and as a global measure the MSCI All-Country World Index [ACWI] did even better, posting a +5.40% gain. The dragged-out fears of a Greece departure from the euro were dropped from media narratives (as predicted), oil prices bounced off lows, February delivered a very strong US jobs report, and earnings season finished on a high note with over 60% of S&P 500 companies beating expectations. And if that wasn’t enough, central banks stepped-in to give investors even more reason to line up for equities. In the past month, over 20 central banks have cut interest rates or eased monetary policy, with the most notable change coming from Europe’s implementation of quantitative easing [QE] programs. Yet, investors are still worried. With February’s strong up-move, several indices – including Germany, India, the UK, and the US – were pushed into record territories, and with every move higher the fear of a ‘market top’ grows. With the markets giving back some some of those gains to start March, some of our investors are asking: Is this a sign that the market is at (or near) a peak, with a bear lingering just ahead? Have we reached the top? Those are all fair questions, and it’s normal investor behavior to fear an ‘all-time high’ more than to celebrate it. What’s more, March 9th marked the six-year anniversary of this bull market, making it the 5th biggest and 4th longest bull market in history. In just a few months, it will pass the 1974 – 1980 bull market to become the 3rd longest. How much fight can this bull really have left? If you believe as we believe, the answer is: plenty. What Happens in the Market One Year Does Not Influence the Next Year If there’s one thing I want you to remember from this post, it is this: individual stocks and the market indices are not serially correlated. In plain speak, that means what happens one day to a stock price or an index level does not have any bearing on what happens the next day. If a stock goes up one day, it statistically has a 50% chance of going up or down the next. If there were always certainty about future direction, investors would never lose money. And we know that’s not true. The reality is, for all the ‘new record highs’ talk you’ll hear these days from commentators, it’s been about two years since the market eclipsed the 2007 peak level reached in October of that year. For two years, the market has been puncturing resistance and finding new all-time highs, over and over again. And I don’t see any reason why that can’t keep happening for the balance of the year. The Fundamentals Still Point to More Upside I can’t stress enough how important it is for investors to look at each year’s potential stock returns in a vacuum. Doing so will help you determine – in an unbiased way – if you still see value in equities and whether fundamentals point to the potential for more upside. A past years’ returns cannot and should not determine your attitude about investing in the current or even the next year. Invest for what you can see out in front of you. And here’s what that picture looks like: • Economics – Some estimates have global GDP growth coming in at 2.9% for 2015, which is better than the estimated 2.5% we saw in 2014. Zacks estimates the US will sustain a run of moderately above-trend growth of 3.0% for 2015. Read: the global economy is strengthening, not weakening. • Interest Rates – Overnight rates in most developed countries are near historic lows, meaning that borrowing costs and financing costs are highly attractive for businesses that can obtain loans. Central banks (other than the Fed) appear poised to keep rates low for the balance of the year. The issue, that still needs working on, is getting banks comfortable enough to up the ante on loan issuance. • Inflation – Zacks projects US core and headline inflation of 1.3% and 1.0%, respectively, for 2015. Europe, and even China, are also expecting inflation in the 1% - 2% range. When you couple that with improving GDP growth, you have a global economy I like to think as “Goldilocks Light.” • Sentiment – We think sentiment will continue to improve as the US consumer benefits from lower energy prices and improving employment, which could support higher spending and lower risk aversion. The same should apply to Europe as the economic picture gradually improves. Market Highs Should Inspire Reassessment, but Not Necessarily Rebalancing Reaching new highs does create a need for caution, and as valuations rise to “above average” levels it does make sense to constantly reconsider how much more upside equities could really have. But neither of those two things alone – record highs or high valuations – should inspire an investor to go defensive or keep cash out of the markets. The nature of bull markets is to reach new highs and then create new ones after that. That’s what happened in every other bull market to date, and that’s where I think we are now. So don’t be afraid of heights just yet. I think the market can go plenty higher from here.
___________________________________________________________
Past performance is no guarantee of future results. Inherent in any investment is the potential for loss.
Zacks Investment Management, Inc. is a wholly-owned subsidiary of Zacks Investment Research. Zacks Investment Management is an independent Registered Investment Advisory firm and acts an investment manager for individuals and institutions. Zacks Investment Research is a provider of earnings data and other financial data to institutions and to individuals.
This communication is for informational purposes only and nothing herein should be construed as a solicitation, recommendation or an offer to buy or sell any securities or product, and does not constitute legal or tax advice. The information contained herein has been obtained from sources believed to be reliable but we do not guarantee accuracy or completeness. Zacks Investment Management, Inc. is not engaged in rendering legal, tax, accounting or other professional services. Publication and distribution of this article is not intended to create, and the information contained herein does not constitute, an attorney- client relationship. Do not act or rely upon the information and advice given in this publication without seeking the services of competent and professional legal, tax, or accounting counsel.
5 notes
·
View notes
Text
Global Equities Stake Key Technical Ground

The global equity market had a big week, arguably overcoming key levels of technical resistance...for now.
Much of the ink in this space over the past month has dealt with the battle between the breadth and momentum thrust off of the mid-February stock market low and the imposing technical resistance on the charts of most of the major averages. Just a week ago on CNBC, in fact, we laid out the litany of resistance layers nearby on the chart of the Global Dow. Of concern, many of the former lagging segments of the market had been repelled by this resistance for 3-4 weeks and were beginning to show the appearance of rolling over again.
What a difference a week makes.
Thanks in large part to Wednesday’s burst, many U.S. and global indices have rebounded to either challenge or surmount these identified levels of resistance. Included among them is the Global Dow. This unweighted average of 150 of the world’s largest stocks was able to overcome a daunting sextet of potential layers of resistance on its chart:

A closer look:

The resistance layers that we looked at, all in the vicinity of about 2320-2360, were the following:
The underside of the broken post-2009 up trendline
The post-2015 down trendline
The 200-day simple moving average
The 200-week simple moving average
The 50% retracement of the May-February decline
The January breakdown level
As of yesterday’s close, the Global Dow was at 2367.20, above the upper end of this confluence of resistance, though not convincingly. Of course, the question now is can it stay above those former resistance levels? This will need to be monitored closely in this upcoming days.
As it stands now, score one for the breadth/momentum thrust off of the February low as the extended strength suggested by the thrust may now be manifesting itself. The move above resistance in several of the lagging market segments is a key development, and a necessary one for the extension of this rally. Couple this with the move to a new high by the NYSE Advance-Decline Line on Wednesday and it was a very good week for the bulls.
_________
Photo by Giovanni Diffidenti.
More from Dana Lyons, JLFMI and My401kPro.
The commentary included in this blog is provided for informational purposes only. It does not constitute a recommendation to invest in any specific investment product or service. Proper due diligence should be performed before investing in any investment vehicle. There is a risk of loss involved in all investments.
4 notes
·
View notes
Text
Ian Bremmer: People Are Increasingly Resistant to Globalization
Globalization is one of the most dominant yet controversial economic forces in the world today. It has been one of the leading drivers of overall global growth. Globalization is still growing, though at a slower pace.
Deglobalization forces, which roll global integration back, however, are increasing as well. We see rising concerns and a growing resistance to globalization among the public.
Think of the rise of Donald Trump and Bernie Sanders in the United States, the populist movements around the world, and the surge of Euroskepticism in Europe, just to name a few examples.
My friend Ian Bremmer, professor at New York University and founder of the Eurasia Group, is one of the foremost authorities on geopolitical trends in the world. Ian also writes a weekly letter that hits my inbox every Monday morning.
Two weeks ago, Ian wrote a very solid essay on the issues surrounding globalization.
This letter is normally seen only by his private (very high-paying) clients. But he has graciously allowed me to share it with my Outside the Box readers (subscribe here for free) and you.
I think you will find it highly informative and well worth your time.
Update on Globalization
BY IAN BREMMER
This weekend witnessed the worst mass shooting in the history of the United States. It will also surely be the most politicized. Some 50 dead at the hands of a self-declared ISIS supporter with an automatic assault weapon, in the midst of the most polarized presidential election the country has experienced in the post-war period.
The responses are divided strongly along political lines: the left focusing on gun control; the right on radical Islam. There’s no policy change coming: the act of terrorism was by all counts “homegrown” despite an ISIS pledge, and the Obama administration will avoid any politics that pushes towards further American intervention across the Middle East or a post-9/11 style Patriot Act redux at home. While domestic American lobbies against gun control are set in stone until the next election at least.
The greater impact will be on the campaign, where a large attack on the homeland plays into Donald Trump’s (temporary) “ban the Muslims” platform. Hillary Clinton’s hawkish tone on terrorism and us intervention made for a stronger statement than President Obama’s... But it’s still a bigger opening for Trump, especially since the attack, along with the recent mass killing in San Bernadino, happened on Obama’s Democratic administration’s watch. Doesn’t change my overall electoral call, where the demographics and weak GOP (political and financial) support still give Clinton a significant edge. But it will make identity politics over the course of the election – and after – far more toxic, with negative long-term consequences for both constructive political legislation and, as a consequence, market sentiment.
***
Given the short-term situation (enormous headlines, a horrible tragedy, but limited US and global impact) I’m not planning on writing this week’s update on the shooting. Rather, I’ve been spending quite a bit of time thinking about something bigger:
Globalization.
It’s single most important trend of the past half century. Simply put, the various processes by which ideas, information, people, money, goods, and services cross borders at unprecedented speed and with unprecedented depth.
Those processes are world-changing, and many of them are still accelerating. But just as the Soviet collapse didn’t bring the end of history, globalization hasn’t made the world flat. Today’s ever-smaller world still has as many peaks and valleys: more clearly visible to one another, but still every bit as sharp in relief. That in turn is creating fragmentation, as a wide variety of deglobalization trends gain currency and momentum. The two sets of forces are interlinked and yet rarely considered together. Proponents of utopia and dystopia are getting ever-louder… and talking ever more past each other.
I think it’s worth considering the arguments for both globalization and deglobalization. To stack up the most important factors on both sides of the aisle, and see where we end up.
First, let’s look at globalization:
Migration. The world is crossing borders at record speeds. International tourism receipts are increasing, on the back of a strongly growing global middle class and a steady rise in visa-free travel: above average growth for six years straight; and for the fourth year in a row, global tourism spend has grown much faster than merchandise trade. The rise of China is dominant here, with 120 million Chinese now traveling abroad every year; a trend showing no sign of slowing (interestingly, around the world, only tourism from the former Eastern bloc is significantly shrinking). It’s also developed world interest in ever-more global destinations: even North Korea’s repeated arrests of visitors has not deterred westerners from reaching as far as the hermit kingdom.
The same trend holds for international students. 2015 saw nearly 1,000,000 international students coming to the United States (by far the most important destination for higher education); a 10% year-on-year increase, and the fastest rate of growth since 1979. The rise of China again drives the trend; making up 31% of the total foreign student count (India has 14%, Korea 7%, and Saudi Arabia 6%).
Overall, international migration figures are sharply up; reaching 244 million in 2015, up 40% since the beginning of the century. 3.3% of the world’s population is composed of migrants; 50% of them come from Asia, and 2/3 of migrants live in either Asia or Europe. Not all of this travel is welcome. The fastest recent migration growth has been in refugees – generally forced by climate change and/or conflict, and creating the biggest refugee crisis since World War II. 1 in 122 individuals on earth has been forcibly displaced, for a total of 60 million people. That in turn creates the potential for greater and faster contagion of externalities such as terrorism and disease – the latest illustration of which being the rapid spread of the Zika virus (prompting a realization that normal tourism flows make postponing the Olympics of little use; very much an illustration of our points here on the tension between globalization and deglobalization).
There’s pushback to all this moving around. Some as a consequence of the refugee flows: walls being built, tougher border checks – leading to freedom of movement being curtailed. That’s been easiest to accomplish in areas where borders are well guarded – most notably Europe in response to the refugee crisis, with what’s amounted to a de facto suspension of the Schengen agreement – while across the Middle East and in Sub-Saharan Africa there’s been little effective policy response to growing northbound flows.
Open borders are also being filtered by growing interstate conflict. Take the tourism ban between Russia and Turkey. Iran and Saudi Arabia have cut off direct travel and restricted use of each other’s airspace; most significantly with the Iranian government forbidding its citizens from traveling to Saudi Arabia for the hajj. And, finally, there’s been some enforcement of travel restrictions out of broader stability concerns from authoritarian regimes; with Russia and China implementing restrictions on government and public sector international travel – an effort to maintain loyalty and control. But these are outliers. Overall, vastly more people are moving across borders. Freedom of the seas and air travel continues to be largely unfettered. On balance, the impact of these trends has been unprecedented internationalization of ideas and culture – a strong factor for continued globalization.
Communications. The communications revolution has made it easier for people of all walks of life and every corner of the world to be in touch with one another. Smart phone and internet penetration now stands at nearly 50% of the entire world population, and infrastructure improvements should continue to increase those rates in the coming decade. And, as anybody reading this knows, it’s a life changing technology, a real-time and near-completely immersive default connection of citizens to the rest of the world. Virtual networks have become a critical component – and, for many, the defining component – of personal identity.
To effectively restrict communication, governments would need to dominate technologies whose forced control is a double-edged sword – when social instability spikes, internet shutdowns work at best sporadically and risk leading to greater discontent and violence. Enterprising citizens and new technologies quickly find workarounds. Despite all the hype around China’s great firewall, efforts to completely shut out international communications are increasingly seen by government actors as unworkable. While, for their part, non-state organizations of every stripe use virtual networks to their advantage – corporations and non-profits with new collaboration models, the Arab spring and colored revolutions’ operators everywhere, and, of course, even terrorists. More common and larger-scale cyber-attacks (from Sony pictures to Spanish renewable energy companies) are yet another example of this unprecedented “communication” flow; just as growth of the dark web has allowed for more effective connections in illegal activities – drug trade, human trafficking, and the like. For better and for worse, communications are becoming far more global and efficient.
The global middle class. The biggest “winner” of the past decades of globalization has been the rise of a global middle class. Vast poverty reduction in China in particular, and in emerging markets more broadly, has depended on access to international markets. 700 million have been lifted out of poverty since the turn of the century, with global poverty essentially dropping under 10 percent for the first time – even though most of the world’s new middle class remains financially vulnerable. The resulting empowered billions of people may not support the Washington consensus, but they’re no less interested in smartphones, cars, and the other fruits of globally-connected supply chains. Without an acute war-type crisis, few political leaders will attempt to override popular demands for global goods. This all means economic power becoming more evenly distributed around the world, even as global inequality compared to the world’s top earners has grown within countries.
Corporations. The rise of the global middle class, particularly in Asia, means that most Western-based multinational corporations around the world continue to see their most important growth as global (even as see technology-driven “onshoring” trends for production facilities makes a comeback). There’s also been a sea change coming from China itself, with beijing’s largest companies now embracing a strong interest in global expansion strategies as they try to replicate their domestic significance in the international market. Alibaba Group has made international expansion its top priority in recent years, on both the sales and hiring fronts. There’s also a globalization trend emerging in small and medium enterprises: the so called “micro-multinational;” mid-sized firms deploying new technological strategies to allow them access into new markets earlier in their growth process.
Indeed, the world’s most dynamic economic actors have a powerful interest in maintaining global connectivity even when governments falter. Google, Microsoft, and Facebook are doubling down on undersea cabling. Jack Ma has bought an English-language newspaper and listed his company in New York. Vodafone built a mobile payments system in Africa that is far superior to those in Western markets. Multinational corporations face challenges from slowing growth and more market volatility, but neither trend will derail an ever-increasing globalization trend.
Commerce. Alternative payment systems enable globalization. Paypal and Venmo allow global transactions to be made instantaneously. With Bitcoin, there’s no need for even an exchange process. Movement of money is becoming faster and easier through both legitimate and illegitimate channels. Then there’s the growth in real estate acquisitions by foreign investors, particularly in global cities like New York and London. Silicon Valley start-ups raising money from Saudi venture capitalists. And explosive growth in collaborations for commerce in the cultural arena – movie and music industries cutting across Hollywood, a nascent Chinese industry, Bollywood, and even Nollywood (in Nigeria).
Energy. Energy supplies long acted as a globalization chokepoint. Today, they are a driver of it. A nuclear deal has brought iran back as one of the world’s largest energy producers. Cuba reconciled with the United States in part due to Venezuela’s diminished energy clout (and of course limited ability to provide a socialist alternative to the Americans). The biggest shift is technology ending “peak oil;” an unconventional energy revolution quickly making the United States the world’s largest producer. All of which has decentralized production, stripping government control out of global energy markets and essentially ending OPEC.
Climate change. After decades of “north versus south” and climate-change skeptics holding sway over policy in a number of core carbon-emitting nations, there’s now growing international consensus on the scale of the challenge and the importance of policy redress. Decades of limited cooperation among central governments in a series of failed global summits – all the while extreme climate conditions created greater human impact – has led non-governmental actors to take up a leadership role in the climate change agenda, notably creating incremental but meaningful success in last year’s Paris meeting. It’s the first meaningful example of a global crisis creating progress (albeit to date limited) toward global governance.
Now, the forces of deglobalization:
Geopolitics. Geopolitical volatility is at unprecedented levels in the world today. The Middle East is both imploding and exploding due to failed models of governance, increasingly stretched economies, and fracturing security. Failed states across the extended Middle East, North Africa, and South-Central Asia; an unprecedented refugee crisis; and the world’s most powerful ever terrorist organization are all having profound spillover effects across those regions and into Europe (though, notably, that’s not been true of East or Southeast asia, and it’s certainly not true of the Western Hemisphere).
Then there’s the fact that the United States – globalization’s standard bearer for nearly 75 years – is now proving to be considerably more reluctant to be the world’s indispensable nation. That means less appetite for upholding global security, promoting global trade, or cheerleading global values. There’s recently been slightly more support among Americans for foreign policy intervention than during the historic lows of 2013, but the overall tendency is still less engagement and more unilateralism, if not isolationism (a solid majority of americans – Democrats and Republicans alike – thinks the United States does too much internationally, and wants whoever takes power in 2017 to focus on domestic rather than foreign affairs). Meanwhile the world’s other largest economies – China and Japan – have neither the willingness nor the capacity to step into the breach.
All of which means the geopolitical condition I call the g-zero is intensifying, and weighing on a world that’s more de-globalized than at any point since the end of World War II. I don’t view today’s state of dis-equilibrium as sustainable, but it’s unclear whether what replaces the g-zero is a return to a more globalized geopolitical order or something even more fragmented. For now, I’d bet on the latter.
State capitalism. One of the most acute forces of deglobalization is the rise of state capitalism, with China – soon to be the world’s largest economy – dominated by a government player. Yes, Beijing is reforming. But China is growing faster than it’s reforming, and as a consequence it’s projecting its domestic model of government heavy-handedness on the international stage. That means the end of the global free market and its replacement with a model marked by bilateral, rather than multilateral, political and commercial ties, with Beijing playing a greater role in directly determining outcomes. That will lead to growing necessity for economic actors to align themselves with China in many markets, as well as a significant increase in the growth of strategic sectors – sectors in which companies need to be seen as strategically compelling to governments in the countries in which they invest.
The growth in importance of strategic sectors is arguably the most important new dimension of this new global economy when it comes to impacting multinational corporations; which is happening in ways that are fundamentally opposed to a world meant to be marked by increasingly borderless globalization. The technology sector is a good example: in many countries (including Russia, and now increasingly Iran), local industries tend to flourish independently of (and shielded from) the government; but as soon as their growth, success, and strategic importance becomes evident, they’re taken over by government oversight. Whether this also happens in developed countries as technology gets added to the usual military-industrial dyad is one of the most important questions for the future of the global marketplace.
Global architecture & standards. Playing into the tension between (growing) state capitalism and (historically dominant) free market is China’s ongoing development of its own version of the Marshall Plan – displaying the world’s only global economic strategy driven by a trillion-plus dollars of investment into international infrastructure. China’s plan involves very different strings than the postwar American checks did: no interest in promoting the rule of law, free markets, and (US-led) global standards, but a rather simple “buy from Chinese state owned corporations, accept Chinese currency, employ Chinese standards.” Foreigners perceive both the American and Chinese models as threatening and are looking to create “third way” alternatives (think European regulatory approaches to technology).
The fault lines undercutting the prospect of globally unified standards are also at play within countries, as each private sector company seeks to push its own version of a global industry model in areas such as the internet of things: Tencent vs. Huawei, Apple vs. Google vs. Intel. Such competition’s only normal when McKinsey’s estimated gains of over $11 trillion in the next ten years. Tech companies like Google are already facing backlash in Europe, Apple in China, Huawei in the US. That competition will only get greater as the prospects of economic gains become more evident.
Populism/nationalism. Populist movements are expanding across the world, with the strongest and most sudden trajectory found in developed states. That’s a direct reaction from populations hollowing out economically and feeling faced with otherness culturally – it’s essentially the other side of the coin of the rise of the globalized middle class. It’s the Brexit movement and Euroskepticism more broadly. The rise of Donald Trump and Bernie Sanders in the united states. European far right and far left movements, now showing record levels of support in Austria, France, Italy, and beyond. It’s separatism in Scotland, Catalonia, and Northern Italy. It’s the erosion of rule of law and legitimacy of political institutions across East, Central, and Southeast Europe. It’s a growing belief that political outsiders aren’t welcome; that European supranationalism is a mistake.
Many of the core constituencies driving global integration and connectivity over the past 30 years have now abandoned it. The populist argument is that globalists have used powerful institutions to gut what these countries and their cultures stand for. Populists want more homogeneity. In the United States today, frontline politicians cannot be seen to favor free trade, let alone for the reform of global institutions like the United Nations; imf quota reform took intense pressure and came little and late. Europe is more interested in breaking up its own integrating structures than establishing new global relationships; not to mention its rapid abandonment of the principles of free movement in reaction to the refugee crisis. And, critically, as technology removes labor from the capital equation globally, these trends are very likely to expand to the world’s emerging markets – a key trend playing against globalization in the coming years.
Protectionism. In lockstep with increased populism, protectionist sentiment is growing among many in the developed states, who don’t believe free trade benefits them personally. Yes, citizens have benefited from cheaper products. But real wages have been flat – in some cases even shrinking – and job opportunities in the developed world have become more limited. This was less of a problem in the 80s with the rise of Japan, but the rise of China has proved a larger shift… and the rise of technology greater still. That’s led to significant pushback against free trade, now making Transpacific Partnership (TTP) ratification at best a toss-up, and the Transatlantic Trade and Investment Partnership (TTIP) effectively a dead letter.
The process of negotiating TPP concessions for agriculture, cars, and other traditionally-protected industries has been protracted at best. Protectionist measures grew at their fastest pace since 2009 in 2015; led by India, Russia, and the United States. In latest data, for the first 10 months of 2015, governments around the world passed 539 protectionist measures, up from 407 in the same period of 2014 and 183 in 2012. It’s easier to erect trade barriers than to tear them down, as what starts off as “anti-dumping” can quickly become “protect our workers.” Measures put in place in response to populist anger (Trump’s China penalties, Ukraine’s Russian embargo) are particularly hard to dismantle. Global free trade deals have stalled, giving way to bilateral and regional alternatives. All while the fora for resolving disputes – the WTO, the ICJ – are being increasingly ignored by their principal actors (the US, China).
Capital flows & foreign exchange. There was a significant slowdown in net capital flows into emerging markets from Q4 2014 through Q3 2015 (and it’s likely Q4 2015 was just as bad). In 2010, net capital inflows into emerging markets amounted to 3.7% of GDP. By 2014-2015, emerging markets had a 1.2% of GDP net capital outflow – due to a fall in inflows and high outflows. There were a few reasons: the transition from Fed quantitative easing to anticipation of interest rate hikes and worries about the impact of lower commodity prices and slowing Chinese growth.
When it comes to foreign exchange, average daily trading volume in April 2016 was $4.6 trillion dollars, slightly lower than the $4.8 trillion of April 2015, with volumes little changed over three years. Beyond the cyclical uncertainties affecting trading volumes, there may also be structural factors at play, particularly an official rethink of the benefits of open capital accounts, and fast-money cross-border capital flows in particular. The greater respectability of capital controls is one of the most important trends in global finance today. At least for now, we’ve passed the peak of traditional financial globalization.
The global internet. The promise of the internet is souring as digital infrastructure fails to keep pace with the capabilities of states and malicious private actors. Major hacking incidents have become routine. Unlike in finance, the ability of governments to step in and stop a cyber panic, in which individuals would withdraw from online life and commerce, is untested.
But even more threatening that the asymmetric capabilities of non-state actors is the risk of internet fragmentation stemming from government actions. The Chinese are well known for their attempts at taming – and reshaping in their own image – the global internet. Beijing’s attempts at ending anonymity on the internet by seeking to force all users to have real-name registration will prove a strong pushback on globalization. The coming years will see far more top-down filtering and surveillance from Beijing. And many other countries are interested in taking from the Chinese model for their own security and safety. That means different surveillance models, different governance models, and different economic winners and losers. What had been the clearest “win” for globalization in a single open internet is now fragmenting into a number of differently governed online spaces.
And some factors where the impact isn’t so clear:
Information. This is the most difficult issue to address on the globalization/deglobalization spectrum. On the one hand, the advantages of big data becoming a source of global economic growth are clear and driving game-changing business models in most every sector. So too, the ability for consumers to have access to information flows from all over the world, with virtually no (direct) cost to the individual. But filtering and segmentation of information is at least as important a global trend, and it firmly weighs on the deglobalization side.
Both of these trends are strong, and move in precisely opposite directions. There’s vastly more information out there. But it’s channeled much more among like-minded people (and in many cases marshaled – and profited upon – by top-down systems). The proliferation of news sources sends most people to media outlets that confirm their prejudices. This is a strong form of self-censorship. While when it comes to traditional censorship, control of information is a contest between censors and users that is likely to swing in both directions. One will gain an advantage, and then the other will respond. On balance, I’d say information flows have leaned rather in favor of globalization when it comes to data, and against it when it comes to how people actually relate to, and use, it.
Economic sanctions. Not only has the United States used sanctions extensively as a non-lethal tool of power-projection in the past few years, but this behavior has encouraged a range of other countries to follow suit; from the EU to Russia, Turkey, and Saudi Arabia. So, at first glance, the trend isn’t encouraging when it comes to keeping the world globalized. But it’s also becoming ever harder for americans employing unilateral coercive diplomacy to convince other important economic actors, allies as well as non-allies, to play along. That may ease us sanctions use a bit going forward. The United States is also starting to realize that its “weaponization of finance” will increasingly lead to blowback in an increasingly non-polar world, and hence isn’t sustainable in the long run. Finally, the opposite policy approach is bearing success: Washington has begun opening – rather than closing – doors, as evidenced by the Iran deal, the Cuba rapprochement, and the possibility of a warming up with Russia if a compromise is eventually found over Minsk.
Global trade. Lots of anti-globalization types talk about the diminishment of global trade, but it’s hard to make a call on which way trade is heading. On the one hand, trade volumes have flattened among advanced economies and are shrinking for emerging economies – subtracting about half a percentage point a year from the overall growth rate in the developed world since 2012. The reason to worry is that trade growth typically outpaces GDP by a wide margin; and after a post-recession rebound in 2010 to 12%, trade growth slipped to 7% in 2011, stagnated at 3% for the next three years and then fell below 2% for 2015 – well below GDP for the first time since 9/11 (the 1987-2007 average was 7.1%).
Global trade looks even more alarming when measured in price terms: having fallen 13% in 2015 to 16.5 trillion from 19 trillion in 2014 (though this reflects both exchange rate effects (a stronger dollar) and price effects (lower commodity prices)). China focusing on domestic demand rather than exports for growth is worth watching closely: if wheels start falling off Chinese reform, that’s the tipping point for a big hit to globalization.
But that diagnosis is complicated by issues that relate specifically to the way the Chinese business cycle is presently working. Global trade growth appears to have slowed because China is importing less in both price and volume terms (the price effects being directly related to the volume effects); this will in part reflect a slowdown in Chinese growth. At the same time, as China rebalances its economy away from investment and towards consumption there’ll be a decrease in import intensity because consumption (especially services consumption) is less import-intensive than investment. Furthermore, an increase in domestic technological capacity will mean that a larger portion of the value added in exports is added onshore in China (so goods wholly or partially made in China will cross the country’s borders fewer times). Not sure any of that is a structural move away from globalization.
Supply chains. Like global trade, there’s been a lot of negative talk… but not yet a structural change. Overall, I’d accept the argument that supply chains are going to get considerably shorter. From Adidas to GE, companies are producing closer to their markets, since labor is becoming a much smaller input cost in total production. Plus, 3D manufacturing and just-in-time production capabilities argue for smaller supply chains; as does greater decentralization in energy production and markets. Companies won’t need to ship as much. And so, there’ll be fewer disruptions in bringing goods to market, but also bigger investment concentrations in the West. Like global trade, supply chains are probably now a trend towards deglobalization, but it’s too early to make a clear call.
Who is winning?
First, a subtlety. One striking revelation is that the same countries that most depend on a globalized world (the United States, China) are also the ones leading the charge in harming globalization/creating deglobalization. Second, there’s a difference between one-hub globalization and multiple-hub globalization. Americans are used to one-hub globalization (the post-war world, particularly since 1990), in which Americanization and globalization were effectively the same thing. So you could easily mistake the rise of alternative hubs coexisting alongside the dominant hub as a retreat from globalization. That’s a fair point from a purely us perspective. But, by creating multiple networks, alternative hubs can actually increase the resilience of globalization, provided they are interoperable. In this context, it’s a long term positive for globalization that alternative countries are developing international architecture like Asian infrastructure investment bank, the BRICS bank, and the like. The AIIB’s willingness, for example, to fund projects the more conservative Asian development bank won’t because of pressure from developed market non-governmental organizations is arguably good for future globalization.
The biggest single takeaway is that things/processes/technology tend to be globalizing. It’s the people that aren’t. They’re resisting primarily because many don’t feel globalization benefits them. In part that’s a drive from the hollowing-out developed market middle class... That may soon extend to the emerging market middle class. And in part an increasingly powerful Chinese government that supports aspects of economic globalization but strong political deglobalization... that may soon become more challenged by globalization overall.
That resistance is only going to grow in coming years, as there’s very little that gives near-term hope in changing the calculations of globalization’s “losers.” Given that the losers of globalization aren’t being particularly effective at stopping it, and given that the processes I’ve identified driving globalization themselves aren’t diminishing… there’s a good chance the forces for deglobalization are only going to get stronger. And so, with an increasing push on both sides of the equation, we’re not likely to see a resolution.
For the coming years, i’d bet on more on momentum from the forces of deglobalization. More risk-driven volatility. More differentiation between sovereigns, sectors, and companies. Because as much as “things” matter, they’re ultimately shaped by governance, architecture, and “rule spaces”… all of which are becoming more deglobalized than not.
But I expect that’s not the end of globalization per se. Rather, it’s a downward cycle on a curve that ultimately swings up… the question being how far down it goes (and can it functionally break the curve). I hope not. But we’re going to find out soon.
Subscribe to John Mauldin’s Free Weekly Publication
Each week in Outside the Box, John Mauldin highlights a thoughtful, provocative essay from a fellow analyst or economic expert. Some will inspire you. Some will make you uncomfortable. All will challenge you to think outside the box. Subscribe now!
0 notes
Photo
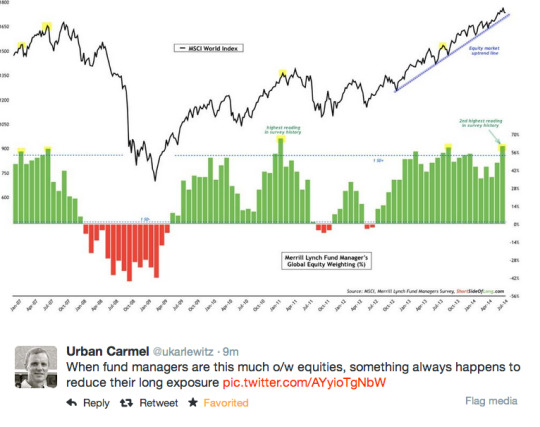
Fund Managers Are Dangerously Long Here
The Merrill Lynch Fund Manager's Global Equity Weighting Index is at its second highest level in history, which means that funds are long out the wazoo.
At these levels, the market tends to revert as you can tell from the chart above posted by @ukarlewitz.
This does not necessarily mean that an end to the bull market is imminent, note that the shake out last Summer (in yellow) coincided with a pull back but not a trend break, but more that a washout is due in order to get this cohort less comfortable being so exposed to risk.
See More Analysis on this here: Fund Managers Are All In (The Short Side of Long)
0 notes
Text
Global Equities Encountering Resistance At Year-End

The Global Dow Index is running into its long-term Down trendline stemming from the 2007 all-time peak.
Here in the U.S., equity investors have been a bit spoiled as they’ve watched index after index break into all-time high ground this year. Around the globe, investors have not been so lucky. Yes, most international indices have rallied solidly this year. However, with few exceptions, the rallies have still left these international markets shy of their all-time highs. One illustration of this situation can be seen in a chart of the Global Dow Index (GDOW).
We’ve posted many times on the GDOW due to its reliable conformity to technical charting tools, despite the fact that very little money is traded off of it. Additionally, we have found it to be an accurate barometer of the state of the global equity market. Specifically, the GDOW is an equally-weighted index of 150 of the world’s largest stocks. While this includes U.S.-based companies, its heavy dose of international exposure has led to its aforementioned position below its all-time high.
Furthermore, it is currently running into potential resistance in the form of its post-2007 Down trendline connecting the 2007, 2014 and 2015 tops.

Will this hold? We don’t have a crystal ball, but it has briefly repelled the GDOW thus far. And while most U.S.-based indices have succeeded in reaching all-time high ground, it is important to note that such circumstances are not unanimous. Along with the Value Line Geometric Composite, there are still some key hurdles facing global stocks as we head into 2017.
________
More from Dana Lyons, JLFMI and My401kPro.
The commentary included in this blog is provided for informational purposes only. It does not constitute a recommendation to invest in any specific investment product or service. Proper due diligence should be performed before investing in any investment vehicle. There is a risk of loss involved in all investments.
3 notes
·
View notes
Text
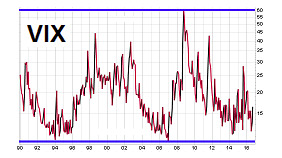
Stop Wasting Energy On The VIX
The VIX Fear Index is arguably the most over-analyzed tool on Wall Street regarding its real-world predictive powers relative to the long-term path of the stock market.
The common argument is when the VIX spikes, it is indicative of rising fear, and thus stocks typically drop when the VIX rises.
The VIX measures “expected near-term volatility”, which is quite a bit different than fear or long-term economic concerns
Can stocks go up when the VIX rises significantly from low levels? You can decide for yourself after reviewing a historical example.
Sounding The Low VIX Sirens For Stocks
If you follow the markets regularly, you have probably run across similar passages to the one shown below from a May 28, 2014 MarketWatch article:
As the VIX continues to sink closer to its historic low of 9.39, many commentators are now discussing the VIX as a “complacency index.” As the VIX falls, it signals increasing levels of investor complacency. Because economist Hyman Minsky taught us that periods of high volatility follow periods of low volatility, many investors are beginning to worry that a “Minsky moment” could be lurking around the next corner that would send volatility higher, increase the risk premium for holding stocks and cause prices to sink.
We agree with portions of the quote above, with two exceptions: (1) when the VIX rises from low levels to higher levels, it does not necessarily mean the stocks are in big trouble, especially when viewed from a longer-term perspective, and (2) low VIX readings do not necessarily align with caution-oriented “complacency”.
Retail Sales Align Nicely With The VIX Story
Having worked on Wall Street for over 20 years, we can confidently state evidence is always available that logically aligns with the bearish narrative for risk-related assets; the same can be said for a bullish narrative. The bearish case got a nice dose of weak data on Thursday, September 15. From Bloomberg:
Sales at U.S. retailers dropped more than forecast in August, indicating a pause in recent consumer-spending strength that has carried the economy. Purchases declined 0.3 percent from July, the first drop in five months, after a revised 0.1 percent advance in the previous month, Commerce Department figures showed Thursday in Washington. The median projection of economists surveyed by Bloomberg called for a 0.1 percent decline. Excluding cars, sales unexpectedly fell 0.1 percent.
Low VIX Means Trouble For Stocks, Right?
As recently as September 8, 2016, the VIX was hovering near the low end of its long-term range dating back to the 1990s. If that means historic complacency, then logic would tell us that when the VIX rises from very low levels, it must mean rising fear and bad times ahead for stocks…right? That logic often holds in the markets, meaning the VIX can be and is a useful tool for stock investors. However, the strength of a stock market indicator lies in its consistency.
Can stocks rise as the VIX rises from low levels? History not only says “yes”, but it does so emphatically. The chart below shows a period beginning in late 1995 when the VIX started to rise from low levels. The VIX surged from 10.36 in 1995 all the way to 38.20 in late 1997, which is a major spike in the VIX. How did stocks perform over the same period? The S&P 500 gained 47%…yes, that is not a typo…stocks gained 47% during a period when the VIX more than tripled.
For those scoring at home, the 47% move in stocks began when the VIX showed “a high level of investor complacency” with a reading of 10.36. What was the recent 2016 low in the VIX? 11.02.
The VIX Is About Volatility, Not Fear
The moral of the story is there is nothing wrong with having the VIX in your stock market toolkit. However, the VIX needs to be used in the proper context to be more helpful to longer-term stock investors. From a 2014 Yahoo Finance article about the VIX:
Today the VIX sits below 11.50 and stocks are slightly higher despite weak earnings and a widely expected, but still ugly, negative print in first quarter GDP. Rather than interpreting the market action as complacency traders are generally just accepting that the VIX is lower because the market is open for business. The thing is, the VIX never measured “fear.” It measures expected volatility. If 11.5 seems like a low print that’s only because you aren’t putting it in the context of single-digit trailing volatility. The VIX is low for a reason and that reason is that stocks simply aren’t going down in large enough gaps to justify paying much for insurance.
VIX Even Less Relevant On Longer Timeframes
If we take the historical example above out even further in time, it emphasizes the two main points: (1) when the VIX rises from low levels to higher levels, it does not necessarily mean stocks are in big trouble, especially when viewed from a longer-term perspective, and (2) low VIX readings do not necessarily align with caution-oriented “complacency”. If the S&P 500 can gain over 170% during a period in which the VIX rose significantly from historically low levels, it tells us to be careful about how we interpret and use the VIX.
September Rate Hike Odds Drop
The market’s pricing mechanism has an almost infinite number of moving parts. One of the important parts is Fed policy. Thursday’s weaker than expected read on the economy makes it easier for the Fed to stay in the “do nothing” camp in September. From Reuters:
U.S. retail sales fell more than expected in August, pointing to cooling domestic demand that further diminishes expectations of a Federal Reserve interest rate increase next week…Financial markets are pricing in only a 12 percent probability of a rate hike next week, down from 15 percent before the data, according to the CME.
Investment Implications – No Need To Anticipate
Have stocks corrected after the VIX hit low levels? Yes, we can find numerous historical cases where a rising VIX occurred during a weak period for equities. Regardless of what the VIX does, we know it is highly unlikely the stock market will enter a multiple-month correction or a multiple-year bear market without seeing some evidence of deterioration on the chart of the S&P 500. How vulnerable does the broader stock market look right now? The charts below allow us to compare 2016 to a higher risk period in 2007.
This video clip explains why the charts above are helpful. Is using moving averages a perfect way to manage portfolio risk? No, but used in conjunction with other economic and technical inputs, it can help us stayed aligned with the market’s risk-reward profile.
The VIX Can Be Helpful
Before you begin composing emails or tweets about the usefulness of the VIX, our market model uses the VIX, which means we agree it can be helpful. The key point is time frames. Shorter-term traders may have found countless relevant ways to effectively use the VIX. We are investors, meaning it is important for us to understand what the VIX can and cannot do on a longer-term time horizon relative to the stock market.
#$IVV#$VBK#$ACWI#$IJK#$VT#$SCHF#$SCHX#$IWP#$IWO#$SCHB#$SPLV#$XLP#$IWN#$XLI#$XLU#$IWS#$VV#$VBR#$XLY#$VXX#$VXN#$VIX#$SH#$SDS#$PSQ#$SBB#$TWM
3 notes
·
View notes
Text
Global Equity Rally Facing Next Big Hurdle

A key index of global equities is hitting a significant confluence of chart resistance.
Back in early April, the global equity rally began to look a bit tired after 2 months of rallying. This was especially the case in the major U.S. averages and defensive sectors that had been bearing the brunt of the advance. Shortly thereafter, we saw a number of previously lagging areas of the market break out above key resistance that had been holding them back. This gave the rally some new fuel and propelled stocks higher for a couple more weeks before pausing.
Included among this “new fuel” were global stocks, which had been lagging for some time. And a barometer of global stocks that we like to monitor, the Global Dow Index (GDOW), was able to achieve one of the aforementioned breakouts. In the process, the GDOW jumped above a plethora of key resistance levels, including the post-2009 Up trendline as well as the post-2015 Down trendline. After following through on the breakout for a few weeks, the GDOW was halted at another key level of resistance: the 61.8% Fibonacci Retracement of the May 2015 - February 2016 decline at 2412 (the GDOW closed at 2410 on April 20).
While the GDOW has been unable to surpass this level since, it has also managed to avoid breaking down. And after a handful of attempts to break the index lower, it has once again returned to the former Fibonacci line at 2412 that held it in check in April. If it can finally overcome this level, it could spur on another leg up in the global equity rally. There is one other item of resistance that may make this area an especially tough hurdle this time, though.
At the time of the April breakout, as mentioned, one of the lines that the GDOW was able to overcome was the up-sloping trendline from the index’s 2009 lows. After breaking below the trendline in January, it was able to again reclaim the top of it in April. After the rally stalled later in April, however, the index would again lose the trendline, falling back below it by early May. It has been below the trendline since. However, as the trendline is upward sloping, it has now risen to presently intersect with the Fibonacci Retracement near 2412.
Thus, as the chart shows, the GDOW is now contending with this convergence of the 2 key resistance lines in its attempt to hurdle to new rally highs (as we type, the index is trading at 2413).

Here’s a closer view of the current action.

With sentiment finally getting a bit frothy and U.S. stocks perhaps getting extended, the global equity rally could sorely use some fresh fuel again. As in April, if the laggard areas that aren’t as extended, like the Global Dow Index, can hurdle over current resistance, it could provide the rally with a much-needed jolt of energy.
_____________
More from Dana Lyons, JLFMI and My401kPro.
The commentary included in this blog is provided for informational purposes only. It does not constitute a recommendation to invest in any specific investment product or service. Proper due diligence should be performed before investing in any investment vehicle. There is a risk of loss involved in all investments.
3 notes
·
View notes
Text
Key Global Equity Index Takes Elevator Down To Support

After breaking key support on January 6, the Global Dow Index has straight-lined down 10% to our next projected support level.
In a January 6 post, we outlined why we felt that day marked a key juncture in the markets. The significance related to a plethora of breakdowns below major support levels among various key indices. One of those indices was the Global Dow Index, an unweighted average of 150 of the world’s largest companies. That day marked a breakdown below the 2280 support level that had held the index in August, September (after a false breakdown) and December. We highlighted roughly the 2060 area as the next potential significant support, a level that would mark a further 10% drop in the index.
Well, like the Value Line Geometric Composite that we covered on Wednesday, the Global Dow followed the old Wall Street adage about bull markets taking the escalator and bear markets, the elevator. In fact, it may have simply jumped down the elevator shaft as, in a span of just 10 days, the index found itself already down at that lower support level.

So what now? The risk has been wrung out and back up the escalator we go? Well, not necessarily. In our view, yes, the level is significant enough that it should hold, at least temporarily. In fact as of today’s close, the Global Dow has already jumped some 4% off of Wednesday’s low. The fact that it bounced where it “should” is a good sign that A) we accurately identified the correct potential support area on the chart and B) prices “respected” (i.e., held) at that area.
This is good news for bulls because, despite what seemed like an out-of-control freefall at the time, price movement was at least orderly, albeit swift. In other words, while the elevator was plummeting, at the very least, it stopped at the appropriate floor. This gives us confidence in the validity of the level. Prices could still chop around and test that level again (or even break it temporarily) before any durable bounce. However, this gives us a reliable level to “play off of, up or down.
Now, about that rate of descent. Does it make a difference, in terms of the support level’s likelihood of holding, that the Global Dow hit the lower target so quickly? We think it does. Unless the index rallies back above the previous support level, and does so about as quickly as it dropped, the swift decline is probably bad news in the longer-term. While anything is possible, we feel the “V-Bottom” days are behind us so this scenario is unlikely.
Therefore, given the swiftness of the drop to current support, the index is unlikely done with the area yet. An intermeidate-term bounce (i.e., weeks-months) could very well be initiated from this level, however, prices are likely to test the level again prior to any durable intermediate-term bounce. Furthermore, such downside momentum could suggest that subsequent to any intermediate-term bounce, this level may very well break eventually. That threat is especially relevant given our longer-term, less-than-optimistic expectations for the stock market, in general.
This is all speculation at this point. However, given that the index has conformed very closely to the technical, charting analysis that we have applied over the past 10 months or so, the speculation should be given due consideration.
So the good news for bulls is that, despite a painful elevator ride down, the Global Dow did bounce where it should have. Thus, a tradble intermediate-term rally is quite possible. The bad news is that the speed of the descent suggests that prices are unlikely finished testing this area in the short run -- and likely to threaten the area again in the long run.
_____________
More from Dana Lyons, JLFMI and My401kPro.
The commentary included in this blog is provided for informational purposes only. It does not constitute a recommendation to invest in any specific investment product or service. Proper due diligence should be performed before investing in any investment vehicle. There is a risk of loss involved in all investments.
3 notes
·
View notes
Text
Global Stocks Breaking Decade-Long Resistance

The Global Dow Index has broken above its post-2007 downtrend.
One theme we highlighted coming into 2017 was the potential chart resistance facing many global equity markets following the sharp “Trump rally”. This included the Global Dow (GDOW), a broad index of mega-cap global companies, as we mentioned in a late December post. The specific resistance we noted pertaining to the GDOW in particular was a Down trendline stemming from its 2007 all-time high and connecting the tops in summer 2014 and spring 2015.
This trendline held the GDOW back from December into mid-January. However, this week’s global equity rally has seen the GDOW eclipse that post-2007 Down trendline, currently near the 2590 level.

The break of this 10-year trendline removes a major chart impediment and opens up considerable upside for the GDOW. That said, it is not necessarily all free and clear for the index (though, it never is). One immediate obstacle facing the GDOW is the lateral resistance in the 2640′s range, representing the 2014-2015 highs. Yesterday’s high in the index was 2638.54, so we are essentially there now. A pause here and possible test of the trendline breakout level near 2590 would not be a surprise.
As we have mentioned often regarding the Global Dow, one reason we like tracking it is that it adheres very well to various technical charting analyses.
This again may be a surprise for some to learn since there is not much actual money traded based off of it. There is a U.S.-based ETF, however, that tracks the GDOW. It is the SPDR Global Dow ETF, ticker, DGT. And since the Global Dow is priced in U.S. Dollars, the DGT does not have the currency headaches that most internationally-focused equity ETF’s do. For that reason, it tracks the GDOW pretty closely and it too broke above its post-2007 Down trendline this week.

The theme of this week in the equity market has been “breakouts”. And while everyone is well aware of Dow 20,000 by now, and perhaps the more important breakout in the NYSE that we wrote about on Wednesday, it has not just been about domestic stocks. International stocks, which have for the most part lagged their U.S. counterparts for many years, have improved their technical prospects significantly in recent weeks and months. This includes the Global Dow Index, a good sign for the intermediate-term prospects for international equities.
________
More from Dana Lyons, JLFMI and My401kPro.
The commentary included in this blog is provided for informational purposes only. It does not constitute a recommendation to invest in any specific investment product or service. Proper due diligence should be performed before investing in any investment vehicle. There is a risk of loss involved in all investments.
Global Stocks Breaking Decade-Long Resistance was originally published on The Lyons Share
2 notes
·
View notes
Text
Global Stocks Back In The Battle Zone

A key global equity index is testing its significant breakout level from last month.
Just a quick post today featuring one of our new favorite indexes, the Global Dow Index. Again, the Global Dow is an equal-weighted average of 150 of the world’s largest stocks. It isn’t our favorite because it is necesarilly the most attractive looking investment at this time. Rather, we have found it very instructive as to the trend of global equities and, as a bonus, very receptive to traditional technical and charting methods.
For example, on April 15, we noted that the Global Dow was breaking out above multiple levels of key resistance. We had previously stated that its reaction at that level may loom large in determining whether the global stock rally is halted or extended. Thus, the breakout was a big victory for the bulls and, indeed, the index would pop another 5% or so immediately.
Presently, however, the index has come back down to test that breakout level. Nobody who has observed the equity markets the past 2 years should be remotely surprised about this as stocks have essentially been spinning their wheels over that time.
Big Picture:

Close Up:

As for the present test, the story is the same. A hold here around 2300 keeps the ball in the bulls hands. A breakdown below there gives it to the bears. Stay tuned to the developments in this key index.
_________
More from Dana Lyons, JLFMI and My401kPro.
The commentary included in this blog is provided for informational purposes only. It does not constitute a recommendation to invest in any specific investment product or service. Proper due diligence should be performed before investing in any investment vehicle. There is a risk of loss involved in all investments.
2 notes
·
View notes
Text
Global Stock Gauge Testing Key Breakdown Level

After rallying off major support for the past month, the Global Dow Index is testing its key January breakdown level.
Money managers and strategists all have their favorite indices that they feel best instruct them as to the market’s likely path, and thus, the most suitable investment posture. For us, our favored index is the Value Line Geometric Composite as it is a very broad, unweighted average that we feel paints the best picture of the state of the overall equity market. Another index that we have recently found particularly helpful is the Global Dow Index. The Global Dow is also an unweighted average -- of 150 of the world’s largest companies. Thus, we feel it provides a decent barometer of the global equity market.
Another reason why the Global Dow has become a focus of ours is because it has adhered particularly closely to our charting analysis. Any security or index that behaves “as it should” is an attractive target for us, especially in this bizarro HFT era where so many charting outcomes have been completely opposite that of conventional wisdom. The Global Dow’s chart conformity is especially interesting since little to no money is directly traded off of it. Then again, perhaps that is precisely why it has worked so well recently. Consider some of our recent posts covering the Global Dow:
On January 6, the index was among those that we mentioned had suffered potentially key breakdowns that day. Key levels broken that day included the post-2009 bull market Up trendline and a key cluster of Fibonacci Retracement levels from the major lows since 2009. By our assessment, that opened up an immediate 10% of additional downside before hitting the next, sequential Fibonacci Retracement cluster.
Indeed, it took the index just 2 weeks to traverse that 10% pocket lower, arriving there on January 20, which we noted at the time. It subsequently bounced from that support level -- like it should have -- rallying back since, following a February re-test.
Fast forward to today and we find the Global Dow back near the key January 6 breakdown level.

Here’s a zoomed-in look.

One of the basic tenets of technical charting analysis is that price has “memory”. That is, it should respond to price levels that proved impactful or significant previously. In this case, what had been support before the January 6 breakdown, now theoretically becomes resistance. And considering again the Global Dow’s recent obedient adherence to technical charting levels, the index should find this area nearby to be an uphill battle.
The underside of the post-2009 Up trendline is not far away. Nor are the Fibonacci levels. Add in the 1000-day simple moving average, the Down trendline from the May peak and 2 key Fibonacci Retracement lines from the recent decline (e.g., the 38.2% Fibonacci Retracement of the 2014-2016 decline and the 61.8% Fibonacci Retracement of the November-February decline) and you have some stiff potential resistance here for the index and the post-February global equity rally.
So, we would expect the climb to get a bit more arduous at this point for the Global Dow. On the other hand, if the index busts convincingly right through the area, it would be a good sign for the intermediate-term prospects of the rally (or perhaps it would mean that the HFT algo-bots have found our Tumblr).
_____________
More from Dana Lyons, JLFMI and My401kPro.
The commentary included in this blog is provided for informational purposes only. It does not constitute a recommendation to invest in any specific investment product or service. Proper due diligence should be performed before investing in any investment vehicle. There is a risk of loss involved in all investments.
2 notes
·
View notes
Text
Key Test Developing For Global Equity Rally

A key barometer of the global equity rally is facing an important test.
One of the interesting trendlines in this week’s edition of our regular #TrendlineWednesday feature on Twitter comes from the chart of the MSCI EAFE Index (EAFE). As a reminder, the EAFE Index represents developed countries in Europe, Australasia and the Far East. Like most equity markets around the globe, the EAFE has enjoyed a strong up-move of late, particularly over the past 2 years. The index did hit a snag, though, along with most stocks, early this year in the form of a post-January correction. And the resulting action has the EAFE testing an important line of bull market support.
Specifically, the EAFE is testing the Up trendline stemming from its Brexit lows and connecting the post-U.S. election lows and the lows from this past March-April.

As the chart indicates, the “test” level -- near 2023 -- also happens to signify the approximate convergence level of both the 50 and 200-Day Simple Moving Averages. Obviously, if the EAFE wants to maintain the direction and pace of its current advance, it would behoove the index to hold this key cluster of support. So keep an eye on the approximate 2023 level on the EAFE for a “tell” on the future direction of the global developed market equity rally.
Do we think the EAFE will pass this test? And how much risk opens up should the support area give way? In a Premium Post at The Lyons Share, we share our analysis of the EAFE’s prospects, as well as the clearly defined potential downside and upside targets.
If you’re interested in the “all-access” version of our charts and research, please check out our new site, The Lyons Share. You can follow our investment process and posture every day — including insights into what we’re looking to buy and sell and when. Plus, our SPRING SALE (25% OFF!!) is going on now so it’s a great time to sign up! Thanks for reading!
_____________
Disclaimer: JLFMI’s actual investment decisions are based on our proprietary models. The conclusions based on the study in this letter may or may not be consistent with JLFMI’s actual investment posture at any given time. Additionally, the commentary provided here is for informational purposes only and should not be taken as a recommendation to invest in any specific securities or according to any specific methodologies. Proper due diligence should be performed before investing in any investment vehicle. There is a risk of loss involved in all investments.
1 note
·
View note