#CSVfile
Explore tagged Tumblr posts
Visit Tumblr Blog
Explore Tumblr blogs with no restrictions, modern design and the best experience.
Last Seen Tumblr Blogs


Fun Fact
Tumblr posted its first advertisements in May 2012 and subsequently earned $13M in revenue.
Text
I will upload product and product listing manually
Shopify Product Upload Service: Save Time & Boost Sales
Are you spending too much time uploading products to your Shopify store? Let us handle it for you! Our Shopify product upload service ensures accurate, SEO-optimized listings that enhance your store’s visibility and performance.
What We Offer:
SEO-Friendly Listings: Titles, descriptions, and meta tags optimized for search engines.
Bulk Product Upload: Efficiently manage large inventories with precision.
Image Optimization: High-quality, fast-loading images for a better user experience.
Variants & Customization: Set up product variants (sizes, colors) seamlessly.
Why Choose Us?
With years of experience in Shopify management, we offer tailored solutions that save you time and improve your store’s sales potential.
Contact us today and let us help you streamline your Shopify store with our expert product upload services!

#shopifyProductUpload#shopifyupload#personalwebsite#PortfolioWebsite#everyone#everyonehighlights#productlisting#productupload#inventory#csvfile#addproduct#WebsiteExperts
1 note
·
View note
Text
Amazon product listing services are most important for boosting your online sales.

Optimize visibility: Expertly crafted listings with relevant keywords increase search rankings.
Attract customers: Compelling descriptions and high-quality images entice buyers.
Increase conversions: Clear product information and customer reviews build trust.
Save time and resources: Outsourcing listing tasks frees you to focus on other business areas.
Improve sales performance: Data-driven optimization ensures continuous improvement.
In essence, these services are essential for maximizing your Amazon sales potential.
#Productlisting#Amazonproduct#amazonproductlisting#website#ecommerce#ecommercewebsite#ecommercestore#csvfile#importproduct#Uploadedoadproduct
0 notes
Link
Hello Magento Friends,
The E-commerce store has a large number of products. You can easily upload your product data in CSV file format in Magento 2. In this article, we will learn How to Import Product Data Programmatically in Magento 2.
Checkout Steps: How to Import Product Data Programmatically in Magento 2
0 notes
Text
Museum Management System in C# with Source Code
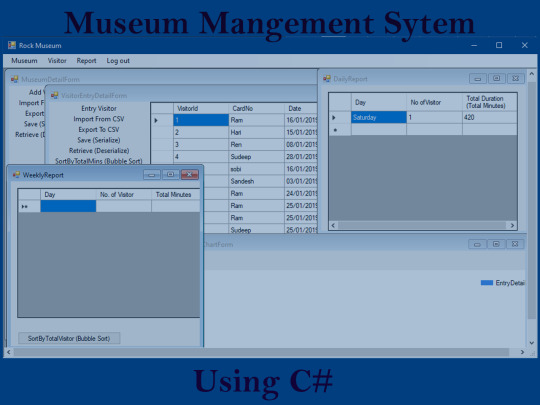
Introduction Museum management system is a museum based C# project. C# is simple. Modern and general-purpose programming language. The system project is a console app. The project us useful in carrying daily works in museum. It will be supposed to manage the museum in an efficient way. The project is bases on console app based on .NET core. This museum project is easy to use and implement. The system is randomly named as Rock museum. This project can generate the report and chart of the visitors. The system can save and retrieve data. The system has a user-friendly interface. You must download the project to have fully access to the system. Executing the project, you will see login screen first. Type admin for both user and password. Click login button and you will get access to the system. Wrong user and pass may not let you to enter the system. Login Screen Let’s talk about the system. After you successfully login you will see menu bar. These menu items has submenu. When you click on first museum menu and click detail. You will see museum detail form screen. When the sub menu is clicked it retrieve the data from save file. In this screen you can add visitor using add visitor option. You must enter the information asked. The information will publish to the screen. You can save and retrieve this data. When you save the file it will store as .dat file. Further the system can import from CSV or export to CSV file. Read the full article
#.NETcore#application-development#ASP.NET#Bubblesort#C#cprogramming#CSVfile#Freedownload#Museummanagement#open-source
0 notes
Link
We are using the cloud storage bucket to store the data and BigQuery to upload the data from the Storage bucket and merge the files...
0 notes
Text
SI 506: Programming I (Python)
Here is my Final Project Code to create a Rest API with New York Times and the Guardian searching for Rugby articles and creating a CSV file.
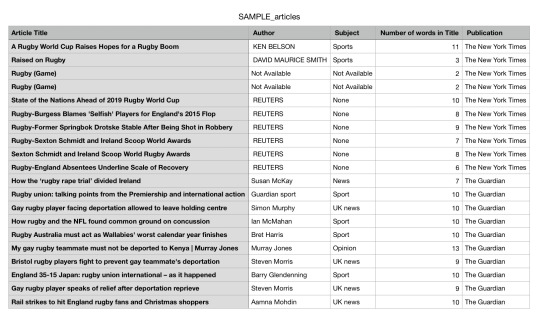
To view my code on creating the CSV file above click on ‘Keep reading’
#Angela Chih #SI 506_Final Project
import json import requests
#Use that investigation to define a class `NYTArticle` and a class `GuardianArticle` that fulfill requirements, and that you can use as tools to complete the rest of the project. #Access data from each source with data about articles, and create a list of instances of `NYTArticle` and a list of instances of `GuardianArticle`.
CACHE_FNAME = "cache_file_name.json"
# if I already have cached data, I want to load that data into a python dictionary try: cache_file = open(CACHE_FNAME, 'r') cache_contents = cache_file.read() cache_diction = json.loads(cache_contents) cache_file.close()
# if I don't have cached data, I will create an empty dictionary to save data later except: cache_diction = {}
def params_unique_combination(baseurl, params_d, private_keys=["api_key"]): alphabetized_keys = sorted(params_d.keys()) res = [] for k in alphabetized_keys: if k not in private_keys: res.append("{}-{}".format(k, params_d[k])) return baseurl + "_".join(res)
def get_from_NYT(a): # put together base url and parameters baseurl = "https://api.nytimes.com/svc/search/v2/articlesearch.json" params_diction = {} params_diction["api_key"] = "TakenOffDueToRestrictions" params_diction["q"] = a
unique_ident = params_unique_combination(baseurl,params_diction)
# see if the url identifier is already in cache dictionary if unique_ident in cache_diction: # if so, get data from cache dictionary and return return cache_diction[unique_ident]
# if not, make a new API call using the requests module else: resp = requests.get(baseurl, params_diction) # Or as: # resp = requests.get(unique_ident)
# save the data in the cache dictionary, using unique url identifier ## as a key and the response data as value cache_diction[unique_ident] = json.loads(resp.text)
# convert the cache dictionary to a JSON string dumped_json_cache = json.dumps(cache_diction)
# save the JSON string in the cache file fw = open(CACHE_FNAME,"w") fw.write(dumped_json_cache) fw.close() # Close the open file
# return the data return cache_diction[unique_ident]
def get_from_Guard(a): baseurl = "https://content.guardianapis.com/search" params_diction = {} params_diction["q"] = a params_diction["show-tags"]= "contributor" params_diction["api-key"] = "TakenOffDueToRestrictions"
unique_ident = params_unique_combination(baseurl,params_diction)
# see if the url identifier is already in cache dictionary if unique_ident in cache_diction: # if so, get data from cache dictionary and return return cache_diction[unique_ident]
# if not, make a new API call using the requests module else: resp = requests.get(baseurl, params_diction) # Or as: # resp = requests.get(unique_ident)
# save the data in the cache dictionary, using unique url identifier ## as a key and the response data as value cache_diction[unique_ident] = json.loads(resp.text)
# convert the cache dictionary to a JSON string dumped_json_cache = json.dumps(cache_diction)
# save the JSON string in the cache file fw = open(CACHE_FNAME,"w") fw.write(dumped_json_cache) fw.close() # Close the open file
# return the data return cache_diction[unique_ident]
cache_NYT = get_from_NYT("Rugby") cache_Guard = get_from_Guard("Rugby")
###Citation: Retrieved from Week 11 Discussion problem set
class NYT(object): def __init__(self, times_diction): self.title = times_diction["headline"]["main"].replace(",","") try: self.author = times_diction["byline"]["original"].replace("By","") except: self.author = "Not Available" try: self.subject = times_diction["news_desk"] except: self.subject = "Not Available" self.publication = "The New York Times"
def words_title(self): total_words = 0 title = self.title.split(' ') for word in title: total_words += 1 return total_words
def __str__(self): return "{},{},{},{},{}".format(self.title, self.author, self.subject, self.words_title(), self.publication)
class Guard(object): def __init__(self, guardian_diction): self.title = guardian_diction["webTitle"].replace("\r\n","") self.author = guardian_diction["tags"][0]["webTitle"] self.subject = guardian_diction["sectionName"] self.publication = "The Guardian"
def words_title(self): total_words = 0 title = self.title.split(' ') for word in title: total_words += 1 return total_words def __str__(self): return "{},{},{},{},{}".format(self.title, self.author, self.subject, self.words_title(), self.publication)
list_NYT = [] for data in cache_NYT["response"]["docs"]: list_NYT.append(NYT(data)) #print(str(list_NYT[0]))
list_Guard = [] for data in cache_Guard["response"]["results"]: list_Guard.append(Guard(data))
#print(str(list_Guard[0]))
finalprj = open("articles.csv","w") finalprj.write("Article Title, Author, Subject, Number of words in Title, Publication\n")
for data in list_NYT: data_string = str(data) finalprj.write(data_string) finalprj.write('\n')
for data in list_Guard: data_string = str(data) finalprj.write(data_string) finalprj.write('\n') finalprj.close()
###Citation: Retrieved from SI506F18_ps11.py -- problem set #11
0 notes
Text
ChatGPT - Sensordaten visualisieren

In diesem Beitrag möchte ich dir zeigen, wie du eine Python GUI von ChatGPT erzeugen lassen kannst, um Sensordaten zu visualisieren.

ChatGPT - Sensordaten visualisieren Im Beitrag Raspberry Pi Pico BASIC #6 – RealTimeClock programmieren habe ich dir eine kleine Schaltung am Raspberry Pi Pico gezeigt, wie du Sensordaten auf eine SD-Karte schreiben kannst. Die Daten werden dabei im CSV Format (getrennt durch ein Semikolon) gespeichert. In der ersten Spalte ist ein Zeitstempel und die zweite Spalte enthält den Sensorwert. 29-04-2023 18:10:26; 19.25 29-04-2023 18:10:27; 19.25 29-04-2023 18:10:28; 19.25 In einem neuen Chat Fenster von ChatGPT gebe ich nun die nachfolgende Anfrage an das System. Zusätzlich gebe ich noch die Sensordaten hinzu. Ich habe eine CSV Datei im Format: 29-04-2023 18:10:26; 19.25 29-04-2023 18:10:27; 19.25 29-04-2023 18:10:28; 19.25 29-04-2023 18:10:29; 19.25 Hier erkennt ChatGPT gleich korrekt, was ich plane und gibt mir ein kleines Pythonprogramm zum visualisieren dieser Daten. Was mir besonders gut gefällt ist, dass der Zeitstempel im korrekten Format erkannt wurde und dieser geparst wird. import csv from datetime import datetime import matplotlib.pyplot as plt timestamps = values = with open('beispiel.csv') as csvfile: reader = csv.reader(csvfile, delimiter=';') for row in reader: timestamp = datetime.strptime(row, '%d-%m-%Y %H:%M:%S') value = float(row) timestamps.append(timestamp) values.append(value) plt.plot(timestamps, values) plt.xlabel('Zeit') plt.ylabel('Werte') plt.show() Dieser Python Code erzeugt ein Liniendiagramm mit den Achsen Werte & Zeit.
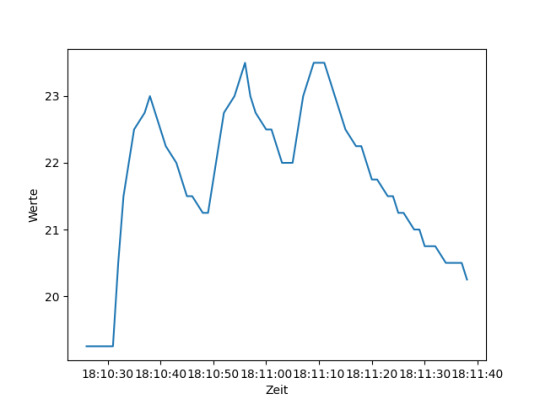
generiertes Liniendiagramm von ChatGPT zum visualisieren von Sensordaten
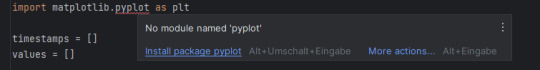
Installieren der benötigten Bibliotheken
Damit das Programm ausgeführt werden kann, muss die Bibliothek matplotlib und das Modul pyplot installiert werden. Dazu führen wir den nachfolgenden Befehl auf der Konsole aus: pip install matplotlib Wenn du die Entwicklungsumgebung PyCharm verwendest, dann kannst du auch per Kontextmenü die fehlende Bibliothek installieren.

Die GUI bzw. das Fenster selber wird von der Bibliothek matplotlib bereitgestellt.
Kompletter Chatverlauf mit ChatGPT zum visualisieren von Sensordaten
Hier jetzt der gesamte Chatverlauf mit ChatGPT zu diesem Beitrag. ChatGPT_CSV_Daten_visualisierenHerunterladen Read the full article
0 notes
Text
Beginning with Python
Starting out with the print function
Single or double quotes are acceptable as long as they’re consistent
You can use “+” to join strings together directly, or “,” to join strings together with a space between them -”\” is known as an “escape character” and it will “escape” the characteristic of the following character and just use it as plain text
Doing basic math with Python:
“+”,”-”,”*” and “/” are the basic characters for adding, subtracting, multiplying and dividing.
You can use “**” to do exponents
“%” is the ‘modulus’ operator. This operator will divide a given number by another and return the remainder from the division
abs() is the ‘absolute’ function, which will return the absolute value of a variable
pow(number, toThePowerOf) is the ‘power’ function, which will multiply the first number by the power of the second
max(number, otherNumber) simply returns the larger of the two given numbers
min(number, otherNumber) simply returns the smaller of the two given numbers
round(number) rounds the given number to the closest whole number
int(number) converts given number to an integer
Loops: The two distinctive loops in Python are the “for” and “while” loops, both of which behave in a similar manner: Repeating tasks until a condition is met. While loops continually execute until a specific condition is met, where as for loops (should) run a predetermined amount of times depending on the parameters you set.
Strings Strings are used to save list of characters as one piece of data. Useful functions to remember when using strings are: .lower()/.upper(), .islower()/.isupper(), .index(”stringToIndex”), .replace(”stringToReplace”, “replaceWith”), str(toConvertToString)
If statements: Comprised of “If”, “elif” and “else” commands are very simple to understand: IF the following statement is true, then run the following code block ELIF the previous statement isn’t true, but this one is, then run the following code block ELSE if no previous statement is true. but this one is, then fun the follow code block
Functions: Functions are sets of code and possibly variables (parameters) to a single line of text. To begin creating a function, the keyword “def” is used to notify python of the function definition:
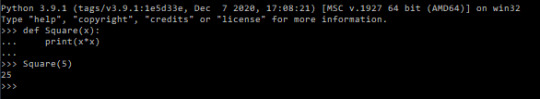
^ A very basic function
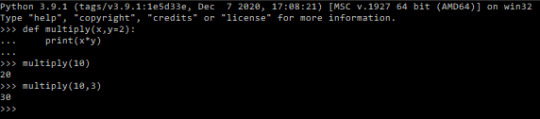
You can also set parameter defaults to make your code more customizable:
Local and Global variables:
A global variable is one that can be accessed anywhere. A local variable is the opposite, it can only be accessed within its frame. The difference is that global variables can be accessed locally, but not modified locally inherently.
File Manipulation: There are two methods for saving data to a file: “writing” and “appending”. Writing to a file will clear any previous data from the file and replace it with the information it has been told to write. Alternatively you can use the append method, which will add the information onto the end of anything that was already in the file. Files can also be read to extract data from them without changing it. To read and write to a file a variable must be established to represent the opened file:
-
Classes: Classes work as ways to store collections of functions together that can be called into other scripts. They are the backbone to Object Orientated Programming
User Input: The simplest way to collect data from a text field is the ‘input()’ method. You can provide a parameter to the method to prompt the user, eg: answer = input(”What is you answer? “)
Statistics: by importing the statistics module we get access to a wide range of useful functions:
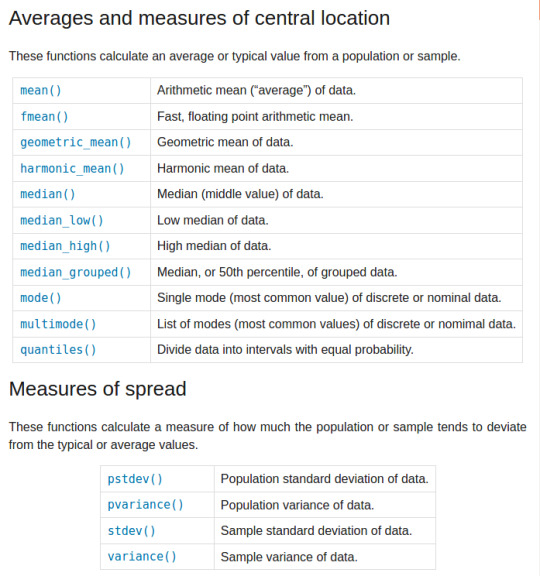
Module Import Syntax: A useful trick when importing another module is that when you import any module, you can change the name you will use to refer to it in your code. For example, to save on repeatedly typing out ‘statistics’ every time you want to call a function from that module, you can change the name to simply ‘s’ when you import the function with the ‘as’ statement: import statistics as s You can also import specific function(s) from a module with the ‘from’ statement: from statistics import mean(, median, mode) The ‘as’ and ‘from’ statements can also be used together: from statistics import mean as m, median as d Lastly we can import every function from a module to be part of our module without having to call the other module to use the function: from statistics import *
Lists and Tuples: Both used to hold sequential pieces of data, these two data structures differ mainly in that tuples are unchangeable after they have been defined. Where lists are defined by surrounding the data with []’s and separating them with commas; tuples are written in the same way but with ()’s or no brackets at all. Eg: listName = [a,b,c] tupleName = a,b,c / (a,b,c) Lists can be added to, with the append and insert functions: listName.append(valueToAdd) listName.insert(elementNum, valueToAdd) Conversely you can remove data from a list with the remove function: listName.remove(valueToRemove) It’s important to remember that using the remove function like this will remove the first instance of the data found within the list, rather removing data from a specified list element. To remove data from a specific element rather than removing a specific value, you can do: listName.remove(listName[elementToRemove]) Specifying an element in this manner will also work with other methods like print: print(listName[elementToPrint]) Additionally you can take a ‘slice’ of an index by specifying an ending position as well as the first position, like so: print(listName[firstElement : finalElement]) The first element specified will be given, however it will stop upon reaching the final element, without actually returning it. So a range of [0:2] will return only two elements (0,1) and stop upon reaching the third element (2nd position in the index). You can work backwards from the end of a list by giving negative element values. Although as there is no -0 giving -1 gives the last value of the index. print(listName[-1]) The index function can be used to find specific values within lists and their respective elements. print(listName.index(valueToFind)) The count function allows us to know how many times a specific value appears in a list: print(listName.count(valueToFind)) The sort function will arrange the information in a list to be alphabetical/numerically sorted, and the reverse function will reverse the current order of a list: listName.sort() listName.reverse() Lastly, each individual element in a list can be a list itself, referred to as being ‘multi-dimensional’: listName = [[0,1],[3,4]] print(listName) #will return “[0,1] , [3,4]” print(listName[0]) #will return “[0,1]” print(listName[1,1]) #will return “[4]”
CSV files import csv with open(”exampleFile.csv”) as csvfile: readCSV = csv.reader(csvfile, delimter=“,”)
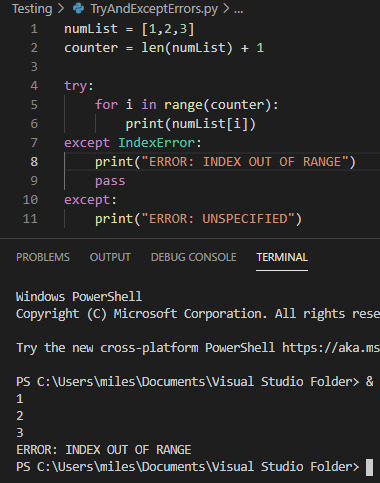
Try and Except Error handling These statements are used where you want to ‘try’ running a piece of code, but you aren’t certain it will work. For example checking a users input is in the correct data type. While this code is useless it is a simple demonstration of the try and except statements:
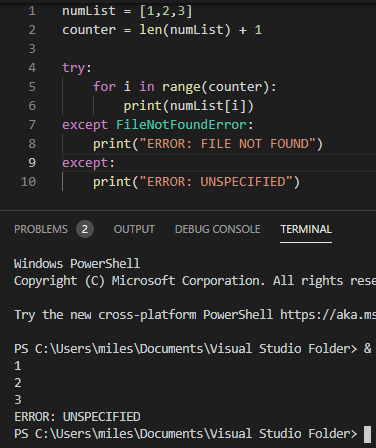
While the try statement was able to complete three stages of the foor loop before hitting an index error, it wasn’t able to continue after that and so hit an error. For the example I provided both an exception to handle a specific FileNotFoundError
0 notes
Text
Simple Product Upload in an Ecommerce Store

A simple product is a standalone item that isn't part of a product variation (like different sizes or colors).
Steps to upload a simple product:
Log in to your admin panel: Access your ecommerce platform's backend.
Navigate to products: Find the section for adding or managing products.
Create a new product: Start the process of adding a new product.
Fill in basic details: Input the product name, description, price, SKU (Stock Keeping Unit), and category.
Add images: Upload relevant product images.
Set inventory: Specify the quantity available in stock.
Choose attributes: If applicable, assign attributes like color, size, or material.
Set shipping options: Determine shipping costs, methods, and delivery times.
SEO optimization: Add keywords and meta descriptions to improve search engine visibility.
Publish or save: Make the product visible to customers or save it as a draft.
#ecommerce#ecommercestore#productupload#simpleproductupload#productlisting#variableproduct#csvfile#productimport#productexport#wordpresswoocommerce#wordpress
0 notes
Link
Generally, To Customer details is a difficult task but in Magento it’s quite easy. Magento 2 Provides a facility to import and export customers and the data by uploading the CSV file to your store. In this tutorial article, I will explain How to Import and Export Customers in Magento 2.
0 notes
Text
MySQL: Import CSV, not using LOAD DATA
All over the Internet people are having trouble getting LOAD DATA and LOAD DATA LOCAL to work. Frankly, do not use them, and especially not the LOCAL variant. They are insecure, and even if you get them to work, they are limited and unlikely to do what you want. Write a small data load program as shown below. Not using LOAD DATA LOCAL The fine manual says: The LOCAL version of LOAD DATA has two potential security issues: Because LOAD DATA LOCAL is an SQL statement, parsing occurs on the server side, and transfer of the file from the client host to the server host is initiated by the MySQL server, which tells the client the file named in the statement. In theory, a patched server could tell the client program to transfer a file of the server’s choosing rather than the file named in the statement. Such a server could access any file on the client host to which the client user has read access. (A patched server could in fact reply with a file-transfer request to any statement, not just LOAD DATA LOCAL, so a more fundamental issue is that clients should not connect to untrusted servers.) In a Web environment where the clients are connecting from a Web server, a user could use LOAD DATA LOCAL to read any files that the Web server process has read access to (assuming that a user could run any statement against the SQL server). In this environment, the client with respect to the MySQL server actually is the Web server, not a remote program being run by users who connect to the Web server. The second issue in reality means that if the web server has a suitable SQL injection vulnerability, the attacker may use that to read any file the web server has access to, bouncing this through the database server. In short, never use (or even enable) LOAD DATA LOCAL. local_infile is disabled in the server config, and you should keep it that way. client libraries are by default compiled with ENABLED_LOCAL_INFILE set to off. It can still be enabled using a call to the mysql_options() C-API, but never do that. 8.0.21+ places additional restrictions on this, to prevent you from being stupid (that is, actually enabling this anywhere). Not using LOAD DATA The LOAD DATA variant of the command assumes that you place a file on the database server, into a directory in the file system of the server, and load it from there. In the age of “MySQL as a service” this is inconvenient to impossible, so forget about this option, too. If you were able to do place files onto the system where your mysqld lives, your user needs to have FILE as a privilege, a global privilege (GRANT FILE TO ... ON *.*) the server variable secure_file_priv needs to be set to a directory name, and that directory needs to be world-readable. LOAD DATA and SELECT INTO OUTFILE work only with filenames below this directory. Setting this variable requires a server restart, this is not a dynamic variable (on purpose). Note that the variable can be NULL (this is secure in the sense that LOAD DATA is disabled) or empty (this is insecure in that there are no restrictions). There is nothing preventing you from setting the variable to /var/lib/mysql or other dumb locations which would expose vital system files to load and save operations. Do not do this. Also, a location such as /tmp or any other world-writeable directory would be dumb: Use a dedicated directory that is writeable by the import user only, and make sure that it is world-readable in order to make the command work. Better: Do not use this command at all (and set secure_file_priv to NULL). Using data dump and load programs instead We spoke about dumping a schema into CSV files in Export the entire database to CSV already. To complete the discussion we need to provide a way to do the inverse and load data from a CSV file into a table. The full code is in load.py. The main idea is to open a .csv file with csv.reader, and then iterate over the rows. For each row, we execute an INSERT statement, and every few rows we also COMMIT. In terms of dependencies, we rely on MySQLdb and csv: import MySQLdb import csvWe need to know the name of a table, and the column names of that table (in the order in which they appear). We should also make sure we can change the delimiter and quoting character used by the CSV, and make the commit interval variable. Finally, we need to be able to connect to the database. # table to load into table = "data" # column names to load into columns = [ "id", "d", "e", ] # formatting options delimiter = "," quotechar = '"' # commit every commit_interval lines commit_interval = 1000 # connect to database, set mysql_use_results mode for streaming db_config = dict( host="localhost", user="kris", passwd="geheim", db="kris", )From this, we can build a database connection and an INSERT statement, using the table name and column names: db = MySQLdb.connect(**db_config) # build a proper insert command cmd = f"insert into {table} ( " cmd += ", ".join(columns) cmd += ") values (" cmd += "%s," * len(columns) cmd = cmd[:-1] + ")" print(f"cmd = {cmd}")The actual code is then rather simple: Open the CSV file, named after the table, and create a csv.reader(). Using this, we iterate over the rows. For each row, we execute the insert statement. Every commit_interval rows we commit, and for good measure we also commit after finishing, to make sure any remaining rows also get written out. with open(f"{table}.csv", "r") as csvfile: reader = csv.reader(csvfile, delimiter=delimiter, quotechar=quotechar) c = db.cursor() counter = 0 # insert the rows as we read them for row in reader: c.execute(cmd, row) # ever commit_interval we issue a commit counter += 1 if (counter % commit_interval) == 0: db.commit() # final commit to the remainder db.commit()And that it. That’s all the code. No FILE privilege, No special permissions besides insert_priv into the target table. No config in the database. No server restart to set up the permissions. And using Python’s multiprocessing, you could make it load multiple tables in parallel or chunk a very large table and load that in parallel - assuming you have database hardware that could profit from any of this. In any case - this is simpler, more secure and less privileged than any of the broken LOAD DATA variants. Don’t use them, write a loader program. Let’s run it. First we generate some data, using the previous example from the partitions tutorial: (venv) kris@server:~/Python/mysql$ mysql-partitions/partitions.py setup-tables (venv) kris@server:~/Python/mysql$ mysql-partitions/partitions.py start-processing create p2 reason: not enough partitions cmd = alter table data add partition ( partition p2 values less than ( 20000)) create p3 reason: not enough partitions cmd = alter table data add partition ( partition p3 values less than ( 30000)) create p4 reason: not enough partitions cmd = alter table data add partition ( partition p4 values less than ( 40000)) create p5 reason: not enough partitions cmd = alter table data add partition ( partition p5 values less than ( 50000)) create p6 reason: not enough empty partitions cmd = alter table data add partition ( partition p6 values less than ( 60000)) counter = 1000 counter = 2000 counter = 3000 counter = 4000 ^CError in atexit._run_exitfuncs: ...We then dump the data, truncate the table, and reload the data. We count the rows to be sure we get all of them back. (venv) kris@server:~/Python/mysql$ mysql-csv/dump.py table = data (venv) kris@server:~/Python/mysql$ mysql -u kris -pgeheim kris -e 'select count(*) from data' mysql: [Warning] Using a password on the command line interface can be insecure. +----------+ | count(*) | +----------+ | 4511 | +----------+ (venv) kris@server:~/Python/mysql$ mysql -u kris -pgeheim kris -e 'truncate table data' mysql: [Warning] Using a password on the command line interface can be insecure. (venv) kris@server:~/Python/mysql$ mysql-csv/load.py cmd = insert into data ( id, d, e) values (%s,%s,%s) (venv) kris@server:~/Python/mysql$ mysql -u kris -pgeheim kris -e 'select count(*) from data' mysql: [Warning] Using a password on the command line interface can be insecure. +----------+ | count(*) | +----------+ | 4511 | +----------+ https://isotopp.github.io/2020/09/28/mysql-import-csv-not-using-load-data.html
0 notes
Photo

NTLMRecon – Enumerate Information From NTLM Authentication #archlinux #authentication #blackarch #csvfile #enabled #hacker #hacking #cybersecurity #hackers #linux #ethicalhacking #programming #security #mrhacker
0 notes
Text
Assignment week 4
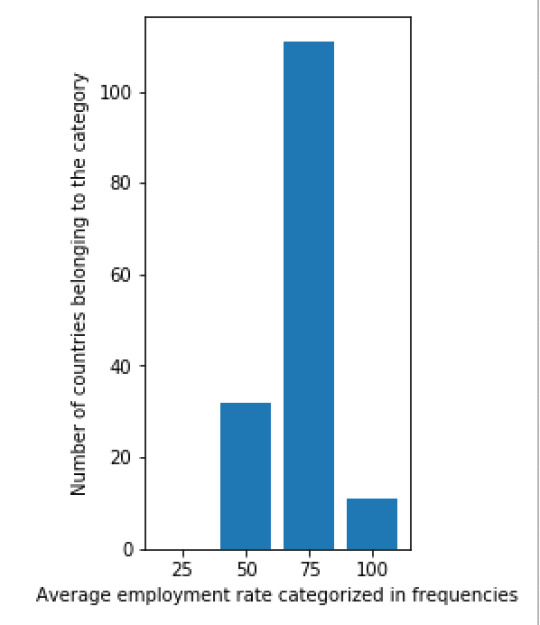
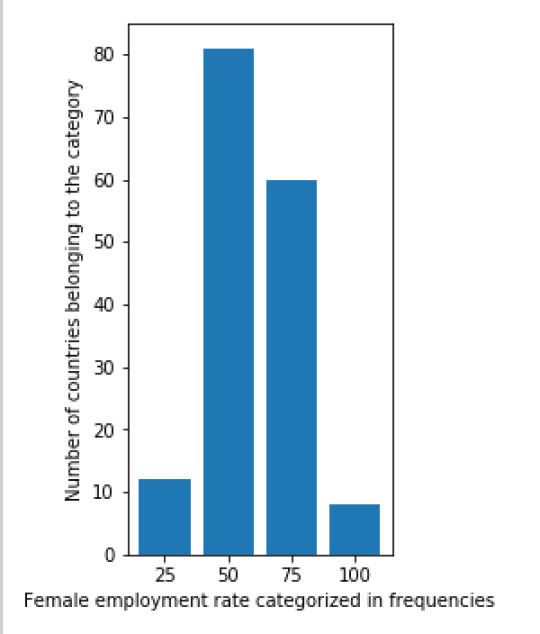
For this week’s assignment I created three univariate graphs of three different variables from the gap minder dataset. The three variables I used are: the female employment rate, regular employment rate and average life expectancy.
The univariate graphs were created in Python by first creating frequency categories and then plotting these categories in a graph. The code I used for this is:
import csv import matplotlib.pyplot as plt from matplotlib.ticker import NullFormatter # useful for `logit` scale
with open('gapminder.csv') as csvfile: readCSV = csv.reader(csvfile, delimiter=',') testlist = list(readCSV)
for row in testlist: #Removing white spaces between rows of information if(len(row) == 0): testlist.remove(row)
female_employement_rate_25 = 0 female_employement_rate_50 = 0 female_employement_rate_75 = 0 female_employement_rate_100 = 0
for row in testlist[1:]: #Selecting all rows but first row if(len(row[6]) > 2): #Skipping all empty rows of information about female employement rate if(float(row[6]) <= float(25)): female_employement_rate_25 += 1 elif(float(row[6]) <= float(50)): female_employement_rate_50 += 1 elif(float(row[6]) <= float(75)): female_employement_rate_75 += 1 else: female_employement_rate_100 += 1
barnames_female_employementrate = ["25", "50" , "75", "100"] barvalues_female_employementrate = [female_employement_rate_25,female_employement_rate_50,female_employement_rate_75,female_employement_rate_100]
lifeexpectancy_age_25 = 0 lifeexpectancy_age_50 = 0 lifeexpectancy_age_75 = 0 lifeexpectancy_age_100 = 0
for row in testlist[1:]: # Selecting all rows but first row if (len(row[9]) > 2): # Skipping all empty rows of information about the life expectancy rate if (float(row[9]) <= float(25)): lifeexpectancy_age_25 += 1 elif (float(row[9]) <= float(50)): lifeexpectancy_age_50 += 1 elif (float(row[9]) <= float(75)): lifeexpectancy_age_75 += 1 else: lifeexpectancy_age_100 += 1
barnames_lifeexpectancy = ["25", "50" , "75", "100"] barvalues_lifeexpectancy = [lifeexpectancy_age_25, lifeexpectancy_age_50, lifeexpectancy_age_75, lifeexpectancy_age_100]
employement_rate_25 = 0 employement_rate_50 = 0 employement_rate_75 = 0 employement_rate_100 = 0
for row in testlist[1:]: if(len(row[14]) >2): if (float(row[14]) <= float(25)): employement_rate_25 += 1 elif (float(row[14]) <= float(50)): employement_rate_50 += 1 elif (float(row[14]) <= float(75)): employement_rate_75 += 1 else: employement_rate_100 += 1
barnames_employement_rate = ["25", "50" , "75", "100"] barvalues_employement_rate = [employement_rate_25, employement_rate_50, employement_rate_75, employement_rate_100]
plt.figure(figsize=(12,5)) #Defining the size of the window that will display the graphs
plt.subplot(131) plt.bar(barnames_female_employementrate, barvalues_female_employementrate) plt.ylabel('Number of countries belonging to the category') plt.xlabel('Female employment rate categorized in frequencies')
plt.subplot(132) plt.bar(barnames_lifeexpectancy, barvalues_lifeexpectancy) plt.ylabel('Number of countries belonging to the category') plt.xlabel('Average life expectancy categorized in frequencies')
plt.subplot(133) plt.bar(barnames_employement_rate, barvalues_employement_rate) plt.ylabel('Number of countries belonging to the category') plt.xlabel('Average employment rate categorized in frequencies')
plt.suptitle('Bar graphs')
plt.gca().yaxis.set_minor_formatter(NullFormatter()) plt.subplots_adjust(top=0.92, bottom=0.1, left=0.10, right=0.95, hspace=0.5, wspace=1) #Added padding so that the graphs and their text display correctly plt.show()
The result of this code is:

Next, I also created a scatterplot that plots the relation between he female employment rate and average life expectancy. I was surprised by the results of this graph. There is no (linear) relation between the two variables. From the literature review done in the first week, I would have assumed that there would be a positive relation between the variables. Namely, a higher female employment rate would lead to a higher life expectancy. When more people work in a country they earn more money, thus have a higher disposable income as a family and can spend more on better food, education and healthcare. These factors would then again have a positive impact on life expectancy. The scatterplot shows that this assumption is false. It would be interesting to research this further.
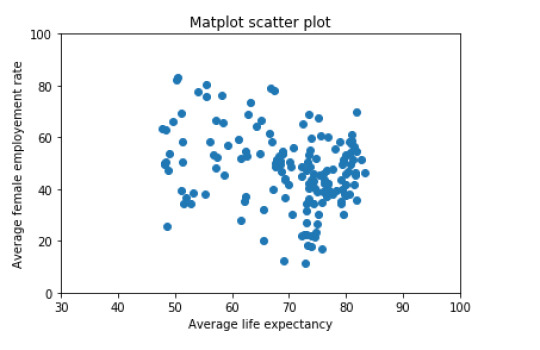
The scatterplot was already created by Python with the following code:
import matplotlib.pyplot as plt import csv
with open('gapminder.csv') as csvfile: readCSV = csv.reader(csvfile, delimiter=',') testlist = list(readCSV)
for row in testlist: # Removing white spaces between rows of information if (len(row) == 0): testlist.remove(row)
scattervalues_female_employement_rate = []
for row in testlist[1:]: # Selecting all rows but first row if (len(row[6]) > 2 and len(row[9]) > 2): # Skipping all empty rows of information about the life expectancy rate and female employement rate scattervalues_female_employement_rate.append(float(row[6]))
scattervalues_lifeexpectancy = []
for row in testlist[1:]: # Selecting all rows but first row if (len(row[9]) > 2 and len(row[6]) > 2): # Skipping all empty rows of information about the life expectancy rate and female employement rate scattervalues_lifeexpectancy.append(float(row[9]))
x = scattervalues_lifeexpectancy y = scattervalues_female_employement_rate
fig = plt.figure() ax = fig.add_subplot(1,1,1) ax.scatter(x,y) ax.set(xlim=(30, 100), ylim=(0, 100)) #Setting the scale for the plot, xlim = life expectancy scale, ylim = female employement rate scale plt.ylabel("Average female employement rate") plt.xlabel("Average life expectancy") plt.title('Matplot scatter plot') plt.show()
0 notes
Text
Amazon DynamoDB CSV Import
Assuming you have a CSV file in this format:
ABC,ABC Description
DEF,DEF Description
This little Python script will convert it to a file format that you can then import with an AWS Data Pipeline, using S3 as a source. Tumblr formatting of code isn’t very helpful, so a screenshot too:

Git code.
#CSV import format # AAPL, Apple
# Format for DynamoDB # {"id":{"s":"AAPL"},"description":{"s":"Apple"}} # {"id":{"s":"AMD"},"description":{"s":"AMD"}}
import csv
filename = 'data.csv' outputfilename = 'dynamodbimport'
with open(filename) as csvfile: reader = csv.reader(csvfile, delimiter=',')
outputfile = open(outputfilename, 'w')
for line in reader: print (line) outputfile.write("{\"id\":{\"s\":\"" + line[0] + "\"},\"description\":{\"s\":\""+ line[1] + "\"}}" + "\n")
1 note
·
View note
Link
A CSV file is a “comma-separated values” file. In plain English, this is a text file that contains an unusually large amount of data. More often than not, this is used in order to create databases of information, where each unit of data is separated by a comma. Hence the name!
Being able to manipulate, load, and store large amounts of data is a hugely beneficial skill when programming. This is particularly true in Python, seeing as Python is such a popular option for machine learning and data science.
Read on then, and we’ll explore how to read CSV files in Python!
How to read CSV files in Python by importing modules
To get started, we’re first going to create our CSV file.
You can do this in Excel by creating a simple spreadsheet and then choosing to save it as a CSV file. I made a little list of exercises, which looks like so:
Credit: Adam Sinicki/ Android Authority
If we open this up as a text file, we see it is stored like this:
Type of Exercise,Sets and Reps,Weight Bench press,3 x 3,120kg Squat,3 x 3,100kg Deadlift,3 x 3,150kg Curls,3 x 5,25kg Bent rows,3 x 5,80kg Military press ,3 x 5,60kg
The top line defines the values, and each subsequent line includes three entries!
So, how do we open this in Python? Fortunately, there is no need to build a CSV parser by scratch! Rather, we can simply use ready-made modules. The one we’re interested in is called, you guessed it, CSV!
We do that like so:
import csv
Now, we can open the CSV file and print that data to the screen:
with open('c:\\Python\\Exercises.csv') as csv_file: csvFile = csv.reader(csv_file, delimiter=',') for row in csvFile: print(row)
We can also split the data if we want to do fancy things with it:
for row in csvFile: if lineCount > 0: print(f'Perform {row[0]} for {row[1]} sets and reps, using {row[2]}.') lineCount += 1
As you can see, this will simply run through the file, extract each piece of data, and then write it out in plain English.
Or, what if we want to pull out a specific row?
for row in csvFile: if lineCount == 2: print(f'Perform {row[0]} for {row[1]} sets and reps, using {row[2]}.') lineCount += 1
Finally, what if we want to write to a CSV file? In that case, we can use the following code:
with open('C:\\Python\\Exercises2.csv', mode='w') as trainingRoutine: trainingRoutine = csv.writer(trainingRoutine, delimiter=',', quotechar='"', quoting=csv.QUOTE_MINIMAL) trainingRoutine.writerow(['Exercise', 'Sets and Reps', 'Weight']) trainingRoutine.writerow(['Curls', '3 x 5', '25kg']) trainingRoutine.writerow(['Bench Press', '3 x 3', '120kg'])
How to open CSV files in Python manually
Remember that a CSV file is actually just a text document with a fancy formatting. That means that you actually don’t need to use a module if you want to know how to open CSV files in Python!
Also read: How to become a data analyst and prepare for the algorithm-driven future
You can quite simply write to a text file like so:
myFile = open("Exercises3.csv", "w+") myFile.write("Exercise,Sets and Reps,Weight\nCurls,3 x 5,25kg\nBench Press,3 x 3,120kg") myFile.close()
This actually makes it fairly simple to take the contents of a list, dictionary, or set, and turn them into a CSV! Likewise, we could read our files in a similar way and then simply break the data down by looking for commas. The main reason not to do this, is that some CSV files will use slightly different formating, which can cause problems when opening lots of different files. If you’re just working with your own files though, then you’ll have no trouble!
Also read: How to read a file in Python and more
And there you have it: now you know how to open CSV files in Python! And with that, you’ve dabbled in your first bit of JSON development and even a bit of data science. Feel proud!
What are you going to do with this knowledge? Let us know in the comments below! And if you want to learn more skills like this, then we recommend checking out our list of the best online Python courses. There you’ll be able to further your education with courses like the Python Data Science Bundle. You can get it for $37 right now, which is a huge saving on the usual $115.98!
source https://www.androidauthority.com/how-to-open-csv-file-python-1140486/
0 notes
Text
NTLMRecon - Enumerate Information From NTLM Authentication
NTLMRecon - Enumerate Information From NTLM Authentication #ArchLinux #Authentication #blackarch #CSVFile #Enabled
[sc name=”ad_1″]
A fast and flexible NTLM reconnaissance tool without external dependencies. Useful to find out information about NTLM endpoints when working with a large set of potential IP addresses and domains.
NTLMRecon is built with flexibilty in mind. Need to run recon on a single URL, an IP address, an entire CIDR range or combination of all of it all put in a single input file? No…
View On WordPress
#Arch Linux#Authentication#blackarch#CSV File#Enabled#Endpoints#Enumerate#Enumeration#Information#nmap#NTLM#NTLMRecon#NTLMSP#OSINT#python#tool#web
0 notes