#ChartTypes
Explore tagged Tumblr posts
Visit Tumblr Blog
Explore Tumblr blogs with no restrictions, modern design and the best experience.
Last Seen Tumblr Blogs


Fun Fact
Tumblr.com rank in the US is 25.
Text
Best Graph Making Tools

Follow @everythingaboutbiotech for informative and useful stuff ✨
#DataViz#DataVisualization#Graphs#Charts#DataGraphs#GraphDesign#Infographics#DataAnalytics#ChartTypes#BarChart#PieChart#LineGraph#GraphSoftware#ExcelCharts#TableauViz#DataStorytelling#FlowChart#OrgChart#Data#Analytics#Numbers#Statistics#DataScience#BigData#Dashboard
8 notes
·
View notes
Text
What Are Types of Data Visualization? Explained Simply
Data visualization comes in various types, each serving different analytical purposes. Common forms include bar charts for comparing categories, line charts for showing trends over time, and pie charts for illustrating proportions. Scatter plots help identify correlations, while heatmaps reveal intensity or density in data. Choosing the right visualization type enhances clarity, insight, and decision-making Read More..

0 notes
Text
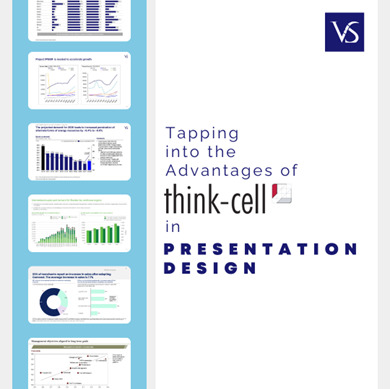
Choosing the Right Chart Type: Navigating the Pros and Cons of Area Charts
Data Visualization – Charts, Graphs and Infographic designs - ThinkCell: Common Questions Answered
1.What is the disadvantages of area chart?
Area charts can be misleading when visualizing data because overlapping areas can obscure important information. They may also exaggerate trends due to the filled space, making it harder to compare individual data series accurately. Additionally, they can become cluttered with too many data sets, reducing clarity and making interpretation challenging for viewers.
2. What is the difference between an area chart and a column chart?
An area chart displays quantitative data over time, emphasizing the magnitude of values through filled areas beneath the lines, making it easier to visualize trends. A column chart represents data with vertical bars, comparing discrete categories. While both show changes over time, area charts focus on volume, while column charts focus on individual category comparisons.
3. Which chart is similar to area chart?
A chart similar to an area chart is the stacked area chart. Both display data trends over time, but the stacked area chart shows multiple data series stacked on top of each other, highlighting the contribution of each series to the total. Both charts effectively visualize cumulative totals and trends, making them useful for comparing parts of a whole.
4. What are the advantages of area chart?
Area charts visually represent data over time, highlighting trends and changes effectively. They show the magnitude of values through the area under the line, making it easy to compare different data series. Area charts also provide a clear depiction of cumulative totals, helping to illustrate how parts contribute to a whole, and are visually engaging for audiences.
5. What is the difference between area and stacked area chart?
An area chart displays quantitative data over time, using filled areas below the line to show trends. A stacked area chart, on the other hand, shows multiple data series stacked on top of each other, illustrating the contribution of each series to the total over time. This highlights both the total and individual parts of the data.
Visit: VS Website See: VS Portfolio
#DataVisualization#AreaChart#ChartTypes#DataAnalysis#StackedAreaChart#DataInsights#VisualizationTools
0 notes
Text
When to Use a Histogram vs. a Bar Chart: A Comprehensive Guide

Histograms and Bar Charts
Histograms and bar charts are the most commonly used tools for visualizing data. While they might appear to be similar, they have very distinct roles and are used in different scenarios. Understanding the disparities between histograms and bar charts is important for correctly conveying information and deriving relevant insights from data. In this guide, we’ll delve deep into several aspects of histograms and bar charts, focusing on their characteristics, applications, and appropriate usage.
Part 1 – Histograms vs. Bar Charts: Unveiling the Distinctions
Histograms:
A histogram is a graph that shows how numerical data is distributed. Unlike bar charts, which show data in categories, histograms are made specially to show data sequentially. They are made up of continuous rectangles, each of which stands for a distinct range of values, whose height reflects the frequency of observations.

Key Features of Histograms:
Continuous Data Representation: For displaying data that falls on a continuous numerical scale, like age, height, or temperature, histograms are perfect.
Frequency Distribution: In a histogram, the height of each rectangle denotes the number or frequency of data inside that bin.
Bins: The data range is divided into intervals by bins, and each interval is shown in the histogram as a rectangle. Depending on the intended level of granularity and the distribution of the data, the bins’ widths may change.
No Gaps Between Bars: Because the data in a histogram is continuous, there are never any gaps between the bars. To show that the data is continuous, the bars are in contact with one another.
Applications of Histograms:
Analysing Distribution Patterns:
The purpose of Histograms serves in statistical analysis for visualizing the distribution of data and identifying patterns such as normal distribution, skewed distribution, or bimodal distribution.
Determining Central Tendency and Dispersion:
Histograms evaluate measures of central tendency (mean, median, mode) and dispersion (variance, standard deviation) within a dataset.
Detecting Outliers:
Outliers are anomalous data points which can be easily identified on a histogram, aiding in data cleaning processes and outlier detection.
Bar Charts:
Bar charts are graphical depictions of categorical data. They are made up of rectangular bars, each of whose height or length indicating the frequency or volume of the data it represents. In contrast to histograms, which show continuous data, bar charts are meant to show distinct groupings or categories.

Key Features of Bar Charts:
Categorical Data Representation:
For visualizing categorical data, such as product categories, demographic groups, and survey results, bar charts are perfect.
Discrete Categories:
Each bar represents a separate group, and the length of the bar is the value or frequency associated of that category.
Equal Width Bars:
The bars in a bar chart usually have the same width and are divided by regular gaps to distinguish between different categories, unlike histograms where the width of the bins might vary.
Non-Overlapping Bars:
In a bar chart, the bars are typically spaced apart and do not touch each other, as they represent distinct categories.
Applications of Bar Charts:
Comparing Categories:
Bar charts are useful for comparing the frequency, magnitude, or proportion of different categories within a dataset.
Tracking Changes Over Time:
Bar charts can be used to study changes in categorical data with time, such as sales performance and review by month or demographic changes in each period.
Presenting Survey Results:
Bar charts are ideal for survey responses or categorical data collected from research studies mainly for easy interpretation and analysing results.
Expanding further on the topic of histograms and bar charts, let’s delve even deeper understanding how they are constructed, how to perceive them best, and other situations in which each visualization technique comes in handy.
Construction of Histograms:
The range of continuous data is first divided into intervals or bins to generate histograms. In order to appropriately maintain the level of granularity while accurately representing the underlying distribution of the data, these bins should be carefully selected. Choosing too few bins can cause simplicity and the loss of crucial information, while choosing too many bins can cause noise and make interpretation more challenging.
The frequency or count of observations falling within each bin is estimated after the bins have been established. The height of the matching rectangle in the histogram then represents this frequency. To maintain the integrity of the representation, it is imperative that the area of every rectangle precisely represents the frequency within the bin.

Best Practices for Interpreting Histograms:
While analysing histograms, one studies the shape, center, and spread of the distribution, as well as identifies any outliers or unusual patterns. Key considerations include:
Distribution Shape:
Histograms can take on different forms, such as multimodal (having multiple peaks), skewed (having a positive or negative skew), or symmetric (normal distribution). Knowing the distribution’s shape helps guide further analysis and offers insights into the underlying features of the data.
Central Tendency and Spread:
The typical or core value of the data is shown by central tendency measures like the mean, median, and mode. Furthermore, quantifying the variability within the dataset is aided by evaluating the spread or dispersion of the data using metrics like variance or standard deviation.
Outlier Detection:
Data points known as outliers, or those that differ noticeably from the rest of the data, can skew statistical analysis and have an impact on how results are interpreted. By graphically emphasizing observations that deviate from the predicted range or distribution pattern, histograms aid in the detection of outliers.
Construction of Bar Charts:
Rectangular bars are plotted along the y-axis to show the frequency, amplitude, or proportion of each discrete category or group. This is how bar charts are created. Each bar’s height or length is correlated with the value assigned to that category, making it simple to compare several categories.
To aid with comprehension, it is crucial to make sure that the categories in bar charts are labelled and arranged correctly. In addition, careful consideration should go into selecting the y-axis’s scale to maximize readability and appropriately depict the data.

Source
Best Practices for Interpreting Bar Charts:
While studying bar charts one should analyse the heights or lengths of the bars to assess the relative frequency or magnitude of each category. Key considerations include:
Comparing Categories:
Bar charts are a useful tool for comparing data across various groups or categories in a dataset. By visually examining the heights or lengths of the bars, analysts can rapidly spot trends, patterns, or inequalities.
Identifying Patterns Over Time:
By comparing variations in bar heights over time, analysts can spot trends, seasonality, or anomalies in situations where bar charts are used to depict categorical data over time, such as sales performance by month or demographic alterations over several years.
Communicating Results Effectively:
To guarantee understanding, it’s critical to include clear labels, titles, and annotations when presenting bar charts to stakeholders or decision-makers. Using color, patterns, or annotations can also improve the visual appeal and provide more details or insights.
Additional Scenarios Where Each Visualization Method Is Invaluable:
Although bar charts and histograms are frequently used in statistical analysis and data presentation, there are other situations in which each technique is quite useful:
Histograms in Quality Control:
In quality control procedures, histograms are widely used to evaluate the distribution of product attributes, including dimensions or performance measures. Manufacturers can spot deviations from requirements and take corrective action to preserve product quality by examining the distribution of measured values.
Bar Charts in Market Research:
When it comes to illustrating survey results, client preferences, or market segmentation data, bar charts play a crucial role in market research studies. Market researchers can determine consumer trends, preferences, and market prospects by clearly and concisely presenting category data.
Combined Use for Comprehensive Analysis:
Combining bar charts and histograms might occasionally result in a more thorough knowledge of the data. Histograms, for instance, can be used by analysts to investigate the distribution of continuous variables inside the many categories shown in a bar chart, providing a more in-depth understanding of the connections between the variables.
Conclusion
Histograms are most suited for showing the distribution of continuous numerical data, but bar charts are more effective in illustrating categorical data and making comparisons between various groups or categories. Data analysts, researchers, and decision-makers can effectively use these visualization approaches to obtain insights, make educated decisions, and clearly convey findings if they grasp the differences between bar charts and histograms.
For more related blogs visit: EzInsights AI
0 notes
Photo
0 notes
Text
$CBDD Chart$ This is set for a big move
$CBDD Chart$ This is set for a big move with New any day now! Starting with the updated fillings on the OTC Markets with the 4th Quarter financials. $CBDD company news is gonna be right behind it! More Products? A possible acquisition in the works? Cleaner balance sheet? A lot more attention? Advertising? https://www.stockscores.com/chart.asp?TickerSymbol=CBDD&TimeRange=180&Interval=d&Volume=1&ChartType=CandleStick&Stockscores=1&ChartWidth=1100&ChartHeight=480&LogScale=None&Band=None&avgType1=None&movAvg1=&avgType2=None&movAvg2=&Indicator1=RSI&Indicator2=MACD&Indicator3=AccDist&Indicator4=None&endDate=&CompareWith=&entryPrice=&stopLossPrice=&candles=redgreen http://dlvr.it/R0qQBL
0 notes
Text
9 - Zoll - Handtasche Reißverschlüsse
9 – Zoll – Handtasche Reißverschlüsse
Diese Auflistung ist für TEN (10) 9 Zoll YKK Handtaschen-Reißverschlüsse in jeder beliebigen Farbkombination in der Farbkarte. Menge: 10 StückFarbe: 10 Reißverschlüsse in jeder beliebigen Farbkombination aus dem chartType: Geschlossener Boden Reißverschlussteil Reißverschluss Spulenlänge: 9 Zoll (ca. 23 cm)Gesamtreißverschlusslänge: 10,5 Zoll (ca. 26 Zoll)
View On WordPress
0 notes
Text
Cannex Capital Holdings Announces Substantial Financial Results
Cannex Capital Holdings Inc (CNSX:CNNX) (OTCMKTS:CNXXF) announced impressive financials today. The low profile Washington and California-based operator reported revenue and adjusted EBITDA increases that have few peers in the cannabis sector. We explore further.
This morning, Cannex released numbers regarding its Q1 2019 financial results ended July 31st, 2018. These were of the audited variety, in accordance with International Financial Reporting Standards (IFRS). The results, as mentioned, should garner some attention.
Revenues—generated primarily by way of packaging sales and rental income—increased 223% to $3,400,435 in Q1 2019, compared to $1,528,341 for the comparative period. Income for the period was $2,428,507 ($.01 per share) versus a loss of $403,027. Adjusted EBITDA increased 73% to $1,780,832 for Q1 2019, as compared to $983,186 for the prior corresponding period.
While these numbers signal robust growth, it’s important to note that due to the company’s change in fiscal year end, the quarterly numbers only included two months of operations instead of three. Thus, the YoY comparables look more impressive than might otherwise be the case. Still, the vigorous growth is clearly indicating that Cannex is making a significant dent in the marketplaces in which they operate.
youtube
Cannex Capital Group CEO Anthony Dutton shares news of the company’s strong financials based on revenue generated from its holding company, Northwest Cannabis Solutions
The next milestone in-wait for Cannex is the closing of the Jetty Extracts (Ametrine Wellness Inc.) announced in April. The acquisition of the popular Oakland-based edibles operator is still pending months after the binding letter agreement was reached. Today, the company also revealed it had executed an amendment to the previously‐signed accord, extending it until October 15, 2018. No assurances were given that the transaction will actually follow through as proposed—or at all.
Apparently, some additional due diligence was required, however Cannex CEO Anthony Dutton revealed that the acquisition was “still on track… there are no issues other than just the typical things you would expect to see around a complex, cross-border transaction” as early as September. The pending transaction would qualify as among the most material events the company’s short history, should it close.
Midas Letter will have further coverage on Cannex Capital Holdings as further events warrant.
Original article: Cannex Capital Holdings Announces Substantial Financial Results
©2018 Midas Letter. All Rights Reserved.
source https://midasletter.com/2018/10/cannex-capital-holdings-announces-substantial-financial-results/
0 notes
Text
Short tip. Google Sheets Sparklines — color each bar in a column chart
Short tip. Google Sheets Sparklines — color each bar in a column chart
Hey, here’s a visualisation in sheets:
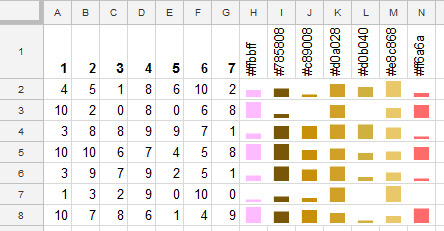
Everyday of the week is assigned a colour.
Colors are made with the function SparkLine.
Ho to
The formula for H1 (copy down and right) is:
=SPARKLINE(A2,{"charttype","column"; "firstcolor", H$1; "ymin", yMin; "ymax", yMax})
where
yMin is:
=MIN(dataRange)
yMax is:
=MAX(dataRange)
dataRange is range A2:G8 for my sample.
References
Colors used are
#ffbbff #78…
View On WordPress
0 notes
Text
Interpreting Stacked Combo Charts: Insights into Multiple Data Series
Data Visualization: Top Questions Answered
1.How do you make a stacked combo chart?
To create a stacked combo chart, first select your data in a spreadsheet program like Excel. Then, insert a combo chart from the chart options. Choose one series to be stacked (e.g., column) and another to be displayed as a line or another type. Adjust the chart elements as needed for clarity and visual appeal.
2. What are the disadvantages of stacked charts?
Stacked charts can make it difficult to accurately compare individual data series, as the total height obscures the contributions of each category. They can also become cluttered with too many data points, leading to confusion. Additionally, interpreting trends over time can be challenging, particularly if the categories have varying magnitudes or if there are many layers.
3. What type of graph is stacked?
A stacked graph, commonly used in data visualization, displays multiple data series on top of one another. This type includes stacked bar graphs and stacked area charts. Each segment represents a part of the whole, allowing viewers to see both the total values and the composition of each category over time or across different groups.
4. What is the difference between stacked and 100 stacked charts?
A stacked chart displays the total of different categories stacked on top of one another, showing how each category contributes to the whole. A 100% stacked chart, however, normalizes the values to show the percentage of each category relative to the total, making it easier to compare the proportions across different groups without considering the actual values.
5. How to read a stacked line graph?
To read a stacked line graph, start by examining the overall trend indicated by the top line, which represents the total value. Each segment below shows the contribution of different categories to that total. Pay attention to the colors or patterns used for each category and look at the vertical axis for scale to understand the values represented.

Visit: VS Website See: VS Portfolio
0 notes
Text
The Role of Line Graphs and Histograms in Visualizing Trends and Distributions
1.What is the formula for pie chart?
There isn't a specific formula for a pie chart itself, but to create one, you need to calculate the percentage of each category relative to the total. The formula for each slice is: (Category Value / Total Value) × 360° to find the angle for that slice. The total of all angles in a pie chart is always 360 degrees.
2. How to explain a bar chart?
To explain a bar chart, start by identifying the axes: the horizontal axis typically represents categories, while the vertical axis shows values. Describe the bars' heights or lengths, which indicate the quantity for each category. Highlight any trends or comparisons between categories, and mention any notable differences or patterns observed in the data presented.
3. What are the types of charts?
There are several types of charts, including:
1. Bar Chart: Compares quantities across categories.
2. Line Chart: Shows trends over time.
3. Pie Chart: Displays proportions of a whole.
4. Scatter Plot: Illustrates relationships between variables.
5. Histogram: Represents frequency distributions.
6. Area Chart: Like line charts but filled below the line.
7. Bubble Chart: Shows relationships with three dimensions.
4. Which type of chart will be most effective?
The most effective type of chart depends on the data and the message you want to convey. For comparisons, bar charts are useful; for trends over time, line charts are best for proportions, pie charts work well. Choose a chart that clearly presents the information and is easy for your audience to understand.
5. What is the difference between a bar graph and a pie chart?
A bar graph displays data using rectangular bars to represent different categories, making it easy to compare values. A pie chart shows data as slices of a circular pie, illustrating parts of a whole. Bar graphs are better for comparing quantities, while pie charts are useful for showing relative proportions of a single dataset.

Visit: VS Website See: VS Portfolio
0 notes
Text
Transforming Data: How to Convert Pie Charts into Bar Graphs for Enhanced Clarity
1.What are the different types of pie charts?
There are several types of pie charts, including:
1. **Standard Pie Chart**: Displays data as slices of a circle.
2. **Exploded Pie Chart**: Slices are separated for emphasis.
3. **3D Pie Chart**: Adds a three-dimensional effect for visual appeal.
4. **Donut Chart**: Like a pie chart but with a hole in the center.
5. **Semi-Circle Pie Chart**: Represents data in a half-circle format.
2. How to convert pie chart to bar graph?
To convert a pie chart to a bar graph, follow these steps:
1. Identify the categories and their corresponding values from the pie chart.
2. Create a vertical or horizontal axis for the bar graph.
3. Label the axes with categories and values.
4. Draw bars for each category, with heights proportional to their values.
This visually represents the data in a different format.
3. What is pie chart and bar chart?
A pie chart is a circular graph divided into slices to illustrate proportional data, showing parts of a whole. A bar chart uses rectangular bars to represent data quantities, with the length of each bar corresponding to its value, making it easy to compare different categories. Both are commonly used in data visualization.
4. What is pie chart and bar plot?
A pie chart is a circular graphic divided into slices to represent proportions of a whole, showing how different categories contribute to the total. A bar plot, or bar chart, uses rectangular bars to display and compare values across different categories, with the length of each bar corresponding to its value. Both are common tools for data visualization.
5. How to create a bar chart?
To create a bar chart, follow these steps:
1. Collect your data.
2. Choose a software tool (like Excel, Google Sheets, or a graphing library).
3. Input the data into the tool.
4. Select "Bar Chart" from the chart options.
5. Customize titles, labels, and colours as needed.
6. Save or export your chart.

Visit: VS Website See: VS Portfolio
0 notes