#Data Analyst Training
Explore tagged Tumblr posts
Visit Tumblr Blog
Explore Tumblr blogs with no restrictions, modern design and the best experience.
Last Seen Tumblr Blogs


Fun Fact
In 2020, Tumblr had 29.4 million users in the US.
Text
Python Libraries to Learn Before Tackling Data Analysis
To tackle data analysis effectively in Python, it's crucial to become familiar with several libraries that streamline the process of data manipulation, exploration, and visualization. Here's a breakdown of the essential libraries:
1. NumPy
- Purpose: Numerical computing.
- Why Learn It: NumPy provides support for large multi-dimensional arrays and matrices, along with a collection of mathematical functions to operate on these arrays efficiently.
- Key Features:
- Fast array processing.
- Mathematical operations on arrays (e.g., sum, mean, standard deviation).
- Linear algebra operations.
2. Pandas
- Purpose: Data manipulation and analysis.
- Why Learn It: Pandas offers data structures like DataFrames, making it easier to handle and analyze structured data.
- Key Features:
- Reading/writing data from CSV, Excel, SQL databases, and more.
- Handling missing data.
- Powerful group-by operations.
- Data filtering and transformation.
3. Matplotlib
- Purpose: Data visualization.
- Why Learn It: Matplotlib is one of the most widely used plotting libraries in Python, allowing for a wide range of static, animated, and interactive plots.
- Key Features:
- Line plots, bar charts, histograms, scatter plots.
- Customizable charts (labels, colors, legends).
- Integration with Pandas for quick plotting.
4. Seaborn
- Purpose: Statistical data visualization.
- Why Learn It: Built on top of Matplotlib, Seaborn simplifies the creation of attractive and informative statistical graphics.
- Key Features:
- High-level interface for drawing attractive statistical graphics.
- Easier to use for complex visualizations like heatmaps, pair plots, etc.
- Visualizations based on categorical data.
5. SciPy
- Purpose: Scientific and technical computing.
- Why Learn It: SciPy builds on NumPy and provides additional functionality for complex mathematical operations and scientific computing.
- Key Features:
- Optimized algorithms for numerical integration, optimization, and more.
- Statistics, signal processing, and linear algebra modules.
6. Scikit-learn
- Purpose: Machine learning and statistical modeling.
- Why Learn It: Scikit-learn provides simple and efficient tools for data mining, analysis, and machine learning.
- Key Features:
- Classification, regression, and clustering algorithms.
- Dimensionality reduction, model selection, and preprocessing utilities.
7. Statsmodels
- Purpose: Statistical analysis.
- Why Learn It: Statsmodels allows users to explore data, estimate statistical models, and perform tests.
- Key Features:
- Linear regression, logistic regression, time series analysis.
- Statistical tests and models for descriptive statistics.
8. Plotly
- Purpose: Interactive data visualization.
- Why Learn It: Plotly allows for the creation of interactive and web-based visualizations, making it ideal for dashboards and presentations.
- Key Features:
- Interactive plots like scatter, line, bar, and 3D plots.
- Easy integration with web frameworks.
- Dashboards and web applications with Dash.
9. TensorFlow/PyTorch (Optional)
- Purpose: Machine learning and deep learning.
- Why Learn It: If your data analysis involves machine learning, these libraries will help in building, training, and deploying deep learning models.
- Key Features:
- Tensor processing and automatic differentiation.
- Building neural networks.
10. Dask (Optional)
- Purpose: Parallel computing for data analysis.
- Why Learn It: Dask enables scalable data manipulation by parallelizing Pandas operations, making it ideal for big datasets.
- Key Features:
- Works with NumPy, Pandas, and Scikit-learn.
- Handles large data and parallel computations easily.
Focusing on NumPy, Pandas, Matplotlib, and Seaborn will set a strong foundation for basic data analysis.
8 notes
·
View notes
Text
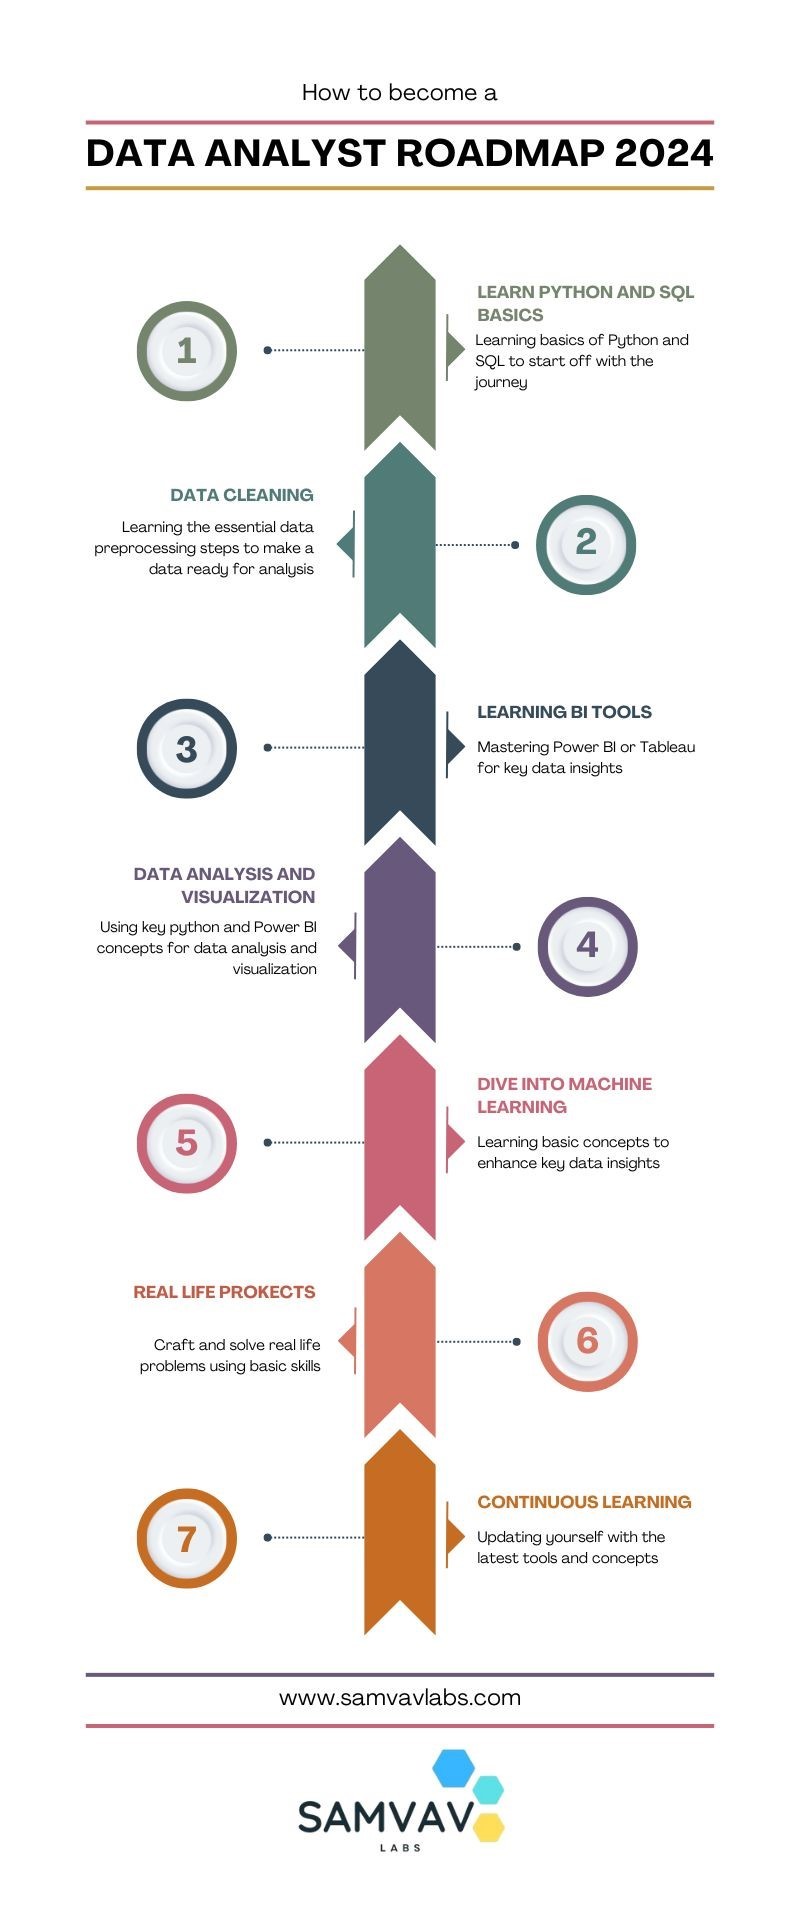
Data Analyst Roadmap for 2024!
Cracking the Data Analyst Roadmap for 2024! Kick off your journey by mastering and delving into Python for data manipulation magic, and dazzle stakeholders with insights using PowerBi or Tableau. Don't forget, that SQL proficiency and hands-on projects refine your skillset, but never overlook the importance of effective communication and problem-solving. Are you checking off these milestones on your path to success? 📌 For more details, visit our website: https://www.samvavlabs.com . . . #DataAnalyst2024 #CareerGrowth #roadmap #DataAnalyst #samvavlabs #roadmap2024 #dataanalystroadmap #datavisualization
#business analytics#data analytics#data analyst#machinelearning#data visualization#datascience#deep learning#data analyst training#dataanalystcourseinKolkata#data analyst certification#data analyst course#data science course#business analyst
11 notes
·
View notes
Text
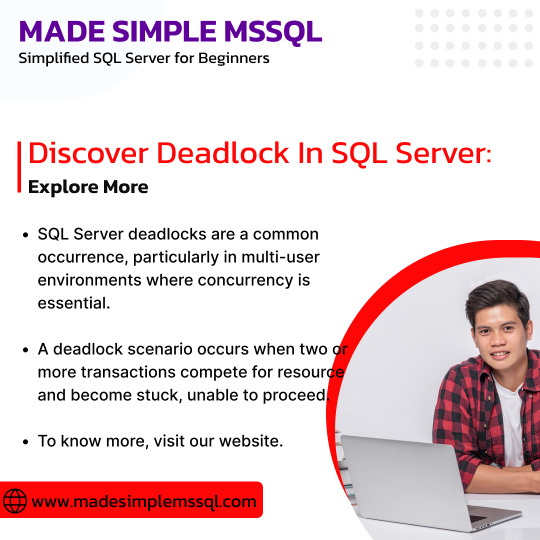
SQL Server deadlocks are a common phenomenon, particularly in multi-user environments where concurrency is essential. Let's Explore:
https://madesimplemssql.com/deadlocks-in-sql-server/
Please follow on FB: https://www.facebook.com/profile.php?id=100091338502392
#technews#microsoft#sqlite#sqlserver#database#sql#tumblr milestone#vpn#powerbi#data#madesimplemssql#datascience#data scientist#datascraping#data analytics#dataanalytics#data analysis#dataannotation#dataanalystcourseinbangalore#data analyst training#microsoft azure
5 notes
·
View notes
Text
7 Best Data Analyst Courses That You Shouldn't Miss!
Hello learners,
We, at CourseCorrect have selected the best courses for becoming a Data Analyst.
Have a look at them in our latest blog here
#datascience#data analytics#dataanalyst#data analyst training#dataanalystcourseinbangalore#dataanalystcourse
3 notes
·
View notes
Text
Exploring the World of Data Analytics: Opportunities and Beyond
Describe data analytics. Analyzing data to find useful information, patterns, and trends is known as data analytics. Businesses adore it since it aids in their improvement. It’s similar to solving problems with data.
Why is data analysis so crucial? Consider yourself in possession of a treasure map (data) and the desire to locate the treasure (insights). Your compass is data analytics.
Why it matters is as follows: It aids in your understanding of consumer behavior, market trends, and company performance.
Efficiency: You can discover areas in which your company may save both time and money.Smart decisions: When using data, you may base decisions on facts rather than educated guesswork.
Personalization: Have you ever seen how Netflix suggests shows? That is data analysis.
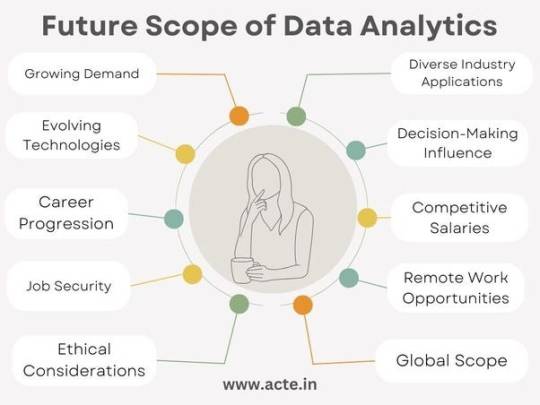
Future Scope of Data Analytics :
High Demand: Many businesses in different industries need data experts because they use data to make smart choices. So, the need for skilled data analysts is growing.
Various Job Fields: Data skills are useful everywhere, not just in one industry. You can work in finance, healthcare, e-commerce, marketing, or technology. This means you have many options for your career.
Tech Keeps Changing: The tools and methods for working with data keep getting better and different. It’s important to keep learning new things, but it also means you can become an expert in a special area.
Helping Decisions: Data people play a big role in helping businesses make important decisions. What you find in data can change how a company plans for the future.
Career Growth: Starting as a data analyst can lead to better and higher-paying jobs like data scientist or machine learning engineer.
Good Pay: Data analysts are paid well. As you get better at your job, you can earn even more.
Job Security: As long as companies use data, they’ll need people who understand it. So, you’ll have a stable job.
Work from Anywhere: You can often do data work from anywhere, giving you flexibility in where you live.
Ethical Data: Data privacy and being fair with data are important. People who can make sure data is used the right way are in demand.
Worldwide Opportunities: Data skills are needed all over the world, so you
can work in different countries if you want.
Careers in Data Analytics:
Data Analyst: The entry point They collect, clean, and analyze data.
Data Scientist: The Experts They use machine learning to solve complex puzzles.
Business Analyst: The bridge between data and business decisions
Big Data Engineer: They manage massive data sets using big data tools.
Healthcare Analyst: They use data to improve healthcare outcomes.
Marketing Analyst: Masters of measuring marketing success
Financial Analyst: They use data for financial strategies.
Sports Analyst: They play with data in the world of sports.
The Future of Data Analytics:
AI and machine learning: Think smarter, not harder. Automation will rule.
IoT Analytics: Connected devices will provide more data than ever.
Ethical Analytics: Data privacy will be a top concern.
Data Visualisation: Making data pretty and easy to understand will be big.
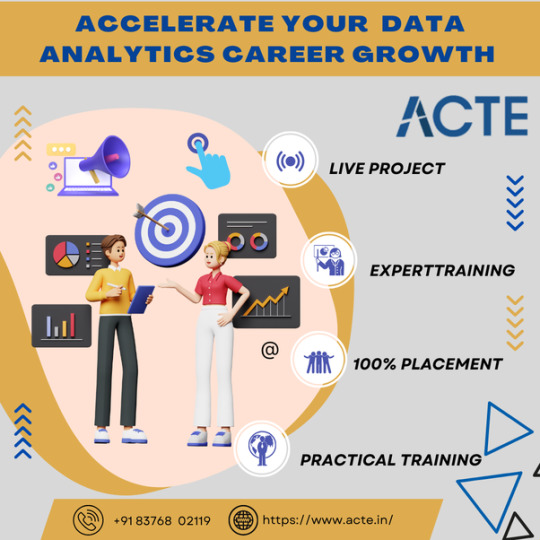
Feel free to get in touch with an ACTE institution if you want to learn more about Data Analytics because they provide certifications and possibilities for job placement. Teachers with experience can improve your learning. These services are available offline and online. Take things slowly and, if you’re interested, think about signing up for a course.
I hope I was able to effectively respond to your query. If it’s not, add it in the comments section. I still think I have a lot to learn.
Consider following me and giving this answer an upvote if you found it to be useful. This will motivate me to post more information on data analytics.
We appreciate you taking the time to read this and voting it up. Enjoy your day.
#data analytics#data analysis#data analytics course#data analyst jobs#data analyst training#data analyst certification#data analyst course
3 notes
·
View notes
Text
youtube
All About Data Science and Analytics Course by Imarticus Leaning | Data Science For Beginners
Looking to supercharge your career in Data Science and Analytics? Look no further! Explore the comprehensive Imarticus Postgraduate Program in Data Science & Analytics.
#Data Science and Analytics Course#Data Science#data analytics#data analyst course#data analyst training#Imarticus#data science course#Youtube
3 notes
·
View notes
Video
youtube
How to highlight Duplicate or Unique values in Excel!
2 notes
·
View notes
Text
The IoT Academy Data Analyst Course
The IoT Academy Data Analyst Course equips learners with essential skills in data collection, cleaning, visualization, and statistical analysis. Covering tools like Excel, SQL, Python, and Power BI, the course prepares students for real-world data roles across industries. With hands-on projects and expert guidance, it's ideal for building a strong foundation in analytics and decision-making.
0 notes
Text
The Future of Data Analyst Courses in Bangalore: What to Expect
The world of data is growing fast, and so are the skills needed to succeed in it. A data analyst course in Bangalore is no longer just about Excel or SQL—it’s evolving to include real-world projects, AI tools, and industry exposure. Over the next five years, these courses will focus more on practical learning, ethics, and domain-specific skills. With Bangalore’s booming tech scene, it’s the perfect place to future-proof your career in data. Choose a course that grows with the industry—and with you.
0 notes
Text
Lucknow का Best Data Analytics Course कहाँ है? #dataanalytics #dataanaly...
youtube
0 notes
Text
Transform Your Career with the Best UiPath Course in Noida!

Are you ready to future-proof your career with one of the most in-demand tech skills?
Join GVT Academy’s Robotic Process Automation (RPA) using UiPath course — rated as the Best Robotic Process Automation (RPA) using UiPath in Noida — and take your first step towards becoming a certified automation expert!
✅ Why RPA? By taking over repetitive and rule-based tasks, RPA is reshaping the way organizations manage their daily workflows. With UiPath, one of the world’s most powerful RPA tools, you can help companies save time, reduce costs, and improve efficiency.
✅ Why GVT Academy? Learning at GVT Academy means evolving beyond the classroom. Our hands-on training approach, real-world projects, expert mentors, and industry-aligned curriculum make us the top choice for aspiring RPA professionals in Noida.
🎯 What You’ll Learn: 🔹 UiPath Studio, Robots, and Orchestrator 🔹 Workflow automation with real-time scenarios 🔹 Data scraping, screen automation & bots 🔹 Resume-building and job interview preparation 🔹 Certification guidance and placement support
💡 Whether you’re a student, working professional, or job seeker — this course is your gateway to lucrative career opportunities in automation and AI.
👨💻 Get trained by certified professionals and unlock your potential with the Best UiPath Course in Noida only at GVT Academy
1. Google My Business: http://g.co/kgs/v3LrzxE
2. Website: https://gvtacademy.com
3. LinkedIn: www.linkedin.com/in/gvt-academy-48b916164
4. Facebook: https://www.facebook.com/gvtacademy
5. Instagram: https://www.instagram.com/gvtacademy/
6. X: https://x.com/GVTAcademy
#UiPath#data analyst training#gvt academy#data analytics#advanced excel training#data science#python#sql course#advanced excel training institute in noida#best powerbi course#power bi
0 notes
Text
Accelerate Your Career with the Leading Data Analytics Program in Kochi by Techmindz
In an era driven by data, the ability to interpret, visualize, and act on insights has become one of the most sought-after skills in the professional world. From business strategy to marketing and product development, data powers every major decision. If you're looking to become a valuable part of this data-driven future, enrolling in a Data Analytics Program in Kochi could be your smartest career move—and Techmindz is the institute to get you there.
📊 Why Data Analytics?
The global demand for data analysts and data scientists has skyrocketed across industries. Organizations, from startups to multinational giants, are constantly seeking professionals who can transform raw data into actionable intelligence. With the right training, you can land roles such as:
Data Analyst
Business Intelligence Analyst
Data Engineer
Visualization Expert
Decision Scientist
And that’s exactly where Techmindz bridges the gap—offering practical training tailored to today’s job market.
🎯 What Makes Techmindz the Go-To Choice in Kochi?
Located in the heart of Infopark, Kochi, Techmindz is more than just an educational institute—it's a technology ecosystem that connects you directly to the IT industry.
💡 Key Highlights of Our Data Analytics Program:
Industry-Aligned Curriculum: Covering Excel, SQL, Python, Tableau, Power BI, Machine Learning fundamentals, and real-world case studies.
Hands-on Projects: Work on live datasets to build dashboards, reports, and predictive models.
Corporate Mentors: Learn from experienced professionals actively working in analytics roles across sectors.
Job Readiness: Resume building, mock interviews, and placement support to help you transition smoothly into the workforce.
Flexible Formats: On-campus and online training modes available for working professionals and students.
👨🎓 Who Can Enroll?
Whether you're a student, working professional, or someone looking to upskill, our Data Analytics Program in Kochi is designed to meet diverse learning needs.
Ideal for:
Graduates in engineering, commerce, science, or business
IT professionals seeking a role shift
Entrepreneurs and business owners looking to leverage data
Non-tech professionals aiming to build future-proof careers
No coding background? No problem. Our step-by-step approach ensures everyone keeps pace.
🏆 Why Kochi is Emerging as a Data Hub
Kochi is quickly becoming a thriving hub for IT and analytics in Kerala, with tech parks, startups, and global firms setting up operations. Choosing a data analytics course in Kochi not only gives you access to quality training but also improves your chances of landing internships and jobs in the local industry.
🚀 Start Your Data Career with Techmindz
Data isn’t just the future—it’s the present. Equip yourself with in-demand analytics skills that employers are actively searching for. With our Data Analytics Program in Kochi, you’re not just learning—you’re preparing for real-world success.
📞 Contact us today for a free consultation or visit our center at Infopark, Kochi. Let’s turn your data curiosity into a high-growth career.
https://www.techmindz.com/data-science/
0 notes
Text
How to Use Google Sheets for Data Visualization
In today’s data-centric era, creating impactful data visualizations is essential for professionals in every sector. While many tools are available, Google Sheets offers a simple yet powerful platform for creating insightful visualizations without the need for complex software. This article will guide you through using Google Sheets for data visualization, and how enhancing your skills with a data analyst course in Kolkata can elevate your capabilities.
Why Choose Google Sheets for Data Visualization?
Google Sheets is a web-based spreadsheet application that offers a blend of convenience, user-friendliness, and robust features. It allows you to organize data, perform calculations, and create various types of charts—all within a collaborative environment. For aspiring data analysts, especially those enrolled in a data analyst course in Kolkata, Google Sheets serves as an excellent starting point to practice and apply visualization skills.
Moreover, Google Sheets supports real-time collaboration, making it easier for teams to work together on data projects. This feature is particularly valuable in today’s hybrid work culture, where analysts must collaborate with stakeholders across different locations.
Setting Up Your Data
Before diving into visualization, it’s essential to structure your data effectively. Start by organizing your dataset into clear columns and rows, ensuring labels are clear and consistent. Google Sheets offers built-in functions to clean, filter, and sort data, which is a foundational skill taught in any offline data analyst institute in Kolkata. Proper data organization minimizes errors and sets the stage for accurate visualizations.
Choosing the Right Chart Type
Google Sheets offers an array of chart options such as bar charts, line graphs, pie charts, and scatter plots. The key is selecting a chart that best represents your data’s story.
For example:
Use a bar chart to compare categories.
Select a line graph to illustrate trends across a period.
Opt for a pie chart to illustrate proportions.
Apply a scatter plot to display relationships between two variables.
Learning to match data types with appropriate visualizations is a skill honed through courses like a data analyst course in Kolkata, where you practice real-world scenarios.
Customizing Your Charts
Once you’ve selected a chart, Google Sheets offers extensive customization options. You can adjust colors, fonts, data labels, and axes to make your visualizations more impactful. Use consistent color schemes to enhance readability and emphasize key data points. Remember, the goal of data visualization is clarity and insight, not just aesthetics.
Offline training from an offline data analyst institute in Kolkata often emphasizes these customization techniques, ensuring your charts effectively communicate insights. Whether you’re preparing reports, dashboards, or presentations, well-designed charts can make complex data accessible to everyone.
Interactive Dashboards with Google Sheets
Beyond static charts, Google Sheets supports the creation of interactive dashboards. By using data validation, filters, and linked charts, you can allow viewers to explore different perspectives of the data. Such interactivity boosts user involvement and facilitates more flexible decision-making.
Interactive dashboards are a staple in the toolkit of modern data analysts, and practicing these techniques during your data analyst course in Kolkata will prepare you for real-world applications. Google Sheets offers a user-friendly environment to experiment with these dynamic features.
Sharing and Collaboration
Google Sheets makes it easy to share visualizations with colleagues or clients. You can set access permissions, collaborate in real-time, and even embed charts into presentations or websites. This collaborative functionality mirrors the team-based projects often emphasized in an offline data analyst institute in Kolkata, where working with others is key to delivering successful projects.
DataMites Institute: Your Partner in Data Visualization Excellence
For those eager to master not only Google Sheets but also a broad spectrum of data analytics tools and techniques, DataMites is the ideal partner. Accredited by IABAC and NASSCOM FutureSkills, the courses at DataMites Institute are designed to meet global industry standards. Learners gain access to expert mentorship, hands-on projects, internship opportunities, and comprehensive placement support.
DataMites Institute also offers offline classroom training in key cities such as Mumbai, Pune, Hyderabad, Chennai, Delhi, Coimbatore, and Ahmedabad—ensuring flexible learning options across India. If you're based in Pune, DataMites Institute provides the ideal platform to master Python and excel in today’s competitive tech environment.
What truly distinguishes DataMites Institute is its learner-centric approach. With a curriculum that bridges theory and practice, learners are equipped to handle real-world data challenges. Whether you’re aiming to use Google Sheets for data visualization or pursue a deeper dive into analytics, DataMites Institute offers a pathway tailored to your ambitions. Its courses emphasize clarity, problem-solving, and communication—skills that will make you a sought-after data analyst.
In conclusion, Google Sheets is a flexible tool for data visualization that combines ease of use with advanced capabilities. By combining its functionalities with skills gained from a data analyst course in Kolkata, and nurturing those skills further through an offline data analyst institute in Kolkata, you can become a data visualization expert ready to meet the demands of today’s data-driven world. And with DataMites as your learning partner, you’ll be well-prepared to turn insights into impact.
1 note
·
View note
Text

Why Digital Marketing Is the Career of the Future
In today’s fast-paced, tech-driven world, digital marketing has emerged as one of the most in-demand and future-proof careers. As businesses across the globe continue to embrace online platforms, the need for digital marketing professionals has skyrocketed. Whether you're a student exploring career options or a professional considering a career change, here's why a digital marketing career might just be the best decision for your future.
1. The Digital Economy Is Booming
The global shift toward digitalization has revolutionized the way businesses interact with customers. From startups to multinational corporations, every company now needs an online presence. This creates a constant demand for digital marketers who can help drive traffic, increase sales, and build brand awareness. The future of marketing is undoubtedly digital.
2. A Wide Range of Career Opportunities
One of the most attractive aspects of a career in digital marketing is the diversity of roles available. You can specialize in areas such as:
Search Engine Optimization (SEO)
Social Media Marketing
Content Marketing
Email Marketing
Pay-Per-Click (PPC) Advertising
Affiliate Marketing
Analytics and Data-Driven Marketing
Each of these niches offers unique opportunities for growth and specialization, making digital marketing a versatile and exciting career choice.
3. High Demand, Low Supply
There’s a significant gap between the number of online marketing jobs available and the professionals qualified to fill them. This supply-demand gap gives digital marketers an edge in terms of job security and salary potential. According to industry reports, the demand for digital marketing skills will only continue to grow in the coming years.
4. Flexibility and Remote Work Opportunities
Digital marketing is one of the few fields that offers genuine flexibility. Many roles can be done remotely, making it ideal for freelancers, digital nomads, and those seeking a better work-life balance. This flexibility also allows marketers to work with international clients and diverse industries without being tied to a single location.
5. Continuous Learning and Innovation
If you enjoy learning and adapting to new technologies, digital marketing is the perfect fit. The field is always evolving with new tools, platforms, and trends like AI, automation, voice search, and influencer marketing. This ensures that your work never gets boring and that you stay ahead of the curve in your professional development.
6. Entrepreneurial Opportunities
Not only does digital marketing open the door to a successful job market, but it also provides the skills needed to launch your own business or side hustle. Many entrepreneurs use digital marketing to promote their products, build personal brands, or run successful e-commerce stores. Understanding online marketing gives you a competitive edge in any business venture.
7. Accessible and Affordable Learning Paths
Unlike traditional careers that require expensive degrees, digital marketing skills can be learned through online courses, bootcamps, and certifications. With dedication and hands-on practice, you can build a strong portfolio and start landing clients or job offers within months.
Final Thoughts
The future of marketing is digital, and the time to start building your digital marketing career is now. With high demand, diverse roles, flexible work options, and endless growth potential, it’s easy to see why more and more people are choosing to enter this dynamic industry.
Whether you want to work for a top agency, build your freelance business, or grow your own brand, digital marketing gives you the tools and opportunities to succeed in the digital age.
#digital marketing#data analyst course#data analyst training#future of marketing#skills for digital marketing#seo#ppc#socialmediamarketing
0 notes

