#Data Management and Visualization Week1
Explore tagged Tumblr posts
Visit Tumblr Blog
Explore Tumblr blogs with no restrictions, modern design and the best experience.
Last Seen Tumblr Blogs


Fun Fact
25% of US internet users with an annual income of $80-100K use Tumblr.
Text
Wesleyan University
Data Management and Visualization
Week1
I’ve chosen the "Mars craters” study since I’m interested to geographical topics.
1st Question: I would like to invesitgate: “Is there crater diameter associated with the morphology?”
To do this, I choose following variables to my codebook:
CRATER_ID – crater ID for internal sue, based upon the region of the planet
(1/16ths), the “pass” under which the crate was identified, ad the order in which
it was identified
DIAM_CIRCLE_IMAGE – diameter from a non-‐linear least squares circle fit to the
vertices selected to manually identify the crater rim (units are km)
MORPHOLOGY_EJECTA_1 – ejecta morphology classified. Examples below.
o If there are multiple values, separated by a “/”, then the order is the
inner-‐most ejecta through the outer-‐most, or the top-‐most through
the bottom-‐most
2nd question:
“Is the crater diameter of the crater associated with the type of the lake in the crater.”
To investigate that, I extended the codebook with 2 additonal variables:
LAKE – categorical variable: was there any lake in the crater - yes / no
LKE_CLASS: categorical variable of Basin class: O, open; C, closed; LC, lake chain
Used literature to the 2nd question:
1) “Distribution, Classification, and Ages of Martian Impact Crater Lakes:
https://www.sciencedirect.com/science/article/pii/S0019103599961912?ref=cra_js_challenge&fr=RR-1
2) https://agupubs.onlinelibrary.wiley.com/doi/abs/10.1029/1999JE001219
Hypothesis based on the literature: There is no correlation between the crater diameter and the lake type (based on table 1 of 1) ).
1 note
·
View note
Text
WEEK1 Data Management & Visualization


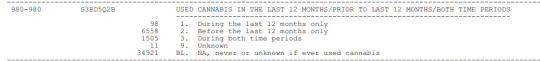


Taking into account the literature review I performed, using Google Scholar, I found several academic studies and researches based on the relationship between cannabis use, depression and anxiety there was a moderate association between involvement with cannabis use in the past 12 months and the prevalence of affective and anxiety disorders. Among those with DSM-IV cannabis dependence, 14 % had affective disorder symptoms, compared to 6 % of non-users; while 17 % met criteria for an anxiety disorder, compared to 5 % of non-users. These associations did not remain significant after including demographics, neuroticism and other drug use in multiple regressions. Cannabis use did not appear to be directly related to depression or anxiety when account was taken of other drug use. However, the association between heavier involvement with cannabis use and affective and anxiety disorders has implications for the treatment of persons with problematic cannabis use.
References
Degenhardt, L., Hall, W., & Lynskey, M. (2003). Exploring the association between cannabis use and depression. Addiction, 98(11), 1493-1504.
Degenhardt, L., Hall, W., & Lynskey, M. (2001). Alcohol, cannabis and tobacco use among Australians: a comparison of their associations with other drug use and use disorders, affective and anxiety disorders, and psychosis. Addiction, 96(11), 1603-1614.
Degenhardt, L., Hall, W., & Lynskey, M. (2001). The relationship between cannabis use, depression and anxiety among Australian adults: findings from the National Survey of Mental Health and Well-Being. Social psychiatry and psychiatric epidemiology, 36(5), 219-227.
0 notes
Text
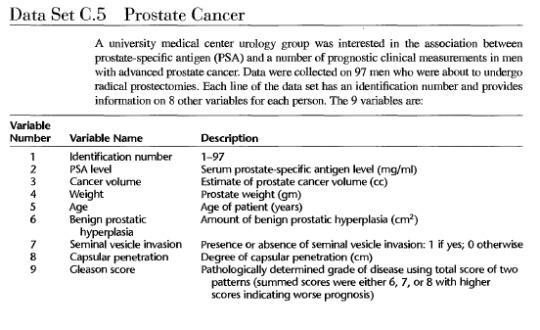
Regression Analysis of the factors affecting high grade prostate cancer in patients.
I have decided that I am particularly interested in high grade prostate cancer and this my own data set. I have included all the factors which I think are the main causes of high grade prostate cancer. Examples of factors include age of patients, prostate weight.
Research Questions
1. Does age positively affect high grade prostate cancer?
2. Is there a high correlation between high grade prostate cancer and the various factors?
Topic of Interest
Regression Analysis of the factors affecting high grade prostate cancer in patients.
Second (Related) Topic of Interest
Correlation among variables stated in our codebook.
Correlation is the measure of the strength of the linear relationship among, usually, continuous random variables. Correlation is always between -1 and +1. Values closer to -1 and +1 indicate high negative and high positive correlation respectively i.e. a strong positive or negative association. Correlation values closer to zero indicates weak relationship among the variables of interest.
Literature Review
Prostate cancer is the second most common diagnosed cancer and the fourth leading cause of cancer death in men worldwide (WCRF 2019). Physicians use rectal examination and prostate-specific antigen (PSA) concentration in blood to detect prostate cancer (Catalona et al. 1997, Heindenreich et al. 2014), the former is not welcome because of psychological implications and the latter could yield false-positive or false-negative results.
The severity of prostate cancer and survival probability of diagnosed patients can be estimated with the Gleason Score (Stark et al. 2009), but its accuracy and precision depend on multiple biopsies (PCEC 2019), another invasive and traumatic method. Other variables that might be associated to Gleason Score that can be obtained by less invasive methods and may be used to predict prostate cancer risk, for instance: prostate weight, benign prostate hyperplasia and seminal vesicle invasion, can be effectively detected and measured using ultrasonography (Kilic et al. 2014, Soylu et al. 2013).
The use of morphological and physiological parameters measured by noninvasive methods to predict the presence of high-grade prostate cancer remains unstudied. In this work we used seven morphological and physiological variables that can be measured in blood samples and ultrasonography to estimate the probability of presence of high-grade prostate cancer and therefore reduced the psychological impact of invasive diagnostic methods. It was recognized that age was the predominant factor affecting high grade prostate cancer (Naveda et al. 2019).
Hypothesis
Age is the principal determinant of high grade cancer. The probability of presence of high-grade prostate cancer increases as a person ages.
CodeBook
Adapted in part from: Hastie, T. J.; R. J. Tibshirani; and J. Friedman. The Elements of Statistical Learning: Data Mining. Inference. And Prediction. New York: Springer-Verlag, 2001.
Applied Linear Regression Models edition 5 Kutner et al.
1 note
·
View note
Text
Data Management & Visualization (Week1)
Study about the association between employment rate and internet user rate in developing countries.
After looking through the codebooks , I choose the GapMinder data set which includes one year of numerous country-level indicators of health, wealth and development.
From the variables in the codebook , the employment rate of each country make me interested. This book does not have much pages, so I just use the codebook for future reference.
Specific topic of interest - > Employment rate of a country(employrate)
Nowadays , the use of internet become wider even in the developing countries. I think that the more people get access to the internet , they can get more educated and can develop their skill sets more easily and that may lead to more job opportunities. Moreover ,there can be the remote job opportunities. So , I would like to know that the internet user rate of a country has impact or association with the employment rate.
So , my second topics is → Internet User Rate. (Internetuserate)
Literature Review
I have used the internet penetration rate , internet user rate and employment rate search term in google scholar.
The literature by Zhao (2020) explores the relationship between internet usage and rural self-employment in China. The study reveals that internet usage has a significant positive impact on the likelihood of rural self-employment, increasing it by 5 to 7 percentage points. The effects of internet usage on rural laborers vary based on gender, age, and education level. Male, older, and better-educated laborers experience a notable influence, while the effect is not remarkable for female, younger, and less educated laborers. Through channel investigation, the research identifies several mechanisms through which internet usage promotes rural self-employment, including the weakening of financial constraints, reduction of social capital restrictions, and lowering of transaction costs. The study employs regression analysis and considers variables such as internet penetration rate, self-employment rate, and self-employment as the dependent variable.
The working paper by Stein Monteiro examines the impact of social media and internet usage rates on employment outcomes among newcomers in Canada. The findings from the regression analysis indicate a positive relationship between social media usage and employment. The coefficient estimate in Table 3 represents the efficiency of social media compared to traditional communication methods like telephones, email, and in-person interactions for gathering information and communicating within a social network. The study suggests that social media usage, as well as internet usage for training purposes, contribute to improved employment prospects for newcomers.
My final hypothesis is :
The increase of interpenetration rate in developing countries has positive impact on the employment rate.
Reference
Zhao, J. (2020). Internet Usage and Rural Self-Employment in China. Asian Perspective, 44(1), 77–101. doi:10.1353/apr.2020.0003
Stein Monteiro(2022) Social media and internet usage rates on employment outcomes among newcomers in Canada.
1 note
·
View note
Text
Data Management and Visualization (week1 - Life expectancy)
Background: After looking through the codebook for the GapMinder study, I have decided that I am particularly interested in the life expectancy. I included those relevant variables (Democracy score and Income per person) in my personal codebook which I think influences the Life expectancy. I am wondering whether the level of Democracy (non-material) or the Income per person (material) have bigger affect on the Life expectancy in countries.
Literature review: Life expectancy and Non-material assets (Democracy score) and Material assets (Income per person) Search terms used: "life expectancy democracy" and "life expectancy personal income"
There are studies investigating the effect of Democracy levels of the countries along with socioeconomic factors on the population health. These studies confirms correlation between the socioeconomic position and the health outcomes while also arguing that democracy can have an impact on health independently of the effects of socio-economic factors, it is the direct effect of democracy. The findings support the positive influence of democracy on population health (both direct and indirect effect). Although some of them revealed Incoherent polities do not have any significant health advantage over autocratic polities as the reference category.
Hypothesis: My hypothesis is that life expectancy is mostly a function of people's wealth, which ensures their access to a healthy lifestyle (living environment, nutrition, work-life balance) and health care and the level of democracy affects life expectancy only indirectly through wealth.
Reference:
"Is Democracy Good for Health?" Jalil Safaei Volume 36, Issue 4 https://doi.org/10.2190/6V5W-0N36-AQNF-GPD1
"Income distribution and life expectancy." R. G. Wilkinson BMJ. 1992 Jan 18; 304(6820): 165–168.
1 note
·
View note
Text
Data Management and Visualization week1
Hello everyone!
I started learning the course “Data Management and Visualization” on www.coursera.org and will be sharing my results here.
For my research I chose NESARC codebook (NESARC - The U.S. National Epidemiologic Survey of Drug Use and Health), because the problem of alcohol dependence really exists, it directly concerns my friends and relatives, and is also relevant for my country. I want to know more!
Аt university I studied labor economics, so after studying the NESARC codebook I was interested in variables from SECTION 1 related to employment and unemployment. I suggested that employment problems may be related to the frequency of drinking alcoholic beverages, I found these data also in SECTION 1.
Found literature confirms the close association of these factors:
https://onlinelibrary.wiley.com/doi/abs/10.1111/irel.12019 Does Unemployment Lead to Greater Alcohol Consumption? Ioana Popovici Michael T. French
https://www.sciencedirect.com/science/article/abs/pii/S0167629696004894 Journal of Health EconomicsVolume 15, Issue 4, August 1996, Pages 409-434 John Mullahy, Jody Sindelar
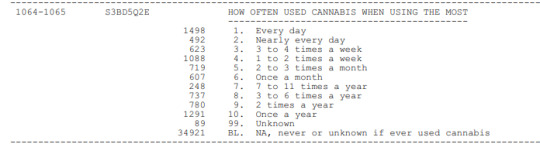
I chose 2 variables:
- 378-379 S2AQ7B HOW OFTEN DRANK LIQUOR IN LAST 12 MONTHS
-298-298 S1Q235 UNEMPLOYED AND LOOKING FOR WORK FOR >1 MONTH IN LAST 12 MONTHS
null hypothesis - The frequency of drinking is not related to long-term unemployment and does not depend on age alternative hypothesis -The frequency of drinking is associated with long-term unemployment and depends on age.
1 note
·
View note
Text
Coursera Data Management and Visualization Week1 – v2
13 Feb 2021
Data set: National Epidemiologic Study of Alcohol and Related Conditions (NESARC)
SECTION 2C: Alcohol Treatment Utilization
Hypothesis: Not all individuals follow through with alcohol treatment.
Research Question 1:
After looking through the codebook for the NESARC study, I have decided that I am particularly interested in alcohol treatment utilization. Starting with the column “EVER SOUGHT HELP BECAUSE OF DRINKING” (S2CQ1) I will examine usage of the thirteen available treatment options (S2CQ2A1 – S2CQ2A13).
Did all individuals who sought treatment follow through with treatment options?
Research Question 2:
I am interested in effectiveness of alcohol treatment utilization. Starting with the column “WHEN WENT TO …” (S2CQ2B1 – S2CQB13) I will examine time periods for each of the thirteen available treatment options (S2CQ2A1 – S2CQ2A13).
What percentage of the population remains active in treatment?
I would also like to compare results from my Research Question 2 to the categorized treatment summaries from the article Latent Class Analysis of Alcohol Treatment Utilization Patterns and 3-Year Alcohol Related Outcomes.
Classification
Multiservice Users (8.7%)
Private Professional Service Users (32.8%)
Alcoholics Anonymous (AA) Paired with Specialty Addiction Service Users (22.0%)
Users of AA Alone (36.5%)
Literature review:
Emily Cohen, Richard Feinn, Albert Arias, Henry R. Kranzler,
Alcohol treatment utilization: Findings from the National Epidemiologic Survey on Alcohol and Related Conditions,
Drug and Alcohol Dependence,
Volume 86, Issues 2–3,
2007,
Pages 214-221,
ISSN 0376-8716,
https://doi.org/10.1016/j.drugalcdep.2006.06.008.
(https://www.sciencedirect.com/science/article/pii/S0376871606002298)
Abstract: Background
Epidemiological studies consistently show low rates of alcohol treatment utilization among individuals with an alcohol use disorder (AUD). However, there is not as great consistency in the characteristics that predict alcohol treatment utilization.
Methods
Using data from the National Epidemiologic Survey on Alcohol and Related Conditions (NESARC), we examined attributes associated with treatment utilization among individuals with an AUD. We used stepwise backward selection logistic regression analysis to examine demographic and clinical predictors of treatment utilization, in order to identify opportunities to improve the delivery of services to this population.
Results
Only 14.6% of individuals who met lifetime criteria for an AUD reported ever having received alcohol treatment (including self-help group participation). A greater proportion of respondents with both alcohol abuse and dependence (27.9%) reported having received treatment, compared with 7.5% of those with alcohol abuse only and 4.8% of those with alcohol dependence only. Older individuals, men, and those who were divorced, had less education or more lifetime comorbid mood, personality, and drug use disorders were also more likely to have received treatment.
Conclusions
The majority of individuals with an AUD never receive formal alcohol treatment, nor do they participate in self-help groups. Although natural recovery from an AUD is well documented, participation in alcohol treatment is associated with improved outcomes. The data presented here should be taken into account when efforts are made to enhance alcohol treatment utilization.
Literature review 2:
Keywords: NESARC; Alcohol treatment; Epidemiology; Alcohol use disorders; Service utilization
Orion Mowbray, Joseph E. Glass, Claudette L. Grinnell-Davis,
Latent Class Analysis of Alcohol Treatment Utilization Patterns and 3-Year Alcohol Related Outcomes,
Journal of Substance Abuse Treatment,
Volume 54,
2015,
Pages 21-28,
ISSN 0740-5472,
https://doi.org/10.1016/j.jsat.2015.01.012.
(https://www.sciencedirect.com/science/article/pii/S0740547215000379)
Abstract: People who obtain treatment for alcohol use problems often utilize multiple sources of help. While prior studies have classified treatment use patterns for alcohol use, an empirical classification of these patterns is lacking. For the current study, we created an empirically derived classification of treatment use and described how these classifications were prospectively associated with alcohol-related outcomes. Our sample included 257 participants of the National Epidemiologic Survey on Alcohol and Related Conditions (NESARC) who first received alcohol treatment in the 3-year period prior to their baseline interview. We used latent class analysis to identify classes of treatment users based on their patterns of treatment use of 13 types of alcohol treatment. Regression models examined how classes of treatment use at baseline were associated with alcohol-related outcomes assessed at a 3-year follow-up interview. Outcomes included a continuous measure of the quantity and frequency of alcohol use and DSM-IV alcohol use disorder status. Four classes of treatment users were identified: (1) multiservice users (8.7%), (2) private professional service users (32.8%), (3) alcoholics anonymous (AA) paired with specialty addiction service users (22.0%), and (4) users of AA alone (36.5%). Those who utilized AA paired with specialty addiction services had better outcomes compared to those who used AA alone. In addition to elucidating the most common treatment utilization patterns executed by people seeking help for their alcohol problems, the results from this study suggest that increased efforts may be needed to refer individuals across sectors of care to improve treatment outcomes.
Keywords: Treatment utilization; Alcohol use disorders; Latent class analysis
0 notes
Text
Data Managment and Visualization - Assignment week1
I have chosen GapMinder data set. Using this data set i want to analyze the social and economic status of women associated with breast cancer across countries. Looking into the data set i also want to compare the rates of breast cancer at rural and urban areas. I have chosen income per person, breast cancer per 100th, urban rate, breast cancer deaths, breast cancer death per 100 000 women, breast cancer new cases, breast cancer new cases per 100 000 women. Literature- Socioeconomic Risk Factors for Breast Cancer Distinguishing Individual- and Community-Level Effects by Robert, Stephanie A, Strombom, Indiana Breast cancer incidence is associated with socioeconomic status (SES) as measured at both the individual and community levels. Breast cancer incidence in the United States is higher among women with more education and income.1,2 Breast cancer incidence is also greater in U.S. communities with higher average levels of income and education,3–10 as well as in urban communities. This study examines the multilevel associations of community SES, community urbanity, and individual education with breast cancer incidence. Using data from a population-based, breast cancer case-control study in Wisconsin, we first demonstrate relationships between high individual education and breast cancer incidence, and between high community SES, urbanity, and breast cancer incidence. We then examine whether associations among community SES, urbanity, and breast cancer incidence are compositional, contextual, or both. My hypothesis states that women living in urban communities are at high risk to breast cancer compared to other communities. They can also battle such diseases because of their income, status and access to all facilities.
0 notes
Text
Data Management and Visualization Week1 Assignment
1. A data set and that selection? (1 point)
AddHealth Study
The National Longitudinal Study of Adolescent Health (AddHealth) is a representative school-based survey of adolescents in grades 7-12 in the United States. The Wave 1 survey focuses on factors that may influence adolescents’ health and risk behaviors, including personal traits, families, friendships, romantic relationships, peer groups, schools, neighborhoods, and communities.
2. Statement of a research question and hypothesis? (2 points)
Question- Is there a correlation between Expectations, Employment, Income(Section 38) and Relationship History Section 16: Relations with Parents ,Section 20: Friends, Section 21: Ideal Romantic Relationship Section, 22: Romantic Relationship Roster, Section 23: Liked Relationship Roster, Section 25: Relationship Information—Audio CASI,Section 26: Non-Relationship History—Audio )
Hypothesis- Expectations and outcomes of the Expectations of an individual are influenced by the behavior of people around that individual ie. people who are related in some way( Friends, Siblings, Parents, Romantic Partners)
3. Search terms used? (1 point)
Relationships and Psychology,
Expectations and Past behavior of people.
4. References used (2 points)
https://www.psychology.org.au/publications/tip_sheets/relationship/
http://users.rider.edu/~suler/psycyber/relationships.html
https://www.psychologytoday.com/basics/relationships
https://positivepsychologyprogram.com/positive-psychology-relationships/
http://www.spring.org.uk/2014/02/10-psychology-studies-every-lover-should-know.php
5. Summary of findings (2 points)
Section 16: Relations with Parents ,Section 20: Friends, Section 21: Ideal Romantic Relationship Section, 22: Romantic Relationship Roster, Section 23: Liked Relationship Roster, Section 25: Relationship Information ,Section 26: Non-Relationship History.
1 note
·
View note
Text
Coursera. Data Management and Visualization.
Assignment. Week1.
1. I have chosen the following data set:
The National Longitudinal Study of Adolescent Health
(AddHealth) is a representative school-based survey of adolescents in grades 7-12 in the United States.
2. My research question is
Does religion influence the pregnancy norms, ideal romantic relationship and marital timing of adolescents.
3. Hypotheses:
Does the frequency of religious service’s attendance influence the ideal romantic relationship
Do adolescents who identify with a religious group tend to have stronger proscriptions regarding aspects of sexuality and family planning
Does the frequency of praying and teenager’s special activities in churches influence the pregnancy norms.
Does religious teenagers tend to have sex with their partners only if they treat them as future partner
The more religious is the teenager the earlier is the ideal marriage age
4. Variables and codebook
RELIGION
H1RE1 What is your religion
H1RE2 Do you agree or disagree that the sacred scriptures of your religion are the word of God and are completely without any mistakes?
H1RE3 In the past 12 months, how often did you attend religious services?
H1RE4 How important is religion to you?
H1RE6 How often do you pray?
H1RE7 Many churches, synagogues, and other places of worship have special activities for teenagers—such as youth groups, Bible classes, or choir. In the past 12 months, how often did you attend such youth activities?
PREGNENCY
H1RP1 Getting (If R is male, add: someone) pregnant at this time in your life is one of the worst things that could happen to you.
H1RP2 It wouldn’t be all that bad if you got (IF R is male, add: someone) pregnant at this time in your life.
H1RP3 If you got the AIDS virus, you would suffer a great deal.
H1RP4 It would be a big hassle to do the things necessary to completely protect yourself from getting a sexually transmitted disease.
H1RP5 Imagine that sometime soon you were to have sexual intercourse with someone just once, but were unable to use any method of birth control for some reason. What is the chance that you would get (If R is male, add: your partner) pregnant?
H1RP6 Suppose that sometime soon you had sexual intercourse for a whole month, as often as you wanted to, without using any protection. What is the chance that you would get the AIDS virus?
IDEAL RELATIONSHIP
H1ID1A We would go out together in a group.
H1ID1B I would meet my partner’s parents. H1ID1C I would tell other people that we were a couple.
H1ID1D I would see less of my other friends so I could spend more time with my partner.
H1ID1E We would go out together alone.
H1ID1F We would hold hands.
H1ID1G I would give my partner a present.
H1ID1H My partner would give me a present.
H1ID1I I would tell my partner that I loved him or her.
H1ID1J My partner would tell me that he or she loved me.
H1ID1K We would think of ourselves as a couple.
H1ID1L We would talk about contraception or sexually transmitted diseases.
H1ID1M We would kiss.
H1ID1N We would touch each other under our clothing or with no clothes on.
H1ID1O We would have sex.
H1ID1P My partner or I would get pregnant.
H1ID1Q We would get married.
5. I found the following research on my topic:
Racial, Socioeconomic, and Religious Influences on School-Level Teen Pregnancy Norms and Behaviors
http://www.academia.edu/2740650/Racial_Socioeconomic_and_Religious_Influences_on_School-Level_Teen_Pregnancy_Norms_and_Behaviors
The Influence of Religion in Adolescence on Adolescents’ Attitude toward Marital Timing
https://repositories.lib.utexas.edu/bitstream/handle/2152/ETD-UT-2012-08-6051/REDFORD-THESIS.pdf?sequence=1
6. Conclusions after the research.
Individuals who identify with a religious group tend to have stronger proscriptionsregarding aspects of sexuality including pornography ), family planning, and specific gender roles that may influence group norms regarding teen pregnancy.
The higher maternal religious attendance and salience levels, the less likely their children were to accept nonmarital sex or cohabitation.
Maternal religiosity and affiliation frequently influenced adolescents’ attitude toward marital timing similarly to adolescent religiosity and affiliation.
0 notes
Text
CAGD202 Website Redesign Process (week1-3)
WEEK1-3
Information Design and Data Visualization
Because of the way the human brain processes information, using charts or graphs to visualize large amounts of complex data is easier than poring over spreadsheets or reports. Data visualization is a quick, easy way to convey concepts in a universal manner – and you can experiment with different scenarios by making slight adjustments.
Data visualization can also:
Identify areas that need attention or improvement. Clarify which factors influence customer behavior. Help you understand which products to place where. Predict sales volumes.
Before implementing new technology, there are some steps you need to take. Not only do you need to have a solid grasp on your data, you also need to understand your goals, needs and audience. Preparing your organization for data visualization technology requires that you first: Understand the data you’re trying to visualize, including its size and cardinality (the uniqueness of data values in a column).
Determine what you’re trying to visualize and what kind of information you want to communicate. Know your audience and understand how it processes visual information.
Use a visual that conveys the information in the best and simplest form for your audience. Once you've answered those initial questions about the type of data you have and the audience who'll be consuming the information, you need to prepare for the amount of data you'll be working with. Big data brings new challenges to visualization because large volumes, different varieties and varying velocities must be taken into account. Plus, data is often generated faster that it can be managed and analyzed.
Data visualization chart example:


Data Visualization is useful for us in exploring large amounts of data, to understand complex relationships and in transmitting information.
Information Design is useful for us in explaining large amounts of data, to tell a story to reveal connections and relationships to display comparisons.
Task1:Create a hybrid probability chart
Survey of Income and Housing: Survey participation 2013-14 (Australian Bureau of Statistics)
Some good example we found it in the Intertnet

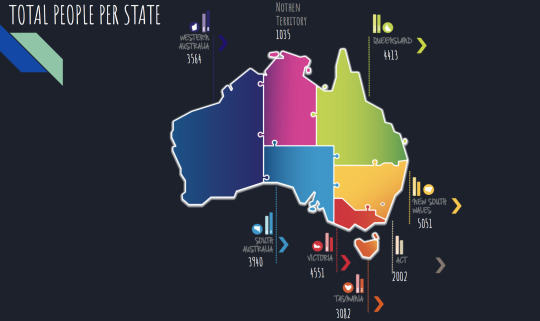

Our team uses color to distinguish each region, and it is represented by a line graph and a map.The final:

0 notes
Text
Week1:Research Proposal
Hi all,
I'm Shinjini Chattopadhyay from India and I enrolled in Data Management and Visualization course by Wesleyan University, via coursera.
My project encourages me to develop a research question after carefully going through the codebooks and choosing something that interests us
Also, The assignments needs to be uploaded as a blog entry- I chose Tumblr in accordance to my convenience.
ASSIGNMENT 1 :
On this first assignment,we are asked to choose one from the five codebooks provided and two topics we want to research on.
Happy Reading :)
STEP 1: Choose A Dataset I chose the Gapminder codebook because of its simplicity and its focus on the world health indicators.
STEP 2: Identify a specific topic of interest.
RESEARCH TOPIC
Is there any association between the life expectancy and alcohol consumption?
Step 3: Identify a second topic that you would like to explore in terms of its association with your original topic.
Looking at the Gapminder codebook, I saw the possibility to explore the possible relationship between alcohol consumption and life expectancy, and, also, after reading various research articles i wanted to check the possible correlation between alcohol consumption and the development of breast cancer in women.
Step 4: Prepare a codebook of your own.

Step 5: Based on your literature review, develop a hypothesis about what you believe the association might be between these topics. Be sure to integrate the specific variables you selected into the hypothesis.
Hypothesis
PRIMARY HYPOTHESIS: There is a negative correlation between life expectancy and the quantity of alcohol consumption.
SECONDARY HYPOTHESIS : An increase in alcohol consumption increases the chances of developing breast cancer.
Background & Literature review
There are numerous studies showing that an increase in the alcohol intake can lower one’s life expectancy.
Lead author, Dr Angela Wood, of the University of Cambridge, said: "The key message of this research for public health is that, if you already drink alcohol, drinking less may help you live longer and lower your risk of several cardiovascular conditions."
The study analyzed 599,912 current drinkers in 19 countries, none of whom had a known history of cardiovascular disease, and found an increase in all causes of death when more than 100g of alcohol was consumed every week.

Also, study shows drinking alcoholic beverages -- beer, wine, and liquor -- increases a woman's risk of hormone-receptor-positive breast cancer. Alcohol can increase levels of estrogen and other hormones associated with hormone-receptor-positive breast cancer. Alcohol also may increase breast cancer risk by damaging DNA in cells. Compared to women who don't drink at all, women who have three alcoholic drinks per week have a 15% higher risk of breast cancer. Experts estimate that the risk of breast cancer goes up another 10% for each additional drink women regularly have each day.

References :
[1] Shkolnikov, V.; McKee, M.; Leon, D. Changes in life expectancy in Russia in the mid-1990s. The Lancet, v. 357, n. 9260, p. 917-921, 2001.
[2] Trevisan, M. et al. Drinking Pattern and Mortality:. Annals of Epidemiology, v. 11, n. 5, p. 312-319, 2001.
[3] JNCI: Journal of the National Cancer Institute, Volume 78, Issue 4, 1 April 1987, Pages 657–661, https://doi.org/10.1093/jnci/78.4.657
0 notes
Text
Data Management and Visualization
Week1-Selecting a Research Question
Research question: Is characteristic of children in a household associated with current employment status of a family?
Codebook: I have chosed the Outlook on Life Survey(OOL)
Dataset: Outlook on Life READ ME file(.pdf)
Topic 1: Current employment status measured by variable PPWORK on P421
Topic 2: Characteristic of children in a household is measured by follow variables: PPT01 Presence of Household Members-Children 0-1 P419 PPT25 Presence of Household Members-Children 2-5 P420 PPT612 Presence of Household Members-Children 6-12 P420 PPT1317 Presence of Household Members-Children 13-17 P419
Hypothesis: My hypothesis is that there is a correlation between number of young children in a household and current employmnet status. I claims that more the number of young children in a household, more family supports there will be needed. Thus, in labor force market, a famlily with young children might have a lower rate of labor force participation.
Literature review Search term: family characteristics employment characteristics structure of families with children under age 18 labor force participation rate
Literature review:
0 notes
Text
Week1. Data Management and Visualization
Dataset: Gapminder
Research question: Is suicide rate associated with income?
After looking through the codebook for Gapminder, I have decided that I am particularly interested in the suicide rate and its relation with the attribute income. However due to the low number of variables in the codebook (15 variables). I will work with the whole dataset to find other important relationships for suicideper100TH.
Literature review: I found two important papers related with the effect of the income in suicide which suggest that I am in a right path to determine its relation and the countries with more significant cases. For instance, the paper ‘Suicide and poverty in low-income and middle-income countries: a systematic review” suggests that although a great proportion of suicides occurs in low income countries there is not enough evidence of this association to generate efficient strategies to prevent this situation.
The paper called “Explaining the income and suicidality relationship: income rank is more strongly associated with suicidal thoughts and attempts than income” concludes that the relationship between suicides and income should be evaluated among social groups. The paper shows that the suicide is related with the income but add more factors to identify the reasons for this situation.
My hypothesis is that countries with less income and bigger social gaps will have more suicides attempts than countries with wealthy and stable economies.
0 notes