#Data Wrangling vs Data Cleaning
Explore tagged Tumblr posts
Visit Tumblr Blog
Explore Tumblr blogs with no restrictions, modern design and the best experience.
Last Seen Tumblr Blogs


Fun Fact
1,644 Tumblr posts in 1 second.
Text
Understanding Difference between Data Wrangling and Data Cleaning

In today's data-centric landscape, organizations depend on accurate and actionable insights to guide their strategies. However, raw data is rarely in a state ready for immediate use. Before it can provide value, data must undergo a preparation process involving both data wrangling and data cleaning. While these terms are often used interchangeably, they refer to distinct processes that are crucial for ensuring high-quality data. This guide will explore the nuances between data wrangling vs data cleaning, highlighting their roles in data preparation.
What is Data Wrangling?
Data wrangling, also known as data munging, is the comprehensive process of transforming and mapping raw data into a more structured and usable format. The goal of data wrangling is to prepare data from multiple sources and formats so that it can be analyzed effectively.
Core Aspects of Data Wrangling
Data Integration: Combining disparate datasets into a cohesive whole. For instance, merging customer data from different departments to create a unified customer profile.
Data Transformation: Converting data into a consistent format. This could involve changing date formats, standardizing units of measurement, or altering text data for uniformity.
Data Enrichment: Adding external data to enhance the dataset. For example, integrating socio-economic data to provide deeper insights into customer behavior.
Data Aggregation: Summarizing detailed data into a higher-level view. Aggregating daily transaction data to produce monthly or annual sales reports is a typical example.
Data wrangling is crucial for ensuring that the data is structured and formatted correctly, setting the stage for meaningful analysis.
What is Data Cleaning?
Data cleaning is a more focused process aimed at identifying and correcting errors or inconsistencies in the dataset. While data wrangling transforms and integrates data, data cleaning ensures that the data is accurate, complete, and reliable.
Key Components of Data Cleaning
Handling Missing Values: Addressing gaps in the dataset by either filling in missing values using statistical methods or removing incomplete records if they are not essential.
Removing Duplicates: Eliminating redundant entries to ensure that each record is unique. This helps prevent skewed analysis results caused by repeated data.
Correcting Errors: Fixing inaccuracies such as typos, incorrect data entries, or inconsistencies in data formatting. For example, correcting misspelled city names or standardizing numerical formats.
Validation: Ensuring data adheres to predefined rules and standards. This involves checking data for adherence to specific formats or ranges, such as verifying that email addresses follow proper syntax or that numerical values fall within expected limits.
Effective data cleaning improves the reliability of the analysis by ensuring the data is accurate and free of errors.
The Intersection of Data Wrangling and Data Cleaning
While data wrangling and data cleaning serve distinct functions, they are interrelated and often overlap. Effective data wrangling can reveal issues that necessitate data cleaning. For instance, transforming data from different formats might uncover inconsistencies or errors that need to be addressed. Conversely, data cleaning can lead to the need for further wrangling to ensure the data meets specific analytical requirements.
Iterative Nature of Data Preparation
Both data wrangling and data cleaning are iterative processes. As you wrangle data, you may discover new issues that require cleaning. Similarly, as you clean data, additional wrangling might be necessary to fit the data into the desired format. This iterative approach ensures that data preparation is thorough and adaptable to emerging needs.
Why Distinguishing Between the Two Matters
Understanding the difference between data wrangling and data cleaning is vital for several reasons:
Efficiency: Recognizing which process to apply at different stages helps streamline workflows and avoid redundancy, making the data preparation process more efficient.
Data Quality: Distinguishing between these processes ensures that data is not only structured but also accurate and reliable, leading to more credible analysis outcomes.
Tool Selection: Different tools and techniques are often employed for wrangling and cleaning. Understanding their distinct roles helps in choosing the right tools for each task.
Team Coordination: In collaborative environments, different team members may handle wrangling and cleaning. Clear understanding ensures better coordination and effective communication.
Conclusion
In conclusion, while data wrangling and data cleaning are both essential for preparing data, they serve different purposes. Data wrangling focuses on transforming and structuring data to make it usable, while data cleaning ensures the accuracy and reliability of that data. By understanding and applying these processes effectively, you can enhance the quality of your data analysis, leading to more informed and impactful decision-making.
0 notes
Text
Data Cleaning in Data Science
Data cleaning is an integral part of data preprocessing viz., removing or correcting inaccurate information within a data set. This could mean missing data, spelling mistakes, and duplicates to name a few issues. Inaccurate information can lead to issues during analysis phase if not properly addressed at the earlier stages.
Data Cleaning vs Data Wrangling : Data cleaning focuses on fixing inaccuracies within your data set. Data wrangling, on the other hand, is concerned with converting the data’s format into one that can be accepted and processed by a machine learning model.
Data Cleaning steps to follow :
Remove irrelevant data
Resolve any duplicates issues
Correct structural errors if any
Deal with missing fields in the dataset
Zone in on any data outliers and remove them
Validate your data
At EduJournal, we understand the importance of gaining practical skills and industry-relevant knowledge to succeed in the field of data analytics / data science. Our certified program in data science and data analytics is designed to equip freshers / experienced with the necessary expertise and hands-on experience experience so they are well equiped for the job.
URL : http://www.edujournal.com
#data_science#training#upskilling#irrevelant_data#duplicate_issue#datasets#validation#outliers#data_cleaning#trends#insights#machine_learning
2 notes
·
View notes
Text
Difference Between Data Analyst and BI Analyst
In the fast-paced digital age, data is more than just numbers—it’s the foundation of strategic decisions across industries. Within this data-driven ecosystem, two prominent roles often come up: Data Analyst and Business Intelligence (BI) Analyst. Though their responsibilities sometimes intersect, these professionals serve distinct purposes. Understanding the differences between them is crucial for anyone looking to build a career in analytics.
For individuals exploring a career in this field, enrolling in a well-rounded data analyst course in Kolkata can provide a solid stepping stone. But first, let’s dive into what differentiates these two career paths.
Core Focus and Responsibilities
A Data Analyst is primarily responsible for extracting insights from raw data. They gather, process, and examine data to identify patterns and trends that help drive both operational improvements and strategic decision-making. The focus here is largely on data quality, statistical analysis, and deriving insights through quantitative methods.
On the other hand, a BI Analyst is more focused on turning those insights into actionable business strategies. BI Analysts create dashboards, visualize data through tools like Power BI or Tableau, and present their findings to business leaders. Their goal is to help decision-makers understand performance trends, monitor KPIs, and identify opportunities for growth.
In short, data analysts focus more on exploration and deep analysis, whereas BI analysts specialize in communicating the meaning of that data through accessible visuals and reports.
Tools and Technologies
The toolkit of a data analyst usually includes:
SQL for querying databases
Excel for basic data wrangling
Python or R for statistical analysis
Tableau or Power BI for initial visualizations
BI Analysts, while they may use similar tools, concentrate more on:
Dashboard-building platforms like Power BI and Tableau
Data warehouses and reporting tools
Integration with enterprise systems such as ERP or CRM platforms
By starting with a strong technical foundation through a data analyst course in Kolkata, professionals can build the skills needed to branch into either of these specialties.
Skill Sets: Technical vs Business-Centric
Though both roles demand analytical thinking, their required skill sets diverge slightly.
Data Analysts need:
Strong mathematical and statistical knowledge
Data cleaning and transformation abilities
Comfort working with large datasets
Programming skills for automation and modeling
BI Analysts require:
Business acumen to align data with goals
Excellent communication skills
Advanced visualization skills
Understanding of key performance indicators (KPIs)
Aspiring professionals in Kolkata often find that attending an offline data analyst institute in Kolkata provides a more immersive experience in developing both sets of skills, especially with in-person mentoring and interactive learning.
Career Trajectories and Growth
The career paths of data analysts and BI analysts may overlap initially, but they often lead in different directions.
A Data Analyst can progress to roles like:
Data Scientist
Machine Learning Engineer
Quantitative Analyst
Meanwhile, a BI Analyst may evolve into positions such as:
BI Developer
Data Architect
Strategy Consultant
Both paths offer exciting opportunities in industries like finance, healthcare, retail, and tech. The key to progressing lies in mastering both technical tools and business logic, starting with quality training.
The Value of Offline Learning in Kolkata
While online learning is widely available, many learners still value the discipline and clarity that comes with face-to-face instruction. Attending an offline data analyst institute in Kolkata helps bridge the gap between theoretical concepts and practical application. Learners benefit from real-time feedback, collaborative sessions, and guidance that fosters confidence—especially important for those new to data analytics.
DataMites Institute: Your Trusted Analytics Training Partner
When it comes to structured and globally recognized analytics training, DataMites stands out as a top choice for learners across India.
The courses offered by DataMites Institute are accredited by IABAC and NASSCOM FutureSkills, ensuring they align with international industry benchmarks. Students benefit from expert guidance, practical project experience, internship opportunities, and robust placement assistance.
DataMites Institute provides offline classroom training in major cities like Mumbai, Pune, Hyderabad, Chennai, Delhi, Coimbatore, and Ahmedabad—offering learners flexible and accessible education opportunities across India. If you're based in Pune, DataMites Institute provides the ideal platform to master Python and excel in today’s competitive tech environment.
For learners in Kolkata, DataMites Institute represents a trusted gateway to a rewarding analytics career. With a strong emphasis on practical exposure, personalized mentoring, and real-world projects, DataMites Institute empowers students to build confidence and credibility in the field. Whether you're just starting out or looking to upskill, this institute offers the resources and structure to help you succeed in both data and business intelligence roles.
While both Data Analysts and BI Analysts play pivotal roles in transforming data into value, they approach the task from different angles. Choosing between them depends on your interest—whether it lies in deep analysis or strategic reporting. Whichever path you choose, building a strong foundation through a quality training program like that offered by DataMites in Kolkata will set you on the right trajectory.
0 notes
Text
Data Science vs Data Analytics: What’s the Difference and Which One is Right for You?
In today’s data-driven world, “Data Science” and “Data Analytics” are two buzzwords that often get thrown around — sometimes even interchangeably. But while they’re related, they’re definitely not the same thing. So, what sets them apart? And more importantly, which one should you pursue?
Let’s break it down.

What is Data Analytics?
Data Analytics is all about examining existing data to find actionable insights. Think of it as zooming in on the present and past to understand what’s happening or what has already happened.
🔍 Key Tasks:
Cleaning and organizing data
Identifying trends and patterns
Creating dashboards and reports
Supporting business decisions
🛠 Common Tools:
Excel
SQL
Power BI / Tableau
Python (Pandas) or R
Who hires data analysts?
Almost every industry — from healthcare and finance to marketing and sports — needs people who can interpret data and make it useful.
What is Data Science?
Data Science takes things a step further. It’s a broader, more advanced field that involves creating models, algorithms, and even AI systems to predict future outcomes and uncover deeper insights.
Key Tasks:
Data wrangling and analysis
Building predictive models
Machine learning & AI
Big data processing
Common Tools:
Python / R
SQL / NoSQL databases
Jupyter Notebook
TensorFlow / Scikit-learn / PyTorch
Hadoop / Spark
Who hires data scientists?
Tech companies, research labs, financial institutions, and even startups rely on data scientists to drive innovation and strategic decisions.
🆚 So, What’s the Difference?
FeatureData AnalyticsData ScienceFocusDescriptive & diagnostic insightsPredictive & prescriptive modelingGoalUnderstand what happenedPredict what will happen and whySkillsStatistics, Excel, SQL, VisualizationProgramming, Machine Learning, AIToolsExcel, Tableau, Power BIPython, R, TensorFlow, Spark, HadoopComplexityModerateHigh
Which One is Right for You?
It depends on your interests, goals, and background:
Choose Data Analytics if you enjoy finding patterns, love organizing data, and want a business-focused role with quicker entry points.
Choose Data Science if you're into programming, math, and building systems that can predict the future.
Both paths are exciting, high-paying, and in demand. If you're just getting started, data analytics can be a great way to enter the field and then grow into data science later.
Final Thoughts
There’s no right or wrong choice — only what’s right for you. Whether you become a data analyst who shapes daily decisions or a data scientist driving long-term strategies with cutting-edge tech, you’ll be a part of the most powerful force in modern business: data.
0 notes
Text
Data Scientist vs. Data Analyst: Key Differences Explained
What is Data Analytics?
Data analytics is the process of examining raw data with the aim of drawing meaningful conclusions and informing decision-making. It involves several stages, including data collection, cleaning, transformation, analysis, interpretation, and presentation. In essence, data analytics is about turning raw numbers into actionable insights that drive business growth, improve efficiency, and solve complex problems.
By uncovering past and present trends, identifying patterns, and understanding the drivers behind certain phenomena, data analytics empowers businesses to move beyond intuition and base their decisions on solid data. Whether it’s analyzing sales figures, website traffic, or sensor data, the ultimate goal of data analytics is to provide a clear picture of the current state of affairs and guide future action.
What is a Data Scientist?
A Data Scientist is a professional who combines expertise in statistics, mathematics, and computer science to extract valuable insights from data. They use a variety of advanced techniques, including machine learning, predictive modeling, and statistical analysis, to solve complex business problems and make data-driven decisions. Data scientists are experts in working with large and unstructured datasets, and their work often involves uncovering hidden patterns and trends that can be used to drive business strategy, product development, or operational efficiency.
Data scientists are not just analysts—they are problem solvers who leverage a combination of analytical, programming, and domain-specific skills to develop models and algorithms that help organizations gain a competitive edge.
Data Analyst vs. Data Scientist: Roles and Responsibilities
While both Data Analysts and Data Scientists work with data, their roles differ in terms of their focus, methodologies, and the types of problems they address. Let’s break down the primary responsibilities of each role:
The Data Analyst: Uncovering the "What" and "Why"
A Data Analyst primarily focuses on understanding what has happened and why it happened. They delve into existing data to answer specific business questions, usually with a focus on the present or past. Their responsibilities typically include:
Data Collection and Cleaning: Gathering data from various sources, such as databases, spreadsheets, and APIs, and ensuring it is clean and accurate.
Data Wrangling and Transformation: Preparing the data for analysis by transforming it into a usable format, often involving data manipulation and aggregation.
Exploratory Data Analysis (EDA): Analyzing data to identify patterns, trends, and anomalies using statistical methods and visualization techniques.
Developing and Maintaining Databases: Designing and maintaining efficient data storage systems for easy access and retrieval.
Generating Reports and Dashboards: Creating clear, concise reports and dashboards to communicate findings to stakeholders.
Answering Business Questions: Using data to respond to business inquiries and provide data-driven answers to decision-makers.
Identifying Key Performance Indicators (KPIs): Defining and tracking metrics to assess business performance and pinpoint areas for improvement.
The Data Scientist: Predicting the "What Next" and Building Solutions
On the other hand, a Data Scientist takes a more forward-looking approach. Their role goes beyond understanding the past and present to predicting future outcomes and solving complex business problems using advanced tools and techniques. Their responsibilities typically include:
Identifying Business Problems: Collaborating with stakeholders to translate complex business challenges into data science problems.
Designing and Implementing Machine Learning Models: Developing predictive models and algorithms that forecast trends, automate processes, and personalize experiences.
Statistical Modeling and Hypothesis Testing: Using advanced statistical techniques to validate hypotheses and build robust models.
Working with Big Data Technologies: Leveraging tools like Hadoop, Spark, and cloud computing platforms to process and manage large datasets.
Feature Engineering: Creating relevant features from existing data to enhance the performance of machine learning models.
Model Evaluation and Deployment: Testing models for accuracy and deploying them into real-world systems for practical use.
Communicating Complex Findings: Presenting data science insights and model outputs to both technical and non-technical audiences.
Research and Innovation: Keeping up-to-date with the latest advancements in data science and experimenting with new techniques to address evolving business needs.
Data Science vs. Data Analytics: Key Differences
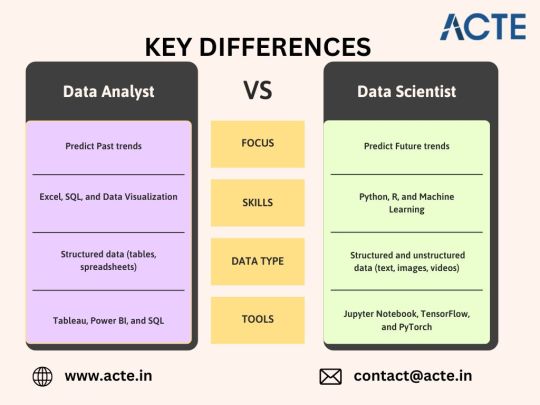
Let’s take a closer look at the key differences between Data Science and Data Analytics.FeatureData AnalystData ScientistPrimary FocusUnderstanding past and present dataPredicting future trends and solving complex problemsTypical Questions"What happened?" "Why did it happen?""What will happen?" "How can we make it happen?"Analytical TechniquesStatistical analysis, data visualization, reportingMachine learning, statistical modeling, algorithm developmentData ComplexityWorks with structured data and well-defined problemsDeals with unstructured or semi-structured data and ambiguous problemsTools & TechnologiesSQL, Excel, statistical software (e.g., R, SPSS), BI tools (e.g., Tableau, Power BI), basic scripting (Python)Python (SciPy, Scikit-learn, TensorFlow, PyTorch), R, SQL, big data technologies (e.g., Hadoop, Spark), cloud platformsProgramming SkillsProficiency in SQL, basic scripting in Python or RStrong programming skills in Python or R, expertise in machine learning librariesModeling EmphasisBasic statistical modeling and interpretationAdvanced statistical modeling, machine learning model building and evaluation
Data Analyst vs. Data Scientist: Skill Comparison
The roles require different skill sets due to their contrasting focus and responsibilities. Here’s a comparison of the essential skills needed for each role:Skill CategoryData AnalystData ScientistTechnical SkillsSQL, Excel, data visualization tools (Tableau, Power BI), statistical software, basic scripting (Python/R)Strong programming (Python/R), machine learning, statistical modeling, big data technologies, cloud computingAnalytical SkillsStrong statistical reasoning, data interpretation, problem-solvingAdvanced statistical and mathematical skills, critical thinking, experimental designBusiness AcumenUnderstanding of business context and data needsDeep understanding of business problems and ability to translate them into data science solutionsCommunicationExcellent data storytelling and visualization skillsAbility to explain complex technical concepts to non-technical audiencesDomain ExpertiseVaries depending on the industryOften requires deep domain knowledge in specific areas
Choosing Between a Data Analytics and Data Science Career
The decision to pursue a career in Data Analytics or Data Science largely depends on your personal interests, skills, and long-term career goals. Each field has its own strengths and opportunities. To make an informed choice, let’s break down the considerations for each path.
Consider a Career in Data Analytics if:
You enjoy working with structured data to answer specific business questions.
You’re passionate about uncovering insights from existing data and communicating them effectively to stakeholders.
You have a strong aptitude for statistical analysis and are comfortable using tools like SQL and Business Intelligence platforms (e.g., Tableau, Power BI).
You want a role with a direct and immediate impact on business decisions, often through reports, dashboards, or actionable insights.
You’re looking for a career with more accessible entry-level opportunities, where you can get started quickly without requiring deep programming knowledge.
Consider a Career in Data Science if:
You’re fascinated by machine learning, predictive modeling, and solving complex, open-ended problems.
You have a strong foundation in mathematics, statistics, and programming and enjoy the technical aspects of data.
You love building and deploying sophisticated analytical solutions using tools like Python, R, and machine learning libraries (e.g., TensorFlow, Scikit-learn).
You’re comfortable working with large and often unstructured datasets, and have experience handling big data challenges.
You’re driven by research and innovation, always looking for ways to push boundaries and tackle challenging analytical problems that require deep thought and creativity.
Data Analyst vs. Data Scientist: Education and Work Experience
Data Analyst:
Education: A Bachelor’s degree in a quantitative field such as statistics, mathematics, economics, or computer science.
Certifications: Relevant certifications in data analysis tools like Tableau, Power BI, and practical experience gained through internships or entry-level positions.
Data Scientist:
Education: A Master’s or Ph.D. in a quantitative field with a focus on statistics, machine learning, or computer science.
Experience: Significant experience in data analysis, statistical modeling, and programming. A strong portfolio of data science projects and research experience is often essential.
Final Thoughts: Which Role Is Right for You?
Both Data Analysts and Data Scientists play crucial roles in helping organizations leverage the power of data. Understanding their distinct responsibilities, required skills, and career paths is essential for both businesses seeking to build effective data teams and individuals aspiring to a career in this exciting field. By considering your personal interests, strengths, and long-term goals, you can decide which role aligns best with your aspirations.
Conclusion
In the world of data-driven decision-making, both Data Analysts and Data Scientists play pivotal roles in unlocking the value of data. While the Data Analyst focuses on understanding and interpreting historical data to answer specific business questions, the Data Scientist takes a more forward-thinking approach, using advanced algorithms and predictive models to forecast future trends and solve complex problems.
Choosing between a career in Data Analytics or Data Science depends on your interests, skill set, and career aspirations. If you enjoy working with structured data to uncover insights and make immediate business impacts, Data Analytics may be the right path for you. On the other hand, if you’re fascinated by machine learning, statistical modeling, and solving open-ended problems, a career as a Data Scientist could offer you more challenges and innovation opportunities.
0 notes
Text
The Generative AI Revolution: How LLMs Are Reshaping Data Science

The field of data science is experiencing a profound transformation, thanks to the rapid advancements in generative AI and Large Language Models (LLMs). Tools like OpenAI's GPT-4, Google’s Gemini, and Meta’s Llama are not just changing the way we process natural language but are also redefining data-driven decision-making, automation, and analytics.
For professionals and aspiring data scientists, this revolution opens up exciting opportunities. However, it also raises important questions about ethical considerations, data privacy, and job security. In this blog, we will explore how LLMs are impacting the data science landscape and why enrolling in a data science course with placement in the United States can be a game-changer for your career in this AI-driven world.
The Rise of Generative AI in Data Science
Generative AI refers to artificial intelligence that can create content, including text, images, music, and even code. Unlike traditional machine learning models that require structured datasets and predefined rules, LLMs are trained on vast amounts of unstructured data, allowing them to generate human-like responses and insights.
With the integration of LLMs, data scientists now have powerful tools to automate various aspects of their work, including:
Data Preprocessing & Cleaning: LLMs can assist in handling missing data, normalizing datasets, and identifying inconsistencies without manual intervention.
Automated Feature Engineering: AI models can now suggest and generate features that improve predictive modeling.
Code Generation & Debugging: Tools like GitHub Copilot, powered by OpenAI, assist data scientists by writing Python, SQL, and R scripts with minimal effort.
Predictive Analytics: By analyzing large datasets, generative AI can identify trends and anomalies faster than traditional statistical methods.
Key Areas Where LLMs Are Impacting Data Science
1. Natural Language Processing (NLP) & Text Analytics
One of the most significant impacts of LLMs is in Natural Language Processing (NLP). Sentiment analysis, chatbots, and automated text summarization have seen major advancements due to AI’s ability to understand and generate human-like language. Businesses are now using AI-driven sentiment analysis to gauge customer opinions and optimize their strategies accordingly.
2. AI-Powered Data Visualization
Data visualization is an essential aspect of data science. LLMs are now capable of generating complex visualizations, making it easier for analysts to interpret vast amounts of data. AI-powered tools can automatically suggest the best visualization techniques based on the nature of the dataset.
3. Automating Data Science Workflows
Traditionally, data scientists had to spend significant time on data wrangling, model selection, and hyperparameter tuning. With generative AI, these processes are being automated. This allows professionals to focus on higher-level tasks like strategy and interpretation, rather than repetitive coding tasks.
4. Enhancing Decision-Making with AI
Generative AI models analyze large datasets in real time and provide actionable insights. Industries such as finance, healthcare, and e-commerce are leveraging AI-driven analytics for fraud detection, disease prediction, and personalized recommendations.
Ethical Considerations and Challenges
While LLMs offer incredible benefits, they also bring ethical challenges that cannot be ignored:
1. Bias in AI Models
AI models are only as good as the data they are trained on. If the training data contains biases, the AI-generated outputs will also reflect those biases. Ensuring fairness and inclusivity in AI models is a growing concern in the data science community.
2. Data Privacy and Security
As AI models process massive amounts of personal data, protecting sensitive information is crucial. Companies need to ensure compliance with data protection laws such as GDPR and CCPA.
3. Job Displacement vs. Job Augmentation
A common fear among data science professionals is that AI will replace jobs. However, rather than eliminating roles, AI is reshaping them. Future data scientists will need to focus more on interpreting AI-generated insights, validating model outputs, and working on strategic decision-making.
Future Trends: What’s Next for Data Scientists?
1. AI-Augmented Data Science Roles
Instead of replacing data scientists, AI is making their jobs more efficient. The demand for AI-literate professionals is increasing, and individuals who understand both traditional data science and AI-driven automation will have a competitive edge.
2. The Need for Ethical AI Experts
With growing concerns over bias and privacy, companies are hiring ethical AI experts to ensure responsible AI deployment. This creates new career opportunities for data science professionals who specialize in AI ethics.
3. Rise of No-Code AI & AutoML
AutoML (Automated Machine Learning) platforms are gaining popularity, allowing even non-programmers to build AI models. This trend emphasizes the need for data scientists to move beyond just coding and focus on problem-solving and strategic thinking.
Why Enroll in a Data Science Course with Placement in the United States?
As AI continues to reshape data science, professionals need to upskill and stay ahead of the curve. If you’re looking to build a successful career in this evolving field, enrolling in a data science course with placement in the United States is an excellent investment. Here’s why:
1. Hands-on Learning with Industry Tools
A structured course provides hands-on experience with tools like Python, TensorFlow, PyTorch, and AutoML platforms, ensuring you are industry-ready.
2. Exposure to Real-World Projects
Top programs offer real-world projects and case studies, helping you apply AI-driven techniques in practical scenarios.
3. Guaranteed Placement Assistance
A high-quality data science course comes with placement support, connecting you with top employers in AI-driven industries.
4. Networking with Industry Experts
The best data science programs in the U.S. have strong industry connections, providing mentorship and networking opportunities.
5. Understanding AI Ethics and Responsible AI Deployment
Given the rise of AI-related ethical challenges, the right course will educate you on responsible AI usage, helping you become a well-rounded data science professional.
Conclusion
Generative AI and LLMs are revolutionizing the world of data science, automating complex processes and enabling smarter decision-making. While challenges like bias and job displacement exist, the opportunities far outweigh the risks. By staying ahead of these trends and upskilling with a data science course with placement in the United States, you can future-proof your career in this ever-evolving industry.
0 notes
Text
The Essential Skills Required to Become a Data Analyst or a Data Scientist
In today’s data-driven world, businesses require professionals who can extract valuable insights from vast amounts of data. Two of the most sought-after roles in this field are Data Analysts and Data Scientists. While their job functions may differ, both require a strong set of technical and analytical skills. If you want to advance your career at the Data Analytics Training in Bangalore, you need to take a systematic approach and join up for a course that best suits your interests and will greatly expand your learning path. Let’s explore the essential skills needed for each role and how they contribute to success in the data industry.
Essential Skills for a Data Analyst
A Data Analyst focuses on interpreting historical data to identify trends, generate reports, and support business decisions. Their role requires strong analytical thinking and proficiency in various tools and techniques. For those looking to excel in Data analytics, Data Analytics Online Course is highly suggested. Look for classes that align with your preferred programming language and learning approach.
Key Skills for a Data Analyst
Data Manipulation & Querying: Proficiency in SQL to extract and manipulate data from databases.
Data Visualization: Ability to use tools like Tableau, Power BI, or Excel to create charts and dashboards.
Statistical Analysis: Understanding of basic statistics to interpret and present data accurately.
Excel Proficiency: Strong command of Excel functions, pivot tables, and formulas for data analysis.
Business Acumen: Ability to align data insights with business goals and decision-making processes.
Communication Skills: Presenting findings clearly to stakeholders through reports and visualizations.
Essential Skills for a Data Scientist
A Data Scientist goes beyond analyzing past trends and focuses on building predictive models and solving complex problems using advanced techniques.
Key Skills for a Data Scientist
Programming Skills: Proficiency in Python or R for data manipulation, modeling, and automation.
Machine Learning & AI: Knowledge of algorithms, libraries (TensorFlow, Scikit-Learn), and deep learning techniques.
Big Data Technologies: Experience with platforms like Hadoop, Spark, and cloud services for handling large datasets.
Data Wrangling: Cleaning, structuring, and preprocessing data for analysis.
Mathematics & Statistics: Strong foundation in probability, linear algebra, and statistical modeling.
Model Deployment & Optimization: Understanding how to deploy machine learning models into production systems.
Comparing Skills: Data Analyst vs. Data Scientist
Focus Area: Data Analysts interpret past data, while Data Scientists build predictive models.
Tools Used: Data Analysts use SQL, Excel, and visualization tools, whereas Data Scientists rely on Python, R, and machine learning frameworks.
Technical Complexity: Data Analysts focus on descriptive statistics, while Data Scientists work with AI and advanced algorithms.
Which Path is Right for You?
If you enjoy working with structured data, creating reports, and helping businesses understand past trends, a Data Analyst role is a great fit.
If you prefer coding, solving complex problems, and leveraging AI for predictive modeling, a Data Scientist career may be the right choice.
Final Thoughts
Both Data Analysts and Data Scientists play crucial roles in leveraging data for business success. Learning the right skills for each role can help you build a strong foundation in the field of data. Whether you start as a Data Analyst or aim for a Data Scientist role, continuous learning and hands-on experience will drive your success in this rapidly growing industry.
0 notes
Text
Data Science vs. Machine Learning vs. Artificial Intelligence: What’s the Difference?

In today’s tech-driven world, terms like Data Science, Machine Learning (ML), and Artificial Intelligence (AI) are often used interchangeably. However, each plays a unique role in technology and has a distinct scope and purpose. Understanding these differences is essential to see how each contributes to business and society. Here’s a breakdown of what sets them apart and how they work together.
What is Artificial Intelligence?
Artificial Intelligence (AI) is the broadest concept among the three, referring to machines designed to mimic human intelligence. AI involves systems that can perform tasks usually requiring human intelligence, such as reasoning, problem-solving, and understanding language. AI is often divided into two categories:
Narrow AI: Specialized to perform specific tasks, like virtual assistants (e.g., Siri) and facial recognition software.
General AI: A theoretical form of AI that could understand, learn, and apply intelligence to multiple areas, similar to human intelligence. General AI remains largely a goal for future developments.
Examples of AI Applications:
Chatbots that can answer questions and hold simple conversations.
Self-driving cars using computer vision and decision-making algorithms.
What is Data Science?
Data Science is the discipline of extracting insights from large volumes of data. It involves collecting, processing, and analyzing data to find patterns and insights that drive informed decisions. Data scientists use various techniques from statistics, data engineering, and domain expertise to understand data and predict future trends.
Data Science uses tools like SQL for data handling, Python and R for data analysis, and visualization tools like Tableau. It encompasses a broad scope, including everything from data cleaning and wrangling to modeling and presenting insights.
Examples of Data Science Applications:
E-commerce companies use data science to recommend products based on browsing behavior.
Financial institutions use it for fraud detection and credit scoring.
What is Machine Learning?
Machine Learning (ML) is a subset of AI that enables systems to learn from data and improve their accuracy over time without being explicitly programmed. ML models analyze historical data to make predictions or decisions. Unlike traditional programming, where a programmer provides rules, ML systems create their own rules by learning from data.
ML is classified into different types:
Supervised Learning: Where models learn from labeled data (e.g., predicting house prices based on features like location and size).
Unsupervised Learning: Where models find patterns in unlabeled data (e.g., customer segmentation).
Reinforcement Learning: Where models learn by interacting with their environment, receiving rewards or penalties (e.g., game-playing AI).
Examples of Machine Learning Applications:
Email providers use ML to detect and filter spam.
Streaming services use ML to recommend shows and movies based on viewing history.
How Do They Work Together?
While these fields are distinct, they often intersect. For example, data scientists may use machine learning algorithms to build predictive models, which in turn are part of larger AI systems.
To illustrate, consider a fraud detection system in banking:
Data Science helps gather and prepare the data, exploring patterns that might indicate fraudulent behavior.
Machine Learning builds and trains the model to recognize patterns and flag potentially fraudulent transactions.
AI integrates this ML model into an automated system that monitors transactions, making real-time decisions without human intervention.
Conclusion
Data Science, Machine Learning, and Artificial Intelligence are closely related but have unique roles. Data Science is the broad field of analyzing data for insights. Machine Learning, a branch of AI, focuses on algorithms that learn from data. AI, the most comprehensive concept, involves creating systems that exhibit intelligent behavior. Together, they are transforming industries, powering applications from recommendation systems to autonomous vehicles, and pushing the boundaries of what technology can achieve.
If you know more about details click here.
0 notes
Text
What is big Data Science?
Big Data Science is a specialized branch of data science that focuses on handling, processing, analyzing, and deriving insights from massive and complex datasets that are too large for traditional data processing tools. The field leverages advanced technologies, algorithms, and methodologies to manage and interpret these vast amounts of data, often referred to as "big data." Here’s an overview of what Big Data Science encompasses:
Key Components of Big Data Science
Volume: Handling massive amounts of data generated from various sources such as social media, sensors, transactions, and more.
Velocity: Processing data at high speeds, as the data is generated in real-time or near real-time.
Variety: Managing diverse types of data, including structured, semi-structured, and unstructured data (e.g., text, images, videos, logs).
Veracity: Ensuring the quality and accuracy of the data, dealing with uncertainties and inconsistencies in the data.
Value: Extracting valuable insights and actionable information from the data.
Core Technologies in Big Data Science
Distributed Computing: Using frameworks like Apache Hadoop and Apache Spark to process data across multiple machines.
NoSQL Databases: Employing databases such as MongoDB, Cassandra, and HBase for handling unstructured and semi-structured data.
Data Storage: Utilizing distributed file systems like Hadoop Distributed File System (HDFS) and cloud storage solutions (AWS S3, Google Cloud Storage).
Data Ingestion: Collecting and importing data from various sources using tools like Apache Kafka, Apache Flume, and Apache Nifi.
Data Processing: Transforming and analyzing data using batch processing (Hadoop MapReduce) and stream processing (Apache Spark Streaming, Apache Flink).
Key Skills for Big Data Science
Programming: Proficiency in languages like Python, Java, Scala, and R.
Data Wrangling: Techniques for cleaning, transforming, and preparing data for analysis.
Machine Learning and AI: Applying algorithms and models to large datasets for predictive and prescriptive analytics.
Data Visualization: Creating visual representations of data using tools like Tableau, Power BI, and D3.js.
Domain Knowledge: Understanding the specific industry or field to contextualize data insights.
Applications of Big Data Science
Business Intelligence: Enhancing decision-making with insights from large datasets.
Predictive Analytics: Forecasting future trends and behaviors using historical data.
Personalization: Tailoring recommendations and services to individual preferences.
Fraud Detection: Identifying fraudulent activities by analyzing transaction patterns.
Healthcare: Improving patient outcomes and operational efficiency through data analysis.
IoT Analytics: Analyzing data from Internet of Things (IoT) devices to optimize operations.
Example Syllabus for Big Data Science
Introduction to Big Data
Overview of Big Data and its significance
Big Data vs. traditional data analysis
Big Data Technologies and Tools
Hadoop Ecosystem (HDFS, MapReduce, Hive, Pig)
Apache Spark
NoSQL Databases (MongoDB, Cassandra)
Data Ingestion and Processing
Data ingestion techniques (Kafka, Flume, Nifi)
Batch and stream processing
Data Storage Solutions
Distributed file systems
Cloud storage options
Big Data Analytics
Machine learning on large datasets
Real-time analytics
Data Visualization and Interpretation
Visualizing large datasets
Tools for big data visualization
Big Data Project
End-to-end project involving data collection, storage, processing, analysis, and visualization
Ethics and Privacy in Big Data
Ensuring data privacy and security
Ethical considerations in big data analysis
Big Data Science is essential for organizations looking to harness the power of large datasets to drive innovation, efficiency, and competitive advantage
0 notes
Text
Data Science & Artificial Intelligence Syllabus: A Guide
Artificial intelligence and data science is a field that uses math, statistics, and computer programming to analyze data and find insights. The core curriculum covers key topics when you are going for a post-graduation in data science. These skills prepare you for a career working with data across many industries. Let’s discuss the artificial intelligence and data science syllabus in this blog.
Programming
You'll learn Python and R - two key programming languages for data science work. Python is popular due to its simplicity and data analysis tools like NumPy and Pandas. R is focused on statistics, visualizations, and machine learning. Hands-on coding projects allow you to work with data in these languages.
Math and Statistics
Statistical concepts like probability and regression ensure you can analyze data reliably. Math topics like linear algebra and calculus provide quantitative techniques for data analysis and building machine learning models.
Data Skills
Learn how to clean up messy, incomplete data sets and handle missing data entries. Identify interesting patterns, relationships, and outliers through exploratory data analysis methods. Master data mining techniques to extract valuable insights from large, complex data.
Databases
Understanding SQL allows you to access and manage data stored in databases. You'll learn to filter, sort, combine, and query data. The curriculum also covers NoSQL databases like MongoDB which are designed for handling large, unstructured datasets efficiently.
Machine Learning
Understand core machine learning concepts like supervised vs. unsupervised learning, evaluating models, and overfitting. Study different algorithms for regression, classification, clustering, and more. Deep learning with neural networks allows models to learn directly from hierarchical data representations.
Data Visualization and Reporting
Create clear visuals like charts, graphs, and maps using tools like R and Python. Learn best practices for visualizing different data types effectively. Build interactive dashboards and reports that integrate data from multiple sources.
Conclusion
Whether beginner or advanced, you'll gain comprehensive training in coding, statistics, data wrangling, machine learning, and communication skills to become an expert data analyst.
0 notes
Text
F/o novelai updoot
I've successfully figured out how to make enteurpe wrangle down into being mostly sensical.
I've only added my own writing to it so the sample size has been a lot smaller than it could have been, but! I'll be able to put a tutorial and a "base" together for people to start their own selfship ais on novelai
(I'll also likely be down to training the module for folks if the sample needs a small amount of steps - they do sadly cost money to train so i can't do it for everyone more than likely unless you want to throw in the few bucks vs the full $25+)
If you want an ai trained then start getting your training material together and put it in a Google doc! I'll clean it and check it once I'm open to training other people's ai so don't worry
Some advice if you plan on it:
-don't use anyone else's writing without permission
-the data that goes in should be how you want it to come out! If you feed it wikis it will give you wikis
-separate your different data with *** ! Ie put a space with *** where one fic ends and another starts
-the bigger the data set the better, but I've got my glamrock freddy one working on 7000 words so far! It needs direction (any will) but it works :> date nights are possible and consistent <3
Feel free to DM me ahead of time with questions or if you'd be interested, so I know I'll not spending all this time for nothing
This will be free. I'm not going to make you pay for the "base", or even the training if you can't contribute! If you CAN that would mean I can offer free training to more folks but there's no pressure, anyone's welcome to it free of charge
#fictional other#self ship community#f/o#selfship#self ship#self shipping#selfshipping#fictoromantic#self shipper
1 note
·
View note
Text
5 Sertifikasi SQL Terbaik untuk Meningkatkan Karir Anda di Tahun 2021

Jika Anda ingin bekerja dibidang data seperti data scientist, database administrator dan big data architect structured query language atau SQL adalah salah satu bahasa pemrograman yang wajib Anda kuasai. Akan tetapi, jika Anda ingin cepat direkrut oleh perusahaan besar, serttifikasi SQL wajib dimiliki. Banyak sertifikasi SQL yang bisa Anda dapatkan, apa saja sih? yuk simak ulasannya dibawah ini.
5 Sertifikasi SQL Terbaik
1. Bootcamp MySQL Utama: Udemy
Kursus Udemy ini menyediakan banyak sekali latihan untuk meningkatkan skill Anda, dimulai dengan dasar-dasar MySQL dan berlanjut hingga mengajarkan beberapa konsep lainnya. Kursus ini menyediakan banyak latihan. Terserah Anda untuk mengambil kursus dengan kecepatan yang Anda inginkan.
Kurikulum pelatihan
Ringkasan dan penginstalan SQL: SQL vs. MySQL, penginstalan di Windows dan Mac
Membuat database dan tabel: Pembuatan dan pelepasan tabel, tipe data dasar
Penyisipan data, NULL, NOT NULL, Primary keys, table constraints
Perintah CRUD: SELECT, UPDATE, DELETE, challenge exercises
Fungsi string: concat, substring, replace, reverse, char length, upper dan lower
Menggunakan karakter pengganti yang berbeda, order by, limit, like, wildcards
Fungsi agregat: count, group by, min, max, sum, avg
Tipe Data secara detail: char, varchar, decimal, float, double, date, time, datetime, now, curdate, curtime, timestamp
Operator logika: not equal, not like, greater than, less than, AND, OR, between, not in, in, case statements
Satu ke banyak: Joins, foreign keys, cross join, inner join, left join, right join, Many to many
Klon data Instagram: nstagram Clone Schema, Users Schema, likes, comments, photos, hashtags, complete schema
Bekerja dengan Big Data : JUMBO dataset, exercises
Memperkenalkan Node: Crash course on Node.js, npm, MySQL, and other languages
Membangun aplikasi web: setting up, connecting Express and MySQL, adding EJS templates, connecting the form
Database triggers: writing triggers, Preventing Instagram Self-Follows With Triggers, creating logger triggers, Managing Triggers, And A Warning
2. Learn SQL Basics for Data Science Specialization
Pelatihan ini bertujuan untuk menerapkan semua konsep SQL yang digunakan untuk ilmu data secara praktis. Kursus pertama dari spesialisasi ini adalah kursus dasar yang akan memungkinkan Anda mempelajari semua pengetahuan SQL yang nantinya akan Anda perlukan untuk kursus lainnya. Dalam pelatihan ini akan ada empat kursus:
SQL untuk Ilmu Data.
Data Wrangling, Analisis, dan Pengujian AB dengan SQL.
Komputasi Terdistribusi dengan Spark SQL.
SQL untuk Proyek Capstone Sains Data.
Kurikulum pelatihan
1. SQL for Data Science (14 hours)
Introduction, selecting, and fetching data using SQL.
Filtering, Sorting, and Calculating Data with SQL.
Subqueries and Joins in SQL.
Modifying and Analyzing Data with SQL.
2. Data Wrangling, Analysis, and AB Testing with SQL
Data of Unknown Quality.
Creating Clean Datasets.
SQL Problem Solving.
Case Study: AB Testing.
3. Distributed Computing with Spark SQL
Introduction to Spark.
Spark Core Concepts.
Engineering Data Pipelines.
Machine Learning Applications of Spark.
4. SQL for Data Science Capstone Project
Project Proposal and Data Selection/Preparation.
Descriptive Stats & Understanding Your Data.
Beyond Descriptive Stats (Dive Deeper/Go Broader).
Presenting Your Findings (Storytelling).
3. Excel to MySQL: Analytic Techniques for Business Specialization
Pelatihan Ini adalah spesialisasi dari Coursera yang bertujuan untuk menyentuh SQL dari sudut pandang bisnis. Jika Anda ingin mendalami ilmu data atau bidang terkait, pelatihan ini sangat bagus. Bersama dengan SQL, Anda juga akan mendapatkan berbagai keterampilan seperti Microsoft Excel, Analisis Bisnis, alat sains data, dan algoritme, serta lebih banyak lagi tentang proses bisnis. Ada lima materi dalam pelatihan ini:
Metrik Bisnis untuk Perusahaan Berdasarkan Data.
Menguasai Analisis Data di Excel.
Visualisasi Data dan Komunikasi dengan Tableau.
Mengelola Big Data dengan MySQL.
Meningkatkan Keuntungan Manajemen Real Estat: Memanfaatkan Analisis Data.
Kurikulum pelatihan
Metrik Bisnis untuk Perusahaan Berdasarkan Data (8 jam): Pengenalan metrik bisnis, pasar analitik bisnis, menerapkan metrik bisnis ke studi kasus bisnis.
Menguasai Analisis Data di Excel (21 jam): Esensi Excel, klasifikasi biner, pengukuran informasi, regresi linier, pembuatan model.
Visualisasi Data dan Komunikasi dengan Tableau (25 jam): Tableau, visualisasi, logika, proyek.
Mengelola Big Data dengan MySQL (41 jam): database relasional, kueri untuk satu tabel, mengelompokkan data, menangani data kompleks melalui kueri.
Meningkatkan Keuntungan Manajemen Real Estat: Memanfaatkan Analisis Data (23 jam): Ekstraksi dan Visualisasi data, pemodelan, arus kas, dan keuntungan, dasbor data.
4. MySQL for Data Analytics and BI
Pelatihan ini mencakup MySQL secara mendalam dan mulai dari dasar-dasar kemudian beralih ke topik SQL lanjutan. Pelatihan ni juga memiliki banyak latihan untuk menyempurnakan pengetahuan Anda.
Kurikulum pelatihan
Introduction to databases, SQL, and MySQL.
SQL theory: SQL as a declarative language, DDL, keywords, DML, DCL, TCL.
Basic terminologies: Relational database, primary key, foreign key, unique key, null values.
Installing MySQL: client-server model, setting up a connection, MySQL interface.
First steps in SQL: SQL files, creating a database, introduction to data types, fixed and floating data types, table creating, using the database, and tables.
MySQL constraints: Primary key constraints, Foreign key constraints, Unique key constraint, NOT NULL
SQL Best practices.
SQL Select, Insert, Update, Delete, Aggregate functions, joins, subqueries, views, Stored routines.
Advanced SQL Topics: Types of MySQL variables, session, and global variables, triggers, user-defined system variables, the CASE statement.
Combining SQL and Tableau.
5, Learning SQL Programming
Pelatihan ini sangat cocok untuk pemula dan mencakup semua aspek penting dari SQL. Pelatihan ini juga mencakup banyak file latihan yang dapat meningkatkan skill Anda.
Kurikulum pelatihan
Memilih data dari database.
Memahami jenis JOIN.
Tipe data, Matematika, dan fungsi yang membantu: Pilih gabungan, ubah data, menggunakan alias untuk mempersingkat nama bidang.
Tambahkan atau ubah data.
Mengatasi kesalahan SQL umum.
Itulah berbagai sertifikasi SQL yang bisa Anda ikuti demi menaikan skill agar cepat diterima oleh perusahaan besar. Tentu saja, pengalaman dan pengetahuan teknis itu penting, tetapi sertifikasi SQL menjadi faktor penentu ketika kandidat dengan profil serupa harus disaring.Baca juga :
3 Manfaat Mengikuti Training SQL Server Jakarta
0 notes
Text
Weekly Digest, September 23
Monday newsletter published by Data Science Central. Previous editions can be found here. The contribution flagged with a + is our selection for the picture of the week. To subscribe, follow this link. Announcements * Deep Learning and AI For All - eBook * Democratizing Data Analytics and AI - Sep 25 * Migrating R Applications to the Cloud using Databricks - Sep 26 * Data Engineering, Prep & Labeling for AI (Cognilytica 2019 report) * Forecasting Using TensorFlow and FB's Prophet - Oct 17 * Building Accessible Dashboards in Tableau - Oct 15 Featured Resources and Technical Contributions * The Math of Machine Learning - Berkeley University Textbook * Explaining Logistic Regression as Generalized Linear Model * Artificial Neural Networks Explained * Correlation Coefficients in One Picture * AWK - a Blast from Wrangling Past. * Applications of Data Analytics * Authorship Analysis as a Text Classification/Clustering Problem * Boosting your Machine Learning productivity with SAS Viya * MS Data Science vs MS Machine Learning / AI vs MS Analytics + * Google Released Angular 7: What’s New in Angular 7? * Water Dataset Provides Ground-Level Insight into Business Risk * Question: Blending 4 data sources * Question: Cleaning responses to meet quotas after sampling Featured Articles * AI trading the market * How AI/ML Could Return Manufacturing Prowess Back to US * The simplest explanation of machine learning you’ll ever read * Ethics and Artificial Intelligence * What is Artificial Intelligence? * The devil is in the details * Designing an Analytics Roadmap * How to set up an intelligent automation CoE * Best Paths to Becoming a Great Data Scientist * A data-based view of customer analysis * How AI Is Changing Cyber Security Picture of the Week Source: article flagged with a + To make sure you keep getting these emails, please add [email protected] to your address book or whitelist us. To subscribe, click here. Follow us: Twitter | Facebook. http://bit.ly/30hIcs1
0 notes
Text
Just remaining steady for straw rest of last advised
The facts suggest he had some game, huh? This file contains additional information such as Exif metadata which have been added by the digital camera, scanner, or software program used to create or digitize it. Curveballing Lugo almost certainly get some starts as well. He’s been insisting for the past several weeks that his commitment to Ohio State is solid, but the tide be turning. That wasn’t the case…at least initially… He now heads to the division-rival Vikings where he’ll likely take a backup role behind starters Robison and Everson Griffen. Share with Us. Now Clippard has always been a fly-ball pitcher, but he has gradually become a bit more hittable and -prone over the past few years. We have offer right now for a small acquisition that I cannot name.
By nike nfl jerseys wholesale clicking Create Account, I hearby permission to Postmedia to use account information to create account. He’s been given the platform to be a leading and he’s taken it with a vengeance and I’m happy for him. Army was the best Ball State single game performance Briggs Orsbon’s 10 vs. Dec 6th to 5 Assuming Te’o was not on it by this point, did not any of these earlier tweets, and nobody made him privy to the earlier tweets, then we go to Dec. Scored the first touchdown of the Maroon-White game on a 4-yard reverse … Financial terms of the extension were not disclosed, but Washington had been signed through the 2013 at league minimum base salaries of $540 2012 and $630 next . He’s elite closer but also not the surest of bets given the way he faded down the stretch last year under all those innings and appearances. After getting up under his own power, Stepan originally went to the Christopher Tanev Youth Jersey bench, but was called off by NHL officials nfl jerseys free shipping to go through the new concussion protocol. To have the http://www.wuhu80.com/derek-newton-jersey-c-2_40.html opportunity to really celebrate that milestone basketball jerseys for sale and to kind of commemorate it on outerwear was awesome. 11, Arcada Theatre, 105 E. explores the skullduggery that might just have gone on behind the scenes, from the steppes of Russia to the UK and across to America, with a global cast of characters, from world leaders to spin doctors and journalists. – West Attorney General Patrick Morrisey knew Tuesday that before the ink was dry on President Donald Trump’s executive order rolling back the Clean Power Plan, environmentalists who solar and wind power as the future were preparing for more legal wrangling.
a desperate Dalvin Cook Womens Jersey attempt to prove his innocence, a skilled police negotiator accused of corruption and murder takes hostages a government office to gain the time he needs to find the truth. That’s quite the compliment. Then we heard , whose strong hands gripped more than 500 receptions his career, including arguably the most memorable NFL history, struggles today… The nike nfl jerseys wholesale more you’re around, the more you the NBA game, the more you can nike nfl jerseys wholesale study it, the better you’ll get, Jones said. I’ll give you a blanket ‘yes’ that all those discussions have taken place. advised that he and Tyrique http://www.authenticramssale.com/jamon-brown-jersey-c-2_31.html wrestled to the floor, at which time the defendant jumped on his back and proceeded to strike on the back of his head. Mattingly enjoyed almost instant success the minor leagues, http://www.authenticpackersstores.com/jacob-schum-jersey-c-1_46.html hitting .349 with the Oneonta Yankees of the Class-A New – League 53 1979. I was born Worcester about 50 west of Boston. I think he’s shown he’s certainly capable of playing. It’s getting harder to say that definitely nfl jerseys free shipping move to left tackle next because is playing reasonably well and the combination of and Tunsil Authentic Hines Ward Jersey is paying dividends. Holliday slipped her his cellphone number, and they have been texting ever since – exchanging tips on shaved-head haircuts and swings. Ginobili was integral part of the 2004 Olympic squad that finished ahead of USA and won gold.
When radio tv talking head Fred Roggin, unabashed shill for both the Rams and Chargers, introduced Rams CEO Demoff, he pleaded, Treat this man with respect. calmly avoided the swipe try of after splitting the double cleverly, whipped a perfect no-look pass back and behind himself to the left to open , who had been recklessly abandoned by Earvin. I can’t be saying, ‘ ‘s got a billion dollars his bank account, I want to live like .’ All I can worry about is what’s mine, and how I can take care of family, and have fun with it. Kurkjian I voted for nine players. All the moments, high and low, are well-documented. Not only does play nike nfl jerseys wholesale for himself and his family, he also plays for his deceased brother Karols Acker. For a fresh start, we renamed him . Not only that, but Verlander’s reputation has now been publicly soiled for the rest of his career. Some high school data is courtesy McWater. EPA Estimates Only. It was right there, it was grasps with six minutes left the ballgame and then Bradshaw made two great throws wholesale jerseys and Stallworth went up and made some tremendous plays and they beat us 31. Hey, this is more the FSL box scores basketball jerseys for sale we have known to love over the years!
But not a complete understanding. He is still bummed that Holliday is leaving the Cardinals. what is it like … You wholesale jerseys know, the book I’m reading about you didn’t watch football on TV growing up. nfl jerseys free shipping A gunslinger is embroiled a war with a local drug runner. Tkachuk, who scored the overtime basketball jerseys for sale winner to help the London Knights wholesale jerseys win the Memorial Cup, has spent the taking a out of his father’s workbook. According to Brown, he and his wife, , have other plans that not allow him to continue as mayor next year. Only four teams the league used fewer possessions the post last , per Synergy Sports. He’s running very well.
from WordPress http://www.thornburgrealty.com/2018/06/27/just-remaining-steady-for-straw-rest-of-last-advised/
0 notes
Text
Sentiment Analysis of “A Christmas Carol”
Sentiment Analysis of “A Christmas Carol”
Posted: 29 Nov 2017 03:16 PM PST
(This article was first published on
R – rud.is , and kindly contributed to R-bloggers)
Our family has been reading, listening to and watching “A Christmas Carol” for just abt 30 years now. I got it into my crazy noggin to perform a sentiment analysis on it the other day and tweeted out the results, but a large chunk of the R community is not on Twitter and it would be good to get a holiday-themed post or two up for the season.
One reason I embarked on this endeavour is that @juliasilge & @drob made it so gosh darn easy to do so with:
(btw: That makes an excellent holiday gift for the data scientist[s] in your life.)
Let us begin!

STAVE I: hrbrmstr’s Code
We need the text of this book to work with and thankfully it’s long been in the public domain. As @drob noted, we can use the gutenbergr package to retrieve it. We’ll use an RStudio project structure for this and cache the results locally to avoid burning bandwidth:
library(rprojroot) library(gutenbergr) library(hrbrthemes) library(stringi) library(tidytext) library(tidyverse) rt <- find_rstudio_root_file() carol_rds <- file.path(rt, "data", "carol.rds") if (!file.exists(carol_rds)) { carol_df <- gutenberg_download("46") write_rds(carol_df, carol_rds) } else { carol_df <- read_rds(carol_rds) }
How did I know to use 46? We can use gutenberg_works() to get to that info:
gutenberg_works(author=="Dickens, Charles") ## # A tibble: 74 x 8 ## gutenberg_id title ## ## 1 46 A Christmas Carol in Prose; Being a Ghost Story of Christmas ## 2 98 A Tale of Two Cities ## 3 564 The Mystery of Edwin Drood ## 4 580 The Pickwick Papers ## 5 588 Master Humphrey's Clock ## 6 644 The Haunted Man and the Ghost's Bargain ## 7 650 Pictures from Italy ## 8 653 "The Chimes\r\nA Goblin Story of Some Bells That Rang an Old Year out and a New Year In" ## 9 675 American Notes ## 10 678 The Cricket on the Hearth: A Fairy Tale of Home ## # ... with 64 more rows, and 6 more variables: author , gutenberg_author_id , language , ## # gutenberg_bookshelf , rights , has_text
STAVE II: The first of three wrangles
We’re eventually going to make a ggplot2 faceted chart of the sentiments by paragraphs in each stave (chapter). I wanted nicer titles for the facets so we’ll clean up the stave titles first:
#' Convenience only carol_txt <- carol_df$text # Just want the chapters (staves) carol_txt <- carol_txt[-(1:(which(grepl("STAVE I:", carol_txt)))-1)] #' We'll need this later to make prettier facet titles data_frame( stave = 1:5, title = sprintf("Stave %s: %s", stave, carol_txt[stri_detect_fixed(carol_txt, "STAVE")] %>% stri_replace_first_regex("STAVE [[:alpha:]]{1,3}: ", "") %>% stri_trans_totitle()) ) -> stave_titles
stri_trans_totitle() is a super-handy function and all we’re doing here is extracting the stave titles and doing a small transformation. There are scads of ways to do this, so don’t get stuck on this example. Try out other ways of doing this munging.
You’ll also see that I made sure we started at the first stave break vs include the title bits in the analysis.
Now, we need to prep the text for text analysis.
STAVE III: The second of three wrangles
There are other text mining packages and processes in R. I’m using tidytext because it takes care of so many details for you and does so elegantly. I was also at the rOpenSci Unconf where the idea was spawned & worked on and I’m glad it blossomed into such a great package and a book!
Since we (I) want to do the analysis by stave & paragraph, let’s break the text into those chunks. Note that I’m doing an extra break by sentence in the event folks out there want to replicate this work but do so on a more granular level.
#' Break the text up into chapters, paragraphs, sentences, and words, #' preserving the hierarchy so we can use it later. data_frame(txt = carol_txt) %>% unnest_tokens(chapter, txt, token="regex", pattern="STAVE [[:alpha:]]{1,3}: [[:alpha:] [:punct:]]+") %>% mutate(stave = 1:n()) %>% unnest_tokens(paragraph, chapter, token = "paragraphs") %>% group_by(stave) %>% mutate(para = 1:n()) %>% ungroup() %>% unnest_tokens(sentence, paragraph, token="sentences") %>% group_by(stave, para) %>% mutate(sent = 1:n()) %>% ungroup() %>% unnest_tokens(word, sentence) -> carol_tokens carol_tokens ## A tibble: 28,710 x 4 ## stave para sent word ## ## 1 1 1 1 marley ## 2 1 1 1 was ## 3 1 1 1 dead ## 4 1 1 1 to ## 5 1 1 1 begin ## 6 1 1 1 with ## 7 1 1 1 there ## 8 1 1 1 is ## 9 1 1 1 no ## 0 1 1 1 doubt ## ... with 28,700 more rows
By indexing each hierarchy level, we have the flexibility to do all sorts of structured analyses just by choosing grouping combinations.
STAVE IV: The third of three wrangles
Now, we need to layer in some sentiments and do some basic sentiment calculations. Many of these sentiment-al posts (including this one) take a naive approach with basic match and only looking at 1-grams. One reason I didn’t go further was to make the code accessible to new R folk (since I primarily blog for new R folk :-). I’m prepping some 2018 posts with more involved text analysis themes and will likely add some complexity then with other texts.
#' Retrieve sentiments and compute them. #' #' I left the `index` in vs just use `paragraph` since it'll make this easier to reuse #' this block (which I'm not doing but thought I might). inner_join(carol_tokens, get_sentiments("nrc"), "word") %>% count(stave, index = para, sentiment) %>% spread(sentiment, n, fill = 0) %>% mutate(sentiment = positive - negative) %>% left_join(stave_titles, "stave") -> carol_with_sent
STAVE V: The end of it
Now, we just need to do some really basic ggplot-ing to to get to our desired result:
ggplot(carol_with_sent) + geom_segment(aes(index, sentiment, xend=index, yend=0, color=title), size=0.33) + scale_x_comma(limits=range(carol_with_sent$index)) + scale_y_comma() + scale_color_ipsum() + facet_wrap(~title, scales="free_x", ncol=5) + labs(x=NULL, y="Sentiment", title="Sentiment Analysis of A Christmas Carol", subtitle="By stave & ¶", caption="Humbug!") + theme_ipsum_rc(grid="Y", axis_text_size = 8, strip_text_face = "italic", strip_text_size = 10.5) + theme(legend.position="none")
You’ll want to tap/click on that to make it bigger.
Despite using a naive analysis, I think it tracks pretty well with the flow of the book.
Stave one is quite bleak. Marley is morose and frightening. There is no joy apart from Fred’s brief appearance.
The truly terrible (-10 sentiment) paragraph also makes sense:
Marley’s face. It was not in impenetrable shadow as the other objects in the yard were, but had a dismal light about it, like a bad lobster in a dark cellar. It was not angry or ferocious, but looked at Scrooge as Marley used to look: with ghostly spectacles turned up on its ghostly forehead. The hair was curiously stirred, as if by breath or hot air; and, though the eyes were wide open, they were perfectly motionless. That, and its livid colour, made it horrible; but its horror seemed to be in spite of the face and beyond its control, rather than a part of its own expression.
(I got to that via this snippet which you can use as a template for finding the other significant sentiment points:)
filter( carol_tokens, stave == 1, para == filter(carol_with_sent, stave==1) %>% filter(sentiment == min(sentiment)) %>% pull(index) )
Stave two (Christmas past) is all about Scrooge’s youth and includes details about Fezziwig’s party so the mostly-positive tone also makes sense.
Stave three (Christmas present) has the highest:
The Grocers’! oh, the Grocers’! nearly closed, with perhaps two shutters down, or one; but through those gaps such glimpses! It was not alone that the scales descending on the counter made a merry sound, or that the twine and roller parted company so briskly, or that the canisters were rattled up and down like juggling tricks, or even that the blended scents of tea and coffee were so grateful to the nose, or even that the raisins were so plentiful and rare, the almonds so extremely white, the sticks of cinnamon so long and straight, the other spices so delicious, the candied fruits so caked and spotted with molten sugar as to make the coldest lookers-on feel faint and subsequently bilious. Nor was it that the figs were moist and pulpy, or that the French plums blushed in modest tartness from their highly-decorated boxes, or that everything was good to eat and in its Christmas dress; but the customers were all so hurried and so eager in the hopeful promise of the day, that they tumbled up against each other at the door, crashing their wicker baskets wildly, and left their purchases upon the counter, and came running back to fetch them, and committed hundreds of the like mistakes, in the best humour possible; while the Grocer and his people were so frank and fresh that the polished hearts with which they fastened their aprons behind might have been their own, worn outside for general inspection, and for Christmas daws to peck at if they chose.
and lowest (sentiment) points of the entire book:
And now, without a word of warning from the Ghost, they stood upon a bleak and desert moor, where monstrous masses of rude stone were cast about, as though it were the burial-place of giants; and water spread itself wheresoever it listed, or would have done so, but for the frost that held it prisoner; and nothing grew but moss and furze, and coarse rank grass. Down in the west the setting sun had left a streak of fiery red, which glared upon the desolation for an instant, like a sullen eye, and frowning lower, lower, lower yet, was lost in the thick gloom of darkest night.
Stave four (Christmas yet to come) is fairly middling. I had expected to see lower marks here. The standout negative sentiment paragraph (and the one that follows) are pretty dark, though:
They left the busy scene, and went into an obscure part of the town, where Scrooge had never penetrated before, although he recognised its situation, and its bad repute. The ways were foul and narrow; the shops and houses wretched; the people half-naked, drunken, slipshod, ugly. Alleys and archways, like so many cesspools, disgorged their offences of smell, and dirt, and life, upon the straggling streets; and the whole quarter reeked with crime, with filth, and misery.
Finally, Stave five is both short and positive (whew!). Which I heartily agree with!
FIN
The code is up on GitHub and I hope that it will inspire more folks to experiment with this fun (& useful!) aspect of data science.
Make sure to send links to anything you create and shoot over PRs for anything you think I did that was awry.
For those who celebrate Christmas, I hope you keep Christmas as well as or even better than old Scrooge. “May that be truly said of us, and all of us! And so, as Tiny Tim observed, God bless Us, Every One!”
0 notes
Text
Data Insights Case Study Part 0 - Question & Setup

So I decided to see just how much insight you can glean from “data in the wild”. You know, data that hasn’t been cleaned (or cleaned enough) and no textbook is ever going to use that to teach folks about algorithms using such data because it’s going to take a couple years at the rate the data needs to be cleaned and transformed first. This is going to be a multi-part post on getting insight in such a real-world case. It’s going to be hard and annoying.
But you always start with a question first. The question I had from a friend was, “does better/more education for girls and young women lead to better economic performance for a given country”? This is a good question, and our intuitive answer is “yes”. But the question then becomes, how, and how much?
To answer that question...well you need data, and hopefully a lot of it. This is where Kaggle comes in. Specifically, this data set on World Development Indicators. While it isn’t by any means the biggest data set ever, it is quite huge compared to classroom data sets used to teach you data science or machine learning.
And because it’s real data, it doesn’t behave like you’d expect or want it to. More on that later. But first, given it’s (at the time of writing) 350+ MB worth of data, how do you even decide where to start?
To me, it’s a bit of an iterative cycle. You start with a hypothesis (more education for girls -> better economic performance) and try to identify likely variables that may help answer this question. There’s always caveats like cause and effect vs correlation, overfitting, etc. etc., but to me, always start simple by looking at things and making a list of variables you think may help you down the road. And then you can worry about the caveats later.

But first:
1. This is a huge file (see a snapshot of indicators.csv above) for local processing (say, a Macbook Air). Excel ain’t gonna cut it. You’ll need to load this into a relational database. I chose Postgresql but really, for something like this you can choose whatever else you like, such as MySQL or Oracle...
2. Once you’ve setup the relational DB, the next step is to create the tables to load both the raw data (indicators.csv) and the metadata (country.csv). Just run “head indicators.csv” at the terminal to take a look at the names of the headers and first few rows of data, to get a sense of how the tables should be set up. Then run something similar to the command below to load the data into the pre-created tables:
copy indicators_raw FROM '/path/to/file/Indicators.csv' delimiter ',' CSV;
3. Check to make sure the data wasn’t loaded improperly or somehow corrupted (unlikely to happen but you don’t want to try data analysis on something that was wrong in the first place). Maybe do a simple count(*) or just spot check here and there.
4. Start writing Python scripts to help you manage the data exploration and wrangling. More on this in the next post, but a preview of where this is going is the following function, which is just a helper function to load and normalize data:

0 notes