#DataFlow Report
Explore tagged Tumblr posts
Visit Tumblr Blog
Explore Tumblr blogs with no restrictions, modern design and the best experience.
Last Seen Tumblr Blogs


Fun Fact
The most popular pages on Tumblr are about Minecraft, GIFs, and David J. Peterson.
Text

The MOH DataFlow process is a crucial step in the healthcare licensing process for various countries (such as the UAE, Saudi Arabia, Oman, etc.) that require medical professionals to undergo credential verification before being allowed to practice in the country. DataFlow is an independent verification service used by Ministries of Health (MOH) to authenticate and validate the professional qualifications and work history of healthcare professionals.
#MOH DataFlow#DataFlow Verification#Primary Source Verification#DataFlow Report#Healthcare Credential Verification#MOH Licensing#MOH Exam Process#DataFlow UAE#MOH Credential Verification
0 notes
Note
Hi! Saw your Data flow posts, and just asking to check if I've understood correctly: is the issue here (I'm some of the examples you mentioned about a project not working because they had discounted something, for instance) what's succinctly represented in the xkcd Dependency?
https://xkcd.com/2347/
Just so folk don't have to follow the link - here is the xkcd
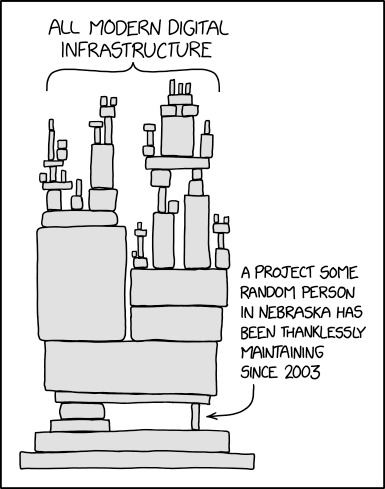
So this is a great example of a dependency, something that's vital to a single or multiple other processes or assets.
'Impact Analysis' is something that organisations need to do either to preempt something going wrong in order to build contingencies OR something that organisations need to be able to understand *when* something goes wrong.
But while the comic above is focused on modern digital infrastructure (which in the context I refer to Dataflow is more focused on Routers and Switches), it's worth noting that dependencies across organisations are a lot broader than that.
For example:
Person A needs to provide a report to person B so person B can do their job - That is a dependency
Person A needs to use App 1 to write the report but is dependent on the data from App 2 to actually write the report - That is also a dependency
Person A needs to use 'Laptop FW131' but spilled coffee over it at lunch and now it won't turn on - That is a dependency
Person A has found a back-up laptop 'Laptop FW132' but office WiFi is down because the finance department haven't paid the internet provider - Also a dependency
Seeing those examples, you might say, "But in that case, literally anything could be a dependency? What if Person A gets hit by a bus? What if the Laptop explodes and burns the building down?"
And yeah, that's absolutely the case. But if you do not understand the connections and dependencies between People, Business Processes and Technology Assets then you won't be able to ask the question in the first place. Which in an increasingly complex digital world is becoming much more important!
Hope that helps, any questions on the back of that please don't hesitate to ask because I live for this stuff.
197 notes
·
View notes
Text
Integrating Microsoft Fabric After Tableau Migration: Next-Level Analytics
Migrating from Tableau to Power BI is just the beginning of an advanced analytics journey. Once your data ecosystem shifts to Microsoft's environment, leveraging Microsoft Fabric can push your business intelligence to the next level. This unified platform empowers teams to build powerful, scalable, and collaborative data experiences that go beyond traditional dashboards.
What is Microsoft Fabric?
Microsoft Fabric is an all-in-one analytics solution that unites data engineering, data integration, data science, real-time analytics, and business intelligence under one unified SaaS umbrella. It’s tightly integrated with Power BI, enabling seamless analytics workflows. Post-migration, Fabric acts as the glue that connects your newly transformed Power BI environment with the broader data infrastructure.
Why Use Microsoft Fabric After Tableau Migration?
When organizations migrate from Tableau to Power BI, they often do so to gain access to deeper integration with Microsoft’s ecosystem. Microsoft Fabric amplifies this advantage by:
Eliminating Data Silos: Fabric allows your teams to ingest, transform, and store data in a single environment using OneLake, a unified data lake that ensures consistency and accessibility.
Accelerating Time to Insight: With capabilities like real-time data flows, lakehouses, and semantic models, analysts and decision-makers can generate insights faster than ever before.
Enhancing Collaboration: Shared workspaces in Fabric allow teams to co-author data models, reports, and pipelines — all while maintaining governance and security.
Key Integration Benefits
1. Unified Data Layer with OneLake Microsoft Fabric introduces OneLake, a single logical data lake built for all workloads. Unlike Tableau, which typically required third-party data lakes or external connectors, Fabric brings everything into a unified space — making storage, querying, and access more seamless after migration.
2. End-to-End Data Pipelines With built-in Data Factory capabilities, users can automate ingestion from multiple sources, transform it using Spark or SQL, and deliver clean data directly to Power BI datasets. This eliminates the need for maintaining separate ETL tools post-migration.
3. AI-Powered Analytics with Copilot After moving to Power BI, organizations can use Copilot in Microsoft Fabric to generate DAX formulas, write code, or even build reports using natural language prompts. This is a huge leap forward from Tableau’s more manual development environment.
4. Real-Time Analytics for Business Agility Microsoft Fabric’s Real-Time Analytics feature allows users to analyze event-driven data — ideal for finance, operations, or customer service teams who need immediate insights from streaming sources.
Strategic Approach to Integration
To fully harness Microsoft Fabric after Tableau migration:
Start with Data Modeling: Review and optimize your Power BI data models to work efficiently within Fabric’s lakehouse or warehouse environment.
Automate Pipelines: Rebuild any Tableau Prep workflows using Fabric’s Dataflow Gen2 or Data Factory pipelines.
Train Teams: Enable your analysts and developers with Fabric-specific training to maximize adoption.
Governance First: Set up data lineage tracking, access controls, and workspaces early to ensure scalability and compliance.
Final Thoughts
The move from Tableau to Power BI sets the foundation — but integrating Microsoft Fabric is what truly unlocks the future of enterprise analytics. With a seamless environment for data storage, modeling, automation, and visualization, Microsoft Fabric empowers organizations to be data-driven at scale.
Ready to elevate your analytics journey? Learn more at 👉 https://tableautopowerbimigration.com/
0 notes
Text
Sensitivity Labels in Power BI: Protecting Confidential Data – Implementing Data Classification and Protection within Power BI Reports
In today’s data-driven landscape, organisations rely on BI tools to transform raw data into business insights. However, with great power comes great responsibility—especially when dealing with sensitive or confidential data. That’s where sensitivity labels in Power BI come into play. These labels help organisations classify and protect data within reports, dashboards, and datasets, ensuring compliance with data governance policies and regulatory standards.
Whether you’re a business owner, data analyst, or someone considering a data analyst course in pune, understanding how sensitivity labels work can be a game-changer in handling and safeguarding valuable information.
What Are Sensitivity Labels?
Sensitivity labels are a feature of Microsoft Information Protection (MIP) integrated into Power BI. They allow users to tag reports, datasets, dashboards, and dataflows based on the level of sensitivity of the content. Examples of label categories include Confidential, Highly Confidential, Internal, and Public.
These labels do more than just mark data—they enforce protection settings such as encryption, access restrictions, and usage tracking. Once applied, they travel with the data analyst course across Microsoft 365 services, ensuring consistent protection regardless of where the content goes.
Why Sensitivity Labels Matter in Power BI
Organisations today manage vast volumes of data, including personal customer details, financial records, and strategic business insights. Inadvertent exposure of such information could lead to regulatory fines, legal complications, or reputational damage.
Here's where sensitivity labels make a real difference:
Risk Mitigation: They reduce the risk of unauthorised access or data leaks by embedding security into the data itself.
Compliance Support: Help companies adhere to regulations like GDPR, HIPAA, and CCPA.
Consistency Across Platforms: Labels applied in Power BI extend across other Microsoft applications, ensuring end-to-end protection.
By implementing sensitivity labels, businesses align with best practices in data governance and cybersecurity.
How to Apply Sensitivity Labels in Power BI
Applying sensitivity labels in Power BI is straightforward but requires configuration within Microsoft Purview (formerly Microsoft Information Protection). Here’s a simplified process:
Define Labels in Microsoft Purview: Admins create a taxonomy of sensitivity labels suitable for the organisation’s data governance policies.
Publish Labels to Power BI: These labels are made available in Power BI for users to apply to their content.
Apply Labels to Content: Users with appropriate permissions can assign a label to reports, dashboards, datasets, and dataflows.
Enforce Protection Settings: Based on the label, Power BI automatically applies the designated protection policies like encryption or read-only access.
While Power BI users don't need to be security experts, they do need awareness of when and how to use labels, making this knowledge crucial in both professional environments and in educational settings.
Benefits of Sensitivity Labels in Business Environments
Sensitivity labels offer several practical benefits that contribute to a more secure and streamlined business intelligence environment:
Enhanced Collaboration with Security: Teams can share reports with colleagues and stakeholders while ensuring that sensitive data remains protected.
Audit and Monitoring: Administrators can track how labelled content is accessed or shared, enabling better oversight and accountability.
Automated Protection: Labels automate the application of protection settings, minimising manual errors and inconsistencies.
Implementing these labels not only strengthens data security but also fosters a culture of accountability and awareness within an organization.
Best Practices for Implementing Sensitivity Labels
To make the most out of sensitivity labels in Power BI, consider the following best practices:
Educate Your Team: Ensure all members understand the labelling framework and its importance. This could be incorporated into onboarding or regular training sessions.
Start with a Clear Labelling Taxonomy: Keep label categories clear and concise. Too many options can overwhelm users and reduce adoption.
Regularly Review and Update Labels: As your organisation evolves, so should your data classification strategy.
Integrate with Broader Data Governance Policies: Sensitivity labelling should align with your overall security and compliance frameworks.
A Growing Need for Data Protection Skills
As the digital world grows more complex, the need for professionals skilled in data classification and governance is also rising. Understanding tools like Power BI and sensitivity labels is becoming essential in many analytical roles. For those looking to build a career in data analysis, upskilling programs often cover practical and strategic aspects of business intelligence, including data protection methods.
Conclusion
Sensitivity labels in Power BI offer a powerful way to safeguard confidential data through classification and protection. They help businesses comply with regulations, protect sensitive information, and maintain control over data sharing—all within a user-friendly environment.
By implementing sensitivity labels effectively, organisations can ensure that data remains protected without hampering collaboration and productivity. And for aspiring analysts or professionals enhancing their skillsets, learning how to use these features is a valuable addition to their toolkit.
In a world where data is both an asset and a liability, making security an integral part of your business intelligence strategy is not just smart—it’s essential.
0 notes
Text

🔄 Mastering Dataflows (Gen2): Transform Like a Pro
Q: What are some common data transformations in Dataflows Gen2?
✅ A: Here are some of the most used transformations:
🔹 Filter and Sort rows
🔹 Pivot and Unpivot
🔹 Merge and Append queries
🔹 Split and Conditional Split
🔹 Replace values and Remove duplicates
🔹 Add, Rename, Reorder, or Delete columns
🔹 Rank and Percentage calculators
🔹 Top N and Bottom N selections
🧠 These transformations help clean, shape, and enrich your data—making your downstream reporting more effective and insightful.
💬 Which transformation do you use the most in your projects?
Drop your favorite (or most underrated) one in the comments!
#DataPlatform #LowCodeTools
#MicrosoftFabric#DataflowsGen2#PowerBI#DataTransformation#ETL#DataEngineering#FabricCommunity#DataPreparation#DataCleaning#OneLake
0 notes
Text
The top Data Engineering trends to look for in 2025

Data engineering is the unsung hero of our data-driven world. It's the critical discipline that builds and maintains the robust infrastructure enabling organizations to collect, store, process, and analyze vast amounts of data. As we navigate mid-2025, this foundational field is evolving at an unprecedented pace, driven by the exponential growth of data, the insatiable demand for real-time insights, and the transformative power of AI.
Staying ahead of these shifts is no longer optional; it's essential for data engineers and the organizations they support. Let's dive into the key data engineering trends that are defining the landscape in 2025.
1. The Dominance of the Data Lakehouse
What it is: The data lakehouse architecture continues its strong upward trajectory, aiming to unify the best features of data lakes (flexible, low-cost storage for raw, diverse data types) and data warehouses (structured data management, ACID transactions, and robust governance). Why it's significant: It offers a single platform for various analytics workloads, from BI and reporting to AI and machine learning, reducing data silos, complexity, and redundancy. Open table formats like Apache Iceberg, Delta Lake, and Hudi are pivotal in enabling lakehouse capabilities. Impact: Greater data accessibility, improved data quality and reliability for analytics, simplified data architecture, and cost efficiencies. Key Technologies: Databricks, Snowflake, Amazon S3, Azure Data Lake Storage, Apache Spark, and open table formats.
2. AI-Powered Data Engineering (Including Generative AI)
What it is: Artificial intelligence, and increasingly Generative AI, are becoming integral to data engineering itself. This involves using AI/ML to automate and optimize various data engineering tasks. Why it's significant: AI can significantly boost efficiency, reduce manual effort, improve data quality, and even help generate code for data pipelines or transformations. Impact: * Automated Data Integration & Transformation: AI tools can now automate aspects of data mapping, cleansing, and pipeline optimization. * Intelligent Data Quality & Anomaly Detection: ML algorithms can proactively identify and flag data quality issues or anomalies in pipelines. * Optimized Pipeline Performance: AI can help in tuning and optimizing the performance of data workflows. * Generative AI for Code & Documentation: LLMs are being used to assist in writing SQL queries, Python scripts for ETL, and auto-generating documentation. Key Technologies: AI-driven ETL/ELT tools, MLOps frameworks integrated with DataOps, platforms with built-in AI capabilities (e.g., Databricks AI Functions, AWS DMS with GenAI).
3. Real-Time Data Processing & Streaming Analytics as the Norm
What it is: The demand for immediate insights and actions based on live data streams continues to grow. Batch processing is no longer sufficient for many use cases. Why it's significant: Businesses across industries like e-commerce, finance, IoT, and logistics require real-time capabilities for fraud detection, personalized recommendations, operational monitoring, and instant decision-making. Impact: A shift towards streaming architectures, event-driven data pipelines, and tools that can handle high-throughput, low-latency data. Key Technologies: Apache Kafka, Apache Flink, Apache Spark Streaming, Apache Pulsar, cloud-native streaming services (e.g., Amazon Kinesis, Google Cloud Dataflow, Azure Stream Analytics), and real-time analytical databases.
4. The Rise of Data Mesh & Data Fabric Architectures
What it is: * Data Mesh: A decentralized sociotechnical approach that emphasizes domain-oriented data ownership, treating data as a product, self-serve data infrastructure, and federated computational governance. * Data Fabric: An architectural approach that automates data integration and delivery across disparate data sources, often using metadata and AI to provide a unified view and access to data regardless of where it resides. Why it's significant: Traditional centralized data architectures struggle with the scale and complexity of modern data. These approaches offer greater agility, scalability, and empower domain teams. Impact: Improved data accessibility and discoverability, faster time-to-insight for domain teams, reduced bottlenecks for central data teams, and better alignment of data with business domains. Key Technologies: Data catalogs, data virtualization tools, API-based data access, and platforms supporting decentralized data management.
5. Enhanced Focus on Data Observability & Governance
What it is: * Data Observability: Going beyond traditional monitoring to provide deep visibility into the health and state of data and data pipelines. It involves tracking data lineage, quality, freshness, schema changes, and distribution. * Data Governance by Design: Integrating robust data governance, security, and compliance practices directly into the data lifecycle and infrastructure from the outset, rather than as an afterthought. Why it's significant: As data volumes and complexity grow, ensuring data quality, reliability, and compliance (e.g., GDPR, CCPA) becomes paramount for building trust and making sound decisions. Regulatory landscapes, like the EU AI Act, are also making strong governance non-negotiable. Impact: Improved data trust and reliability, faster incident resolution, better compliance, and more secure data handling. Key Technologies: AI-powered data observability platforms, data cataloging tools with governance features, automated data quality frameworks, and tools supporting data lineage.
6. Maturation of DataOps and MLOps Practices
What it is: * DataOps: Applying Agile and DevOps principles (automation, collaboration, continuous integration/continuous delivery - CI/CD) to the entire data analytics lifecycle, from data ingestion to insight delivery. * MLOps: Extending DevOps principles specifically to the machine learning lifecycle, focusing on streamlining model development, deployment, monitoring, and retraining. Why it's significant: These practices are crucial for improving the speed, quality, reliability, and efficiency of data and machine learning pipelines. Impact: Faster delivery of data products and ML models, improved data quality, enhanced collaboration between data engineers, data scientists, and IT operations, and more reliable production systems. Key Technologies: Workflow orchestration tools (e.g., Apache Airflow, Kestra), CI/CD tools (e.g., Jenkins, GitLab CI), version control systems (Git), containerization (Docker, Kubernetes), and MLOps platforms (e.g., MLflow, Kubeflow, SageMaker, Azure ML).
The Cross-Cutting Theme: Cloud-Native and Cost Optimization
Underpinning many of these trends is the continued dominance of cloud-native data engineering. Cloud platforms (AWS, Azure, GCP) provide the scalable, flexible, and managed services that are essential for modern data infrastructure. Coupled with this is an increasing focus on cloud cost optimization (FinOps for data), as organizations strive to manage and reduce the expenses associated with large-scale data processing and storage in the cloud.
The Evolving Role of the Data Engineer
These trends are reshaping the role of the data engineer. Beyond building pipelines, data engineers in 2025 are increasingly becoming architects of more intelligent, automated, and governed data systems. Skills in AI/ML, cloud platforms, real-time processing, and distributed architectures are becoming even more crucial.
Global Relevance, Local Impact
These global data engineering trends are particularly critical for rapidly developing digital economies. In countries like India, where the data explosion is immense and the drive for digital transformation is strong, adopting these advanced data engineering practices is key to harnessing data for innovation, improving operational efficiency, and building competitive advantages on a global scale.
Conclusion: Building the Future, One Pipeline at a Time
The field of data engineering is more dynamic and critical than ever. The trends of 2025 point towards more automated, real-time, governed, and AI-augmented data infrastructures. For data engineering professionals and the organizations they serve, embracing these changes means not just keeping pace, but actively shaping the future of how data powers our world.
1 note
·
View note
Text
Connected Device Analytics Market Evolution, Emerging Trends, and Forecast 2032
TheConnected Device Analytics Market Size was valued at USD 26.94 Billion in 2023 and is expected to reach USD 173.96 Billion by 2032 and grow at a CAGR of 23.0% over the forecast period 2024-2032
The Connected Device Analytics Market is experiencing rapid expansion as businesses and industries increasingly rely on IoT-driven data insights. With billions of connected devices generating vast amounts of real-time data, organizations are leveraging analytics to enhance efficiency, improve decision-making, and drive innovation. Growing demand for predictive analytics, AI-driven insights, and real-time monitoring is propelling this market forward.
The Connected Device Analytics Market continues to evolve as industries such as healthcare, manufacturing, retail, and smart cities integrate IoT devices into their operations. The ability to process, analyze, and derive actionable insights from connected devices is revolutionizing business models. As digital transformation accelerates, the demand for sophisticated analytics solutions that provide enhanced security, automation, and data-driven intelligence is expected to surge.
Get Sample Copy of This Report: https://www.snsinsider.com/sample-request/3727
Market Keyplayers:
Microsoft (US) (Azure IoT, Power BI)
Oracle Corporation (US) (Oracle IoT Cloud, Oracle Analytics Cloud)
IBM Corporation (US) (IBM Watson IoT, IBM Cognos Analytics)
SAP SE (Germany) (SAP Leonardo IoT, SAP Analytics Cloud)
PTC (US) (ThingWorx, Kepware)
Cisco (US) (Cisco Kinetic, Cisco Jasper)
Google (US) (Google Cloud IoT Core, Google BigQuery)
SAS Institute (US) (SAS IoT Analytics, SAS Visual Analytics)
Adobe (US) (Adobe Analytics, Adobe Sensei)
Teradata (US) (Teradata Vantage, Teradata IoT Analytics)
AWS (US) (AWS IoT Analytics, Amazon QuickSight)
HPE (US) (HPE Edgeline, HPE Vertica)
Hitachi (Japan) (Hitachi Lumada, Pentaho)
Software AG (Germany) (Cumulocity IoT, TrendMiner)
GE (US) (GE Digital Predix, GE APM (Asset Performance Management))
Cloudera (US) (Cloudera DataFlow, Cloudera Machine Learning)
Guavus (US) (Guavus AI-based Analytics, Guavus Reflex)
Splunk (US) (Splunk Industrial IoT, Splunk Enterprise)
TIBCO Software (US) (TIBCO Spotfire, TIBCO Streaming)
Qlik (US) (Qlik Sense, Qlik Data Integration)
Salesforce (US) (Salesforce IoT Cloud, Tableau)
Infor (US) (Infor IoT, Infor Birst)
Mnubo (Canada) (Mnubo SmartObjects, Mnubo Data Science Studio)
Arundo Analytics (US) (Arundo Edge, Arundo Analytics Platform)
Key Trends Driving Market Growth
1. Rise of Edge Computing and AI-Driven Analytics
With the increasing number of IoT devices, edge computing has emerged as a crucial trend. Organizations are leveraging AI-driven analytics at the edge to process data closer to the source, reducing latency and enhancing real-time decision-making. This approach enables faster responses in critical applications such as healthcare, autonomous vehicles, and industrial automation.
2. Expansion of Predictive and Prescriptive Analytics
Businesses are shifting from traditional descriptive analytics to predictive and prescriptive analytics to anticipate trends and optimize operations. Connected devices equipped with advanced analytics capabilities can forecast equipment failures, monitor energy usage, and improve supply chain efficiency, significantly reducing operational costs.
3. Growing Adoption of 5G Connectivity
The rollout of 5G networks is significantly enhancing the capabilities of connected devices. With ultra-low latency and high-speed data transfer, 5G enables seamless real-time analytics, making applications like smart cities, autonomous vehicles, and remote healthcare monitoring more efficient and reliable.
4. Increasing Focus on Cybersecurity and Data Privacy
As connected devices collect vast amounts of sensitive data, cybersecurity and data privacy have become critical concerns. Organizations are investing in advanced encryption, AI-powered threat detection, and blockchain technology to ensure data integrity and compliance with global security regulations such as GDPR and CCPA.
5. Integration of IoT with Cloud and Hybrid Analytics
Many enterprises are adopting cloud-based and hybrid analytics models to handle massive datasets generated by connected devices. Cloud platforms enable scalability, while hybrid approaches offer a balance between security and efficiency, ensuring businesses can analyze IoT data in real-time while maintaining control over sensitive information.
Enquiry of This Report: https://www.snsinsider.com/enquiry/3727
Market Segmentation:
By Component
Solution
Service
By Application
Sales and Customer Management
Security & Emergency Management
Remote Monitoring
Predictive Maintenance Asset Management
Inventory Management
Energy Management
Building Automation
Others
By Organization Size
Large Enterprise
Small and Medium Size Enterprise
By Deployment Mode
On-premises
Cloud
Market Analysis and Current Landscape
Surging IoT Adoption: The number of IoT-connected devices is projected to exceed 30 billion by 2030, generating massive amounts of analyzable data.
Rising Need for Operational Efficiency: Companies are leveraging analytics to optimize processes, reduce downtime, and enhance predictive maintenance.
Government and Industry Regulations: Compliance with data security standards and regulations is prompting businesses to adopt robust analytics solutions to manage and secure IoT-generated data.
Competitive Industry Landscape: Tech giants such as Microsoft, IBM, Google, AWS, and SAP are investing in advanced connected device analytics platforms, intensifying market competition.
Despite these promising trends, challenges such as data silos, interoperability issues, and the high cost of analytics implementation remain barriers to widespread adoption. However, as technology advances, businesses are finding scalable and cost-effective solutions to overcome these obstacles.
Future Prospects: What Lies Ahead?
1. Evolution of AI-Powered Autonomous Systems
The next phase of connected device analytics will witness the rise of AI-powered autonomous systems capable of making real-time decisions without human intervention. These systems will be widely used in smart factories, healthcare, transportation, and logistics, driving unprecedented efficiency.
2. Growth of Digital Twins Technology
Digital twins, virtual replicas of physical assets, are becoming mainstream in industries such as manufacturing, construction, and energy. These AI-driven models use connected device analytics to simulate scenarios, predict failures, and optimize asset performance in real time.
3. Blockchain for Secure Data Transactions
Blockchain technology will play a crucial role in securing IoT transactions by ensuring transparency, immutability, and authentication. This will be particularly beneficial for industries dealing with sensitive data, such as financial services, healthcare, and supply chain management.
4. Expansion into Smart Homes and Consumer Electronics
As IoT adoption grows in the consumer segment, smart home devices, wearables, and connected appliances will rely on analytics to improve user experiences. AI-powered assistants, personalized recommendations, and home automation solutions will redefine how consumers interact with their devices.
5. Industry-Specific Analytics Solutions
Companies are increasingly demanding industry-tailored analytics solutions that cater to their specific operational needs. Custom-built analytics platforms for automotive, energy, retail, and telecom sectors will drive deeper market penetration and growth.
Access Complete Report: https://www.snsinsider.com/reports/connected-device-analytics-market-3727
Conclusion
The Connected Device Analytics Market is set for significant expansion, driven by technological innovations, increasing IoT adoption, and the rising demand for real-time data insights. As industries embrace AI, edge computing, and predictive analytics, businesses that invest in advanced analytics solutions will gain a competitive edge. The future of this market will be shaped by the seamless integration of cloud, AI, and cybersecurity measures, ensuring connected devices operate efficiently and securely. With continued advancements, connected device analytics will not only enhance business operations but also transform how industries leverage data for smarter decision-making and automation.
About Us:
SNS Insider is one of the leading market research and consulting agencies that dominates the market research industry globally. Our company's aim is to give clients the knowledge they require in order to function in changing circumstances. In order to give you current, accurate market data, consumer insights, and opinions so that you can make decisions with confidence, we employ a variety of techniques, including surveys, video talks, and focus groups around the world.
Contact Us:
Jagney Dave - Vice President of Client Engagement
Phone: +1-315 636 4242 (US) | +44- 20 3290 5010 (UK)
#Connected Device Analytics Market#Connected Device Analytics Market Analysis#Connected Device Analytics Market Scope#Connected Device Analytics Market Growth#Connected Device Analytics Market Trends
0 notes
Text
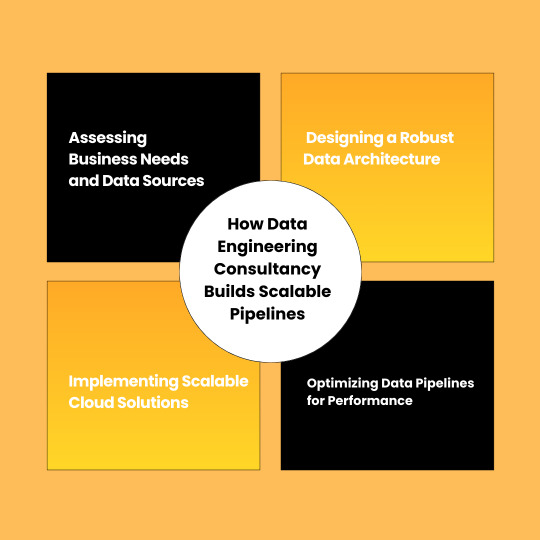
How Data Engineering Consultancy Builds Scalable Pipelines
To drive your business growth and make informed decision making, data integration, transformation, and its analysis is very crucial. How well you collect, transfer, analyze and utilize your data impacts your business or organization’s success. So, it becomes essential to partner with a professional data engineering consultancy to ensure your important data is managed effectively using scalable data pipelines.
What are these scalable data pipelines? How does a Data Engineering Consultancy build them? The role of Google Analytics consulting? Let’s discuss all these concerns in this blog.
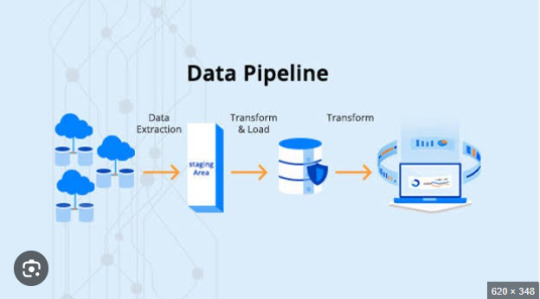
What are Scalable Data Pipelines?
Scalable data pipelines are the best approach used for moving and processing data from various sources to analytical platforms. This approach increases data volume and complexity while the performance remains consistent. Data Engineering Consultancy designs these data pipelines that handle massive data sets which is also known as the backbone of modern data infrastructure.
Key Components of a Scalable Data Pipeline
The various key components of a scalable data pipelines are:
Data Ingestion – Collect data from multiple sources. These sources are APIs, cloud services, databases and third-party applications.
Data Processing – Clean, transform, and structure raw data for analysis. These tools are Apache Spark, Airflow, and cloud-based services.
Storage & Management – Store and manage data in scalable cloud-based solutions. These solutions are Google BigQuery, Snowflake, and Amazon S3.
Automation & Monitoring – Implement automated workflows and monitor systems to ensure smooth operations and detect potential issues.
These are the various key components of scalable data pipelines that are used by Data Engineering Consultancy. These data pipelines ensure businesses manage their data efficiently, allow faster insights, and improved decision-making.
How Data Engineering Consultancy Builds Scalable Pipelines
Data Engineering Consultancy builds scalable pipelines in step by step process, let’s explore these steps.
1. Assessing Business Needs and Data Sources
Step 1 is accessing your business needs and data sources. We start by understanding your data requirements and specific business objectives. Our expert team determines the best approach for data integration by analyzing data sources such as website analytics tools, third-party applications, and CRM platforms.
2. Designing a Robust Data Architecture
Step 2 is designing a robust data plan. Our expert consultants create a customized data plan based on your business needs. We choose the most suitable technologies and frameworks by considering various factors such as velocity, variety, and data volume.
3. Implementing Scalable Cloud Solutions
Step 3 is implementing scalable cloud based solutions. We implement solutions like Azure, AWS, and Google Cloud to ensure efficiency and cost-effectiveness. Also, these platforms provide flexibility of scale storage and computing resources based on real-time demand.
4. Optimizing Data Pipelines for Performance
Step 4 is optimizing data pipelines for performance. Our Data Engineering Consultancy optimizes data pipelines by automating workflows and reducing latency. Your business can achieve near-instant data streaming and processing capabilities by integrating tools like Apache Kafka and Google Dataflow.
5. Google Analytics Consulting for Data Optimization
Google Analytics consulting plays an important role for data optimization as it understands the user behaviors and website performance.. With our Google Analytics consulting your businesses can get actionable insights by -
Setting up advanced tracking mechanisms.
Integrating Google Analytics data with other business intelligence tools.
Enhancing reporting and visualization for better decision-making.
Data Engineering Consultancy - What Are Their Benefits?
Data engineering consultancy offers various benefits,let's explore them.
Improve Data Quality and Reliability
Enhance Decision-Making
Cost and Time Efficiency
Future-Proof Infrastructure
With Data engineering consultancy, you can get access to improved data quality and reliability. This helps you to get accurate data with no errors.
You can enhance your informed decision-making using real-time and historical insights.This helps businesses to make informed decisions.
Data Engineering consultancy reduces manual data handling and operational costs as it provides cost and time efficiency.
Data Engineering consultancy provides future proof infrastructure. Businesses can scale their data operations seamlessly by using latest and exceptional technologies.
Conclusion: Boost Business With Expert & Top-Notch Data Engineering Solutions
Let’s boost business growth with exceptional and top-notch data engineering solutions. We at Kaliper help businesses to get the full potential of their valuable data to make sustainable growth of their business. Our expert and skilled team can assist you to thrive your business performance by extracting maximum value from your data assets. We can help you to gain valuable insights about your user behavior. To make informed decisions, and get tangible results with our top-notch and innovative Google Analytics solutions.
Kaliper ensures your data works smarter for you by integrating with data engineering consultancy. We help you to thrive your business with our exceptional data engineering solutions. Schedule a consultation with Kaliper today and let our professional and expert team guide you toward your business growth and success.
0 notes
Text
What are the Career Opportunities After Earning the GCP Architect Certification?
GCP Professional Architect Certification is a globally recognized badge of honor. The certification demonstrates the ability to design, build, and manage secure, scalable, and reliable GCP (Google Cloud Platform) solutions. As the IT world has shifted to the cloud computing side of things, GCP Architect certification holders are in demand. It can open a variety of job venues in diverse areas of study.
Cloud Architect
It is the job of a GCP Professional Cloud Architect to come up with cloud infrastructure options that meet the needs of businesses. Cloud architects help companies make sure that their cloud operations are fast, safe, and cost-effective. As more companies use Google Cloud, certified workers can get well-paying jobs in companies all over the world.
Cloud Consultant
Businesses making the shift to cloud solutions need professional consultants to guide them with cloud migration and digitalization. The Google Professional Architect certification prepares you to analyze client needs and design solutions that make a seamless cloud transition.
DevOps Engineer
DevOps engineers integrate Cloud automation tools, CI/CD pipelines, and infrastructure as code (IaC) to streamline software development and deployment, making them suitable for Google Cloud Architect Certified professionals. Strong DevOps technologies offered by GCP (Cloud Build, Cloud Run) make certified professionals strong candidates for organizations.
Cloud Solutions Engineer
Cloud Solutions Engineer is a position ideal for a Google Cloud Professional, who is skilled at cloud application designing and optimization. They support developers in making infrastructure and cloud services seamlessly.
A Site Reliability Engineer (SRE)
SREs manage the reliability, scalability, and efficiency of systems. Google Professional Cloud Architect is the major responsibility of building fault-tolerant architectures, and improving cloud performance, and making sure operations run smoothly in high-traffic settings.
Data Engineer
While GCP emphasizes data processing and analysis more, you can focus on data engineering with GCP Architect Certification. They use Google BigQuery, Cloud Spanner, and Dataflow to handle large-scale data pipelines. This facilitates better decision-making for data-driven organizations.
Security Engineer
Safe cloud architecture is essential, and certified architects know how to do that. For example, there is the Google Certified Professional Cloud Architect, who specializes in the realm of cloud security, ensuring that compliance requirements, identity management, and risk mitigation all stay covered in cloud environments.
GCP Architect Salary and Demand
The salary of a GCP Cloud Architect can be as low as $140,000 and as high as $180,000, according to industry reports, but the range depends on their expertise and employer. It is a good job option, as companies such as Google, Amazon, Deloitte, Accenture, and IBM are hiring in numbers with GCP Architect Certification.
Industries That are Hiring Google Cloud Architects
Technology & IT Services – Companies like Google, Microsoft, and IBM are constantly looking for GCP-certified architects for cloud infrastructure initiatives.
Finance & Banking – Google Professional Cloud Architects are also in demand for fintech businesses and banks, requiring secure and scalable cloud solutions.
Healthcare – Google Cloud Architect Certification training programs have made the role of holders in the healthcare industry more essential due to the implementation of cloud technology.
E-commerce & Retail – Cloud architects help online businesses get the most out of their web performance, manage high-volume data, and enhance the user experience.
Career Advancement and Growth Potential
By acquiring specializations in AI/ML, security, and big data analytics with a Google Cloud Architect Certification, professionals can fast-track their career growth. Certifications, such as Google Certified Professional Cloud Security Engineer or Google Certified Data Engineer, also help widen career opportunities.
Final Thoughts
Mastering the GCP Professional Architect Certification enhances career opportunities in cloud computing, including cloud architecture, security, DevOps, and data engineering positions. With organizations rapidly adopting Google Cloud, those with Google Cloud certifications get an advantage in the job market along with future career development in the ever-evolving cloud industry.
#computing#google cloud#google cloud architect#cloudmigration#cloudconsulting#clouds#cloud architecture
0 notes
Text
Mastering Power BI Data Migration with Dataflows
Data migration is a vital step for organizations looking to modernize their data infrastructure, and Power BI dataflows provide an efficient way to handle this transition. With features like centralized data preparation, reusability, and seamless integration with Azure Data Lake Storage, dataflows streamline the ETL (Extract, Transform, Load) process for businesses.
Why Choose Power BI Dataflows for Data Migration?
🔹 Reusability – Apply transformations across multiple Power BI reports, ensuring consistency. 🔹 Simplified ETL Process – Use Power Query Editor to transform and clean data effortlessly. 🔹 Azure Data Lake Integration – Secure and scalable storage for large datasets. 🔹 Improved Data Consistency – Centralized data management eliminates inconsistencies across reports.
Step-by-Step Guide to Dataflow Migration
📌 Migrating Queries from Power BI Desktop: ✅ Copy M code from Power Query Editor and paste it into a new dataflow in the Power BI service. ✅ Save and refresh the dataflow to activate the new data pipeline.
📌 Upgrading from Dataflow Gen1 to Gen2: ✅ Assess existing dataflows and review Microsoft’s migration guidelines. ✅ Update connections and ensure reports are linked to Dataflow Gen2 for better performance and scalability.
0 notes
Text
Address HIPAA compliance and data integration in healthcare.

Introduction
Healthcare organizations handle vast amounts of sensitive patient data, including electronic health records (EHRs), lab results, insurance claims, and real-time monitoring data. Ensuring HIPAA compliance while integrating data across multiple systems is crucial for security, interoperability, and patient privacy.
This article explores how healthcare organizations can leverage secure data integration strategies while complying with HIPAA regulations to protect Protected Health Information (PHI).
1. Understanding HIPAA Compliance in Data Integration
The Health Insurance Portability and Accountability Act (HIPAA) establishes security and privacy rules for handling healthcare data. Key aspects include:
✅ Privacy Rule:
Restricts the use and disclosure of PHI (e.g., patient names, medical records, social security numbers).
Grants patients rights to access their health information.
✅ Security Rule:
Requires technical, administrative, and physical safeguards to protect electronic PHI (ePHI).
Ensures data encryption, secure access controls, and regular risk assessments.
✅ Breach Notification Rule:
Mandates reporting of data breaches to affected individuals and regulatory bodies.
✅ Omnibus Rule:
Extends HIPAA compliance to business associates (e.g., cloud service providers, data processors).
2. Challenges in Healthcare Data Integration
Integrating healthcare data across EHR systems, cloud platforms, and IoT devices presents several challenges:
🔹 Interoperability Issues: Different healthcare providers use various EHR systems (Epic, Cerner, Allscripts), making data exchange complex. 🔹 Data Security Risks: PHI must be encrypted, access-controlled, and logged to prevent breaches. 🔹 Compliance with Multiple Regulations: Along with HIPAA, organizations must comply with GDPR (EU), HITRUST, and state-specific laws. 🔹 Scalability & Performance: Handling large volumes of real-time patient data requires optimized infrastructure.
3. HIPAA-Compliant Data Integration Strategies
A. Secure Data Ingestion
Use secure API endpoints (FHIR, HL7, RESTful APIs) to fetch patient records from EHRs.
Encrypt data in transit using TLS 1.2/1.3.
Example: Secure FHIR API Call (Python)pythonimport requestsheaders = { "Authorization": "Bearer <ACCESS_TOKEN>", "Content-Type": "application/fhir+json" }response = requests.get("https://healthcare-api.com/fhir/Patient/12345", headers=headers) print(response.json())
B. Data Encryption & Masking
Encrypt ePHI at rest and in transit using AES-256 encryption.
Implement data masking to hide sensitive information.
Example: Masking PHI in SQLsqlSELECT patient_id, LEFT(ssn, 3) + 'XXX-XXX' AS masked_ssn, UPPER(first_name) AS first_name FROM patient_records;
C. Role-Based Access Control (RBAC)
Implement least privilege access to PHI using RBAC policies.
Use Multi-Factor Authentication (MFA) for EHR access.
Example: Azure RBAC for Healthcare Datajson{ "role": "Reader", "scope": "/subscriptions/123456/resourceGroups/HealthcareData", "principalId": "[email protected]" }
D. Secure Data Pipelines with Cloud Platforms
Cloud-based ETL tools (Azure Data Factory, AWS Glue, Google Cloud Dataflow) securely extract, transform, and load healthcare data while maintaining HIPAA compliance.
Example: HIPAA-Compliant Data Flow in Azure Data Factory
Ingest HL7/FHIR data from EHRs using secure API calls.
Transform data (standardize medical codes, encrypt PHI) using Mapping Data Flows.
Load processed data into a HIPAA-compliant data lake.
Monitor & audit access logs for compliance tracking.
E. Logging & Auditing for HIPAA Compliance
Enable audit logs for data access tracking.
Implement SIEM (Security Information & Event Management) for real-time anomaly detection.
Example: Logging PHI Access Eventsjson{ "event": "PHI Access", "user": "[email protected]", "timestamp": "2025-02-25T12:34:56Z", "action": "Viewed patient record" }
4. Best Practices for HIPAA-Compliant Data Integration
✔ Use HIPAA-compliant cloud storage (Azure, AWS, Google Cloud). ✔ Enable automated backups and disaster recovery plans. ✔ Perform regular security audits and risk assessments. ✔ Implement anomaly detection for unauthorized data access. ✔ Ensure third-party vendors (API providers, cloud services) are HIPAA-certified.
5. Conclusion
HIPAA compliance is critical for secure healthcare data integration. By implementing secure APIs, encryption, RBAC, and cloud-based ETL pipelines, healthcare organizations can safely integrate data while maintaining privacy and regulatory compliance.
WEBSITE: https://www.ficusoft.in/azure-data-factory-training-in-chennai/
0 notes
Text
Aligning BI Strategy with Microsoft’s Analytics Stack
In today’s data-driven world, aligning your Business Intelligence (BI) strategy with a robust analytics ecosystem is no longer optional—it’s essential. Microsoft’s analytics stack, centered around Power BI, Azure Synapse Analytics, and the broader Azure Data Services, offers a scalable, unified platform that can transform how organizations gather insights, make decisions, and achieve business goals.
For enterprises transitioning from Tableau to Power BI, integrating with Microsoft’s analytics stack is more than a technical shift—it’s a strategic opportunity.
Why Microsoft’s Analytics Stack?
Microsoft’s stack is designed with synergy in mind. Power BI serves as the front-end visualization tool, while Azure Synapse Analytics acts as the powerhouse for data integration, big data analytics, and real-time processing. Azure Data Factory, Azure Data Lake, and SQL Server complement the environment by enabling seamless data movement, storage, and management.
Aligning with this ecosystem empowers organizations to:
Unify data access and governance
Leverage native AI and machine learning
Streamline collaboration via Microsoft 365 integration
Improve performance with cloud-scale analytics
Key Considerations for BI Strategy Alignment
1. Define Strategic Goals Clearly Start with identifying what you want to achieve—whether it’s real-time reporting, predictive analytics, or better self-service BI. Microsoft’s platform offers the flexibility to scale BI initiatives based on maturity and business priorities.
2. Optimize Data Architecture Unlike Tableau’s more visual-centric architecture, Power BI thrives in a model-driven environment. Organizations should design dataflows and models to fully leverage Power BI’s DAX capabilities, semantic layers, and integration with Azure SQL and Synapse.
3. Leverage Azure Synapse for Enterprise-Scale Analytics Synapse enables unified analytics over big data and structured data. When aligned with Power BI, it removes data silos and allows for direct querying of large datasets, which enhances performance and reduces duplication.
4. Automate with Azure Data Factory A well-aligned BI strategy includes efficient ETL processes. Azure Data Factory helps automate pipelines and data transformations that feed clean data into Power BI for analysis, reducing manual effort and errors.
5. Prioritize Governance and Security With Microsoft Purview and Power BI's Row-Level Security (RLS), organizations can ensure data compliance and user-level control over access. This becomes increasingly vital during and after a migration from platforms like Tableau.
A Strategic Migration Opportunity
For those moving from Tableau to Power BI, aligning with Microsoft’s full analytics stack opens doors to advanced capabilities previously underutilized. Tools like Pulse Convert by OfficeSolution help automate and optimize this migration process, ensuring that your data assets, dashboards, and logic align smoothly with Power BI’s architecture.
Final Thoughts
Aligning your BI strategy with Microsoft’s analytics stack isn't just a move to a new tool—it’s an investment in a future-ready, scalable, and intelligent data ecosystem. Whether you're migrating from Tableau or building from scratch, OfficeSolution is here to guide you in leveraging the full potential of Microsoft's platform for long-term analytics success.
0 notes
Text
ETL Pipeline Performance Tuning: How to Reduce Processing Time
In today’s data-driven world, businesses rely heavily on ETL pipelines to extract, transform, and load large volumes of data efficiently. However, slow ETL processes can lead to delays in reporting, bottlenecks in data analytics, and increased infrastructure costs. Optimizing ETL pipeline performance is crucial for ensuring smooth data workflows, reducing processing time, and improving scalability.
In this article, we’ll explore various ETL pipeline performance tuning techniques to help you enhance speed, efficiency, and reliability in data processing.
1. Optimize Data Extraction
The extraction phase is the first step of the ETL pipeline and involves retrieving data from various sources. Inefficient data extraction can slow down the entire process. Here’s how to optimize it:
a) Extract Only Required Data
Instead of pulling all records, use incremental extraction to fetch only new or modified data.
Implement change data capture (CDC) to track and extract only updated records.
b) Use Efficient Querying Techniques
Optimize SQL queries with proper indexing, partitioning, and WHERE clauses to fetch data faster.
Avoid SELECT * statements; instead, select only required columns.
c) Parallel Data Extraction
If dealing with large datasets, extract data in parallel using multi-threading or distributed processing techniques.
2. Improve Data Transformation Efficiency
The transformation phase is often the most resource-intensive step in an ETL pipeline. Optimizing transformations can significantly reduce processing time.
a) Push Transformations to the Source Database
Offload heavy transformations (aggregations, joins, filtering) to the source database instead of handling them in the ETL process.
Use database-native stored procedures to improve execution speed.
b) Optimize Joins and Aggregations
Reduce the number of JOIN operations by using proper indexing and denormalization.
Use hash joins instead of nested loops for large datasets.
Apply window functions for aggregations instead of multiple group-by queries.
c) Implement Data Partitioning
Partition data horizontally (sharding) to distribute processing load.
Use bucketing and clustering in data warehouses like BigQuery or Snowflake for optimized query performance.
d) Use In-Memory Processing
Utilize in-memory computation engines like Apache Spark instead of disk-based processing to boost transformation speed.
3. Enhance Data Loading Speed
The loading phase in an ETL pipeline can become a bottleneck if not managed efficiently. Here’s how to optimize it:
a) Bulk Loading Instead of Row-by-Row Inserts
Use batch inserts to load data in chunks rather than inserting records individually.
Tools like COPY command in Redshift or LOAD DATA INFILE in MySQL improve bulk loading efficiency.
b) Disable Indexes and Constraints During Load
Temporarily disable foreign keys and indexes before loading large datasets, then re-enable them afterward.
This prevents unnecessary index updates for each insert, reducing load time.
c) Use Parallel Data Loading
Distribute data loading across multiple threads or nodes to reduce execution time.
Use distributed processing frameworks like Hadoop, Spark, or Google BigQuery for massive datasets.
4. Optimize ETL Pipeline Infrastructure
Hardware and infrastructure play a crucial role in ETL pipeline performance. Consider these optimizations:
a) Choose the Right ETL Tool & Framework
Tools like Apache NiFi, Airflow, Talend, and AWS Glue offer different performance capabilities. Select the one that fits your use case.
Use cloud-native ETL solutions (e.g., Snowflake, AWS Glue, Google Dataflow) for auto-scaling and cost optimization.
b) Leverage Distributed Computing
Use distributed processing engines like Apache Spark instead of single-node ETL tools.
Implement horizontal scaling to distribute workloads efficiently.
c) Optimize Storage & Network Performance
Store intermediate results in columnar formats (e.g., Parquet, ORC) instead of row-based formats (CSV, JSON) for better read performance.
Use compression techniques to reduce storage size and improve I/O speed.
Optimize network latency by placing ETL jobs closer to data sources.
5. Implement ETL Monitoring & Performance Tracking
Continuous monitoring helps identify performance issues before they impact business operations. Here’s how:
a) Use ETL Performance Monitoring Tools
Use logging and alerting tools like Prometheus, Grafana, or AWS CloudWatch to monitor ETL jobs.
Set up real-time dashboards to track pipeline execution times and failures.
b) Profile and Optimize Slow Queries
Use EXPLAIN PLAN in SQL databases to analyze query execution plans.
Identify and remove slow queries, redundant processing, and unnecessary transformations.
c) Implement Retry & Error Handling Mechanisms
Use checkpointing to resume ETL jobs from failure points instead of restarting them.
Implement automatic retries for temporary failures like network issues.
Conclusion
Improving ETL pipeline performance requires optimizing data extraction, transformation, and loading processes, along with choosing the right tools and infrastructure. By implementing best practices such as parallel processing, in-memory computing, bulk loading, and query optimization, businesses can significantly reduce ETL processing time and improve data pipeline efficiency.
If you’re dealing with slow ETL jobs, start by identifying bottlenecks, optimizing SQL queries, and leveraging distributed computing frameworks to handle large-scale data processing effectively. By continuously monitoring and fine-tuning your ETL workflows, you ensure faster, more reliable, and scalable data processing—empowering your business with real-time insights and decision-making capabilities.
0 notes
Text

📊 Why are dataflows important in end-to-end analytics? Dataflows (Gen2) play a key role by helping you: ✅ Prepare consistent data ✅ Stage it in your preferred destination ✅ Reuse it across reports ✅ Easily refresh and update it
They streamline your analytics process from raw data to actionable insights!
💬 How are you using dataflows in your projects?
#PowerBI#Dataflows#DataTransformation#Analytics#MicrosoftFabric#DataPreparation#ETL#Gen2Dataflows#DataEngineering#BI#DataPipeline#TechTips#dax
0 notes
Text
Automating Tableau Reports Validation: The Easy Path to Trusted Insights
Automating Tableau Reports Validation is essential to ensure data accuracy, consistency, and reliability across multiple scenarios. Manual validation can be time-consuming and prone to human error, especially when dealing with complex dashboards and large datasets. By leveraging automation, organizations can streamline the validation process, quickly detect discrepancies, and enhance overall data integrity.
Going ahead, we’ll explore automation of Tableau reports validation and how it is done.
Importance of Automating Tableau Reports Validation
Automating Tableau report validation provides several benefits, ensuring accuracy, efficiency, and reliability in BI reporting.
Automating the reports validation reduces the time and effort, which allows analysts to focus on insights rather than troubleshooting the errors
Automation prevents data discrepancies and ensures all reports are pulling in consistent data
Many Organizations deal with high volumes of reports and dashboards. It is difficult to manually validate each report. Automating the reports validation becomes critical to maintain efficiency.
Organizations update their Tableau dashboards very frequently, sometimes daily. On automating the reports validation process, a direct comparison is made between the previous and current data to detect changes or discrepancies. This ensures metrics remain consistent after each data refresh.
BI Validator simplifies BI testing by providing a platform for automated BI report testing. It enables seamless regression, stress, and performance testing, making the process faster and more reliable.
Tableau reports to Database data comparison ensures that the records from the source data are reflected accurately in the visuals of Tableau reports.
This validation process extracts data from Tableau report visuals and compares it with SQL Server, Oracle, Snowflake, or other databases. Datagaps DataOps Suite BI Validator streamlines this by pulling report data, applying transformations, and verifying consistency through automated row-by-row and aggregate comparisons (e.g., counts, sums, averages).
The errors detected usually identify missing, duplicate or mismatched records.
Automation ensures these issues are caught early, reducing manual effort and improving trust in reporting.
Tableau Regression
In the DataOps suite, Regression testing is done by comparing the benchmarked version of tableau report with the live version of the report through Tableau Regression component.
This Tableau regression component can be very useful for automating the testing of Tableau reports or Dashboards during in-place upgrades or changes.
A diagram of a process AI-generated content may be incorrect.
Tableau Upgrade
Tableau Upgrade Component in BI validator helps in automated report testing by comparing the same or different reports of same or different Tableau sources.
The comparison is done in the same manner as regression testing where the differences between the reports can be pointed out both in terms of text as well as appearance.
Generate BI DataFlows is a handy and convenient feature provided by Datagaps DataOps suite to generate multiple dataflows at once for Business Intelligence components like Tableau.
Generate BI DataFlows feature is beneficial in migration scenarios as it enables efficient data comparison between the original and migrated platforms and supports the validations like BI source, Regression and Upgrade. By generating multiple dataflows based on selected reports, users can quickly detect discrepancies or inconsistencies that may arise during the migration process, ensuring data integrity and accuracy while minimizing potential errors. Furthermore, when dealing with a large volume of reports, this feature speeds up the validation process, minimizes manual effort, and improves overall efficiency in detecting and resolving inconsistencies.
As seen from the image, the wizard starts by generating the Dataflow details. The connection details like the engine, validation type, Source-Data Source and Target-Data Source are to be provided by users.
Note: BI source validation and Regression validation types do not prompt for Target-Data source
Let’s take a closer look at the steps involved in “Generate BI Dataflows”
Reports
The Reports section prompts users to select pages from the required reports in the validation process. For Data Compare validation and Upgrade Validation, both source and target pages will be required. For other cases, only the source page will be needed.
Here is a sample screenshot of the extraction of source and target pages from the source and target report respectively
Visual Mapping and Column Mapping (only in Data Compare Validation)
The "Visual Mapping" section allows users to load and compare source and target pages and then establish connections between corresponding tables.
It consists of three sections namely Source Page, Target Page, and Mapping.
In the source page and target page, respective Tableau worksheets are loaded and on selecting the worksheets option, users can preview the data.
After loading the source and target pages, in the mapping section, the dataset columns of source and target will be automatically mapped for each mapping.
After Visual Mapping, the "Column Mapping" section displays the columns of the source dataset and target dataset that were selected for the data comparison. It provides a count of the number of dataset columns that are mapped and unmapped in the "Mapped" and "Unmapped" tabs respectively.
Filters (for the rest of the validation types)
The filters section enables users to apply the filters and parameters on the reports to help in validating them. These filters can either be applied and selected directly through reports or they can be parameterized as well.
Options section varies depending on the type of validation selected by the user. Options section is the pre final stage of generating the flows where some of the advanced options and comparison options are prompted to be selected as per the liking of the user to get the results as they like.
Here’s a sample screenshot of options section before generating the dataflows
This screenshot indicates report to report comparison options to be selected.
Generate section helps to generate multiple dataflows with the selected type of validation depending on the number of selected workbooks for tableau.
The above screenshot indicates that four dataflows are set to be generated on clicking the Generate BI Dataflows button. These dataflows are the same type of validation (Tableau Regression Validation in this case)
Stress Test Plan
To automate the stress testing and performance testing of Tableau Reports, Datagaps DataOps suite BI Validator comes with a component called Stress Test Plan to simulate the number of users actively accessing the reports to analyze how Tableau reports and dashboards perform under heavy load. Results of the stress test plan can be used to point out performance issues, optimize data models and queries to ensure the robustness of the Tableau environment to handle heavy usage patterns. Stress Test Plan allows users to perform the stress testing for multiple views from multiple workbooks at once enabling the flexibility and automation to check for performance bottlenecks of Tableau reports.
For more information on Stress Test Plan, check out “Tableau Performance Testing”.
Integration with CI/CD tools and Pipelines
In addition to these features, DataOps Suite comes with other interesting features like application in built pipelines where the set of Tableau BI dataflows can be run automatically in a certain order either in sequence or parallel.
Also, there’s an inbuilt scheduler in the application where the users can schedule the run of these pipelines involving these BI dataflows well in advance. The jobs can be scheduled to run once or repeatedly as well.
Achieve the seamless and automated Tableau report validation with the advanced capabilities of Datagaps DataOps Suite BI Validator.
0 notes
Text
Staff Nurse II
QUALIFICATIONS At least 2 years of solid post-license experience in hospitals with a minimum of 100-bed capacity No more than 6 months of work gap Dataflow Report and an active Mumaris+ Account (advantage) A valid Saudi Council License… Apply Now
0 notes