#DataModeling
Explore tagged Tumblr posts
Visit Tumblr Blog
Explore Tumblr blogs with no restrictions, modern design and the best experience.
Last Seen Tumblr Blogs


Fun Fact
When “GIF” was named word of the year in 2012, Oxford Dictionaries U.S.A. credited Tumblr for pushing the word.
Text

🧩 Power Query Online Tip: Diagram View
Q: What does the Diagram View in Power Query Online allow you to do?
✅ A: It gives you a visual representation of how your data sources are connected and what transformations have been applied.
🔍 Perfect for understanding query logic, debugging complex flows, and documenting your data prep process—especially in Dataflows Gen2 within Microsoft Fabric.
👀 If you're more of a visual thinker, this view is a game-changer!
💬 Have you tried Diagram View yet? What’s your experience with it?
#PowerQuery#PowerQueryOnline#MicrosoftFabric#DataflowsGen2#DataPreparation#ETL#DataTransformation#DiagramView#LowCode#DataEngineering#FabricCommunity#PowerBI#DataModeling#OneLake
0 notes
Text
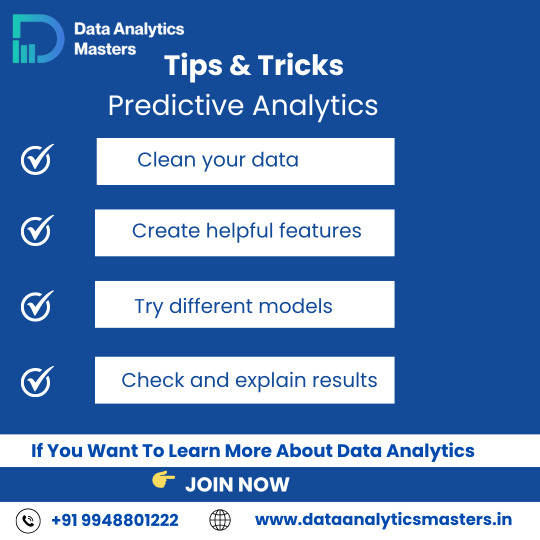
🔍 Predictive Analytics Tips & Tricks!
Want to make smart business decisions using data?
Start with these basics:
✅ Clean your data
✅ Create helpful features
✅ Try different models
✅ Check and explain results
📊 Master predictive analytics with real-time practice & projects!
Start your data journey today with Data Analytics Masters.
✅ Why Choose Us?
✔️ 100% practical training
✔️ Real-time projects & case studies
✔️ Expert mentors with industry experience
✔️ Certification & job assistance
✔️ Easy-to-understand Telugu + English mix classes
📍 Institute Address:
3rd Floor, Dr. Atmaram Estates, Metro Pillar No. A690,
Beside Siri Pearls & Jewellery, near JNTU Metro Station,
Hyder Nagar, Vasantha Nagar, Hyderabad, Telangana – 500072
📞 Contact: +91 9948801222
📧 Email: [email protected]
🌐 Website: https://dataanalyticsmasters.in
#PredictiveAnalytics#DataAnalyticsTips#EduInspiration#LearnDataAnalytics#DataScienceIndia#MachineLearningJourney#CleanYourData#FeatureEngineering#DataModeling#AnalyticsSkills#CareerInDataScience#TechEducationIndia#DataAnalyticsMasters#StudyWithUs#HyderabadTech
0 notes
Text

Dive into the #Guidewire Data Model with this quick knowledge boost from #GuidewireMasters!
Key Concepts: 🔹 Extension & Creation 🔹 Entity Relationships 🔹 Typelists & Typecodes 🔹 Lifecycle & Persistence 🔹 Studio Tools
🌐 Learn more: guidewiremasters.in 📞 +91 9885118899
0 notes
Text
Master Data Modeling Basics with IcedQ University
Dive into core database concepts with IcedQ University’s Data Models and Database Fundamentals course. Covering ER diagrams, dimensional modeling, and critical table types like master and transaction tables, this course is perfect for building a strong foundation in data systems and database design. You’ll also understand how to implement scalable architecture that supports business intelligence, analytics, and data warehousing needs—an essential skill for anyone working in modern data environments.
👉 Start your learning journey today: Enroll Here
#icedq#datamodeling#SQLTraining#DataArchitecture#LearnDataModeling#DatabaseFundamentals#DataAnalyticsBasics#StructuredData#OnlineDataCourse#production data monitoring#data migration testing tools#data reliability engineering
0 notes
Text
MySQL is an open-source relational database management system (RDBMS) that is widely used for storing, managing, and retrieving data efficiently. It is one of the most popular database systems, known for its speed, reliability, and ease of use. MySQL is commonly used in web development, powering applications such as WordPress, Facebook, and many others.
#MySQL#Database#SQL#DatabaseManagement#TechEducation#MySQLTutorial#SQLDatabase#TechBooks#DataManagement#MySQLForBeginners#TechLearning#RelationalDatabase#DatabaseDesign#MySQLQueries#CRUDOperations#DatabaseOptimization#MySQLDatabase#WebDevelopment#TechTutorial#BackendDevelopment#MySQLAdmin#DatabaseSecurity#DataModeling#MySQLTips#WebAppDevelopment#MySQLBestPractices
0 notes
Text

Automate AI Model Generation & Save Time! ⏳💰 VADY simplifies enterprise-level data automation, cutting down costs and development time for businesses. Automate complex analytics with ease!
#VADY#NewFangled#AIAutomation#DataEngineering#AIforEnterprises#AIML#AIpoweredAutomation#DataTech#SmartAI#TechSolutions#BusinessAutomation#DigitalTransformation#DataModeling#EnterpriseDataSolutions#AIforEfficiency#AIinDataEngineering#SmartDataTools#AIandML#PredictiveAnalyticsTools#DataScienceAutomation#BIautomation
0 notes
Text
Healthcare Modeling & Forecasting Solutions
Unlock data-driven decision-making with Healthark Insights�� advanced modeling and forecasting solutions. From market sizing to predictive analytics, we help healthcare organizations anticipate trends, optimize strategies, and drive growth with precision.
0 notes
Text
Star Schema vs Snowflake Schema: Choosing the Right Data Structure for Your Business
In the fast-paced world of data management, selecting the right schema is crucial for efficient data storage and retrieval. In this video, we explore the Star and Snowflake schemas, comparing their structures, advantages, and challenges. Whether you're managing a simple data environment or a complex system, this guide will help you choose the best schema to optimize your analytical capacity. Learn how each schema can impact performance, storage efficiency, and data integrity for your organization.
youtube
#DataManagement#StarSchema#SnowflakeSchema#DataWarehousing#DataModeling#DataStorage#BigData#Analytics#BusinessIntelligence#SQL#DatabaseDesign#TechTrends#DataScience#DataArchitecture#DataRetrieval#StorageOptimization#DatabasePerformance#BusinessAnalytics#DataRedundancy#DataIntegrity#Youtube
0 notes
Text

🚀 Free Online Workshop on Django ORM! 🚀
🔴 Master Data Modeling with Django ORM! 🔴
📌 Workshop Details: 📅 Date: 15th & 16th February 2025 ⏰ Time: 9:00 AM - 11:00 AM (IST) 💻 Mode: Online
🎯 What You’ll Learn? ✅ How to design powerful data models ✅ Implementing Django ORM effectively ✅ Best practices for database optimization
🔗 Register Now: https://t.ly/uZSyu
📲 Webex Meeting Details: 🆔 Meeting ID: 2512 726 5957 🔐 Password: 112233
💡 For More Details: 🌐 Visit: https://nareshit.com/.../full-stack-python-online-training 📞 Call: +91-9000994007, 9000994008, 9121104164
#Python#Django#WebDevelopment#DataModeling#FullStackPython#LearnToCode#NareshIT#OnlineWorkshop#Programming#SQL#TechTraining
0 notes
Text

Diagram View in Power Query Online lets you visually explore and manage your data transformation steps and dependencies. It's great for understanding the flow and structure of your queries. Have you tried it yet? What do you like or wish it had?
#PowerQuery#DataTransformation#MicrosoftFabric#PowerBI#DataPrep#DiagramView#DataModeling#AnalyticsTools
0 notes
Text
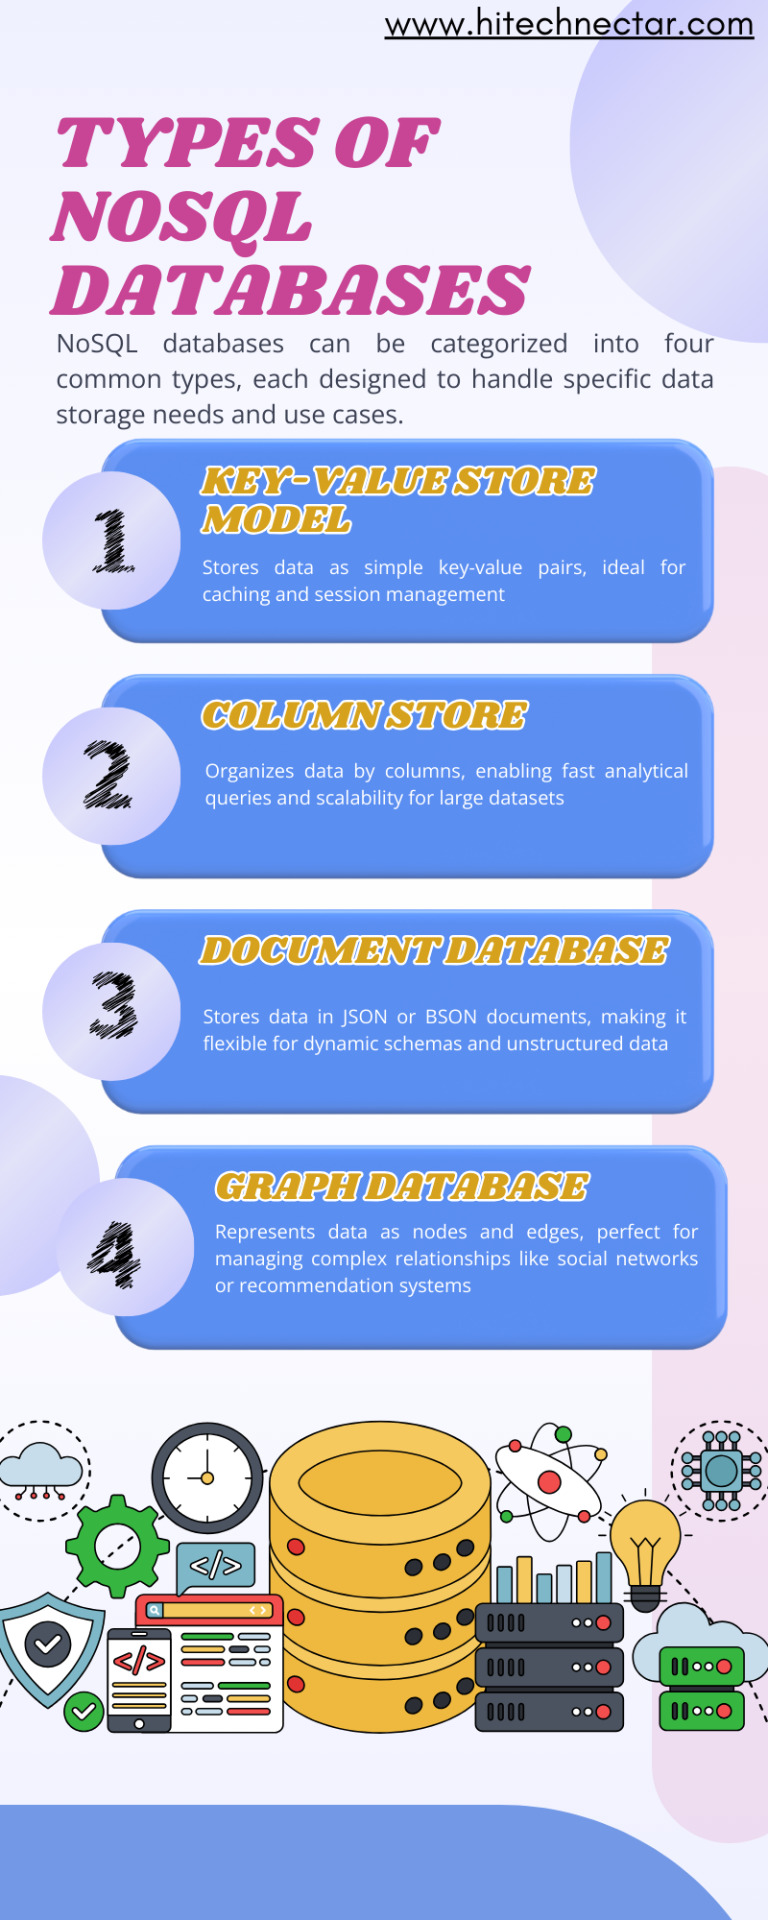
Four Common Types of NoSQL Databases
NoSQL databases are categorized into four primary types, each designed to address specific data storage and retrieval needs. Read More
#NoSQL#DatabaseTechnology#DataManagement#BigData#DataStorage#TechTrends#CloudComputing#DataAnalytics#DigitalTransformation#DatabaseSolutions#DataModeling
0 notes
Text

📘 Guidewire Entities & Data Model – 5 Key Tips You Shouldn’t Miss! Boost your system performance and maintain best practices with these top data modeling strategies from Guidewire Masters:
1️⃣ Extend, don’t modify OOTB entities 2️⃣ Understand Foreign Keys & TypeKeys 3️⃣ Bundle awareness is non-negotiable 4️⃣ Be strategic with Arrays vs. Lists 5️⃣ Index your heavily queried fields
🎯 Optimize your implementation like a pro. 🌐 Visit: www.guidewiremasters.in | 📞 +91 9885118899
0 notes
Text
Boost Your Power BI Skills with This DAX Guide | Memetic Solutions
DAX (Data Analysis Expressions) is a powerful formula language used in Power BI to create custom calculations and data models. Understanding DAX is crucial for anyone looking to harness the full potential of Power BI for data analysis. Here's an easy-to-follow guide to help you dive into DAX functions, their applications, and how they can transform your data insights.
What Are DAX Functions?
DAX is a formula language specifically designed for Power BI, Excel, and Analysis Services. It enables you to create calculated columns, measures, and tables to derive deeper insights from your data.
Key Types of DAX Functions: -
Aggregation Functions: Perform calculations like SUM, AVERAGE, MIN, and MAX on your data. Example: SUM(Sales[Revenue]) adds up all revenue in the "Sales" table.
Filter Functions: Create calculations that filter data dynamically. Example: FILTER(Sales, Sales[Category] = "Electronics") isolates sales for electronics.
Time Intelligence Functions: Analyze data across different time periods. Example: TOTALYTD(Sales[Revenue], Dates[Date]) calculates year-to-date revenue.
Logical Functions: Perform conditional checks and comparisons. Example: IF(Sales[Revenue] > 10000, "High", "Low") categorizes revenue.
Text Functions: Manipulate and format text data. Example: CONCATENATE(Sales[Region], " - ", Sales[Category]) combines region and category names.
Mathematical Functions: Perform advanced mathematical calculations. Example: ROUND(Sales[Revenue], 2) rounds revenue to two decimal places.
Why Learn DAX?
Enhanced Insights: Allows you to perform in-depth data analysis. Custom Reports: Create highly customized and interactive dashboards. Data Modeling: Helps in building robust and efficient data models. Tips for Learning DAX Start with basic functions like SUM, AVERAGE, and COUNT.
Gradually explore advanced concepts like CALCULATE and RELATED.
Practice writing and testing functions in Power BI Desktop.
Refer to the DAX Function Reference regularly for detailed explanations.
DAX formulas Are Used In: -
Measures: Measures are dynamic calculations that adjust based on the context within your reports, such as filters and slicers. They are essential for aggregating data, like summing sales or calculating averages.
Calculated Tables: Calculated tables are created using DAX formulas and are particularly useful when you need a new table based on existing data. They allow for data modeling without requiring additional data imports.
Calculated Columns: Calculated columns add new data to existing tables by applying a DAX formula to each row. They are useful for creating new information from existing data.
Row-Level Security (RLS): RLS restricts data access for specified users, ensuring that individuals can only view data pertinent to their roles. DAX formulas define these security filters.
Conclusion:
Mastering DAX functions can take your data analysis skills to the next level, allowing you to extract actionable insights and build powerful dashboards. Begin your journey by experimenting with basic functions and gradually dive into more complex ones.
For more in-depth guidance and tutorials, visit our website Memetic Solutions!
#DAXFunctions#PowerBI#DataAnalysis#DataModeling#BusinessIntelligence#LearnDAX#PowerBIUsers#DataInsights#DataVisualization#Analytics
0 notes
Text
#DataMining#DataModeling#BigData#DataAnalytics#MachineLearning#PredictiveAnalytics#DataScience#DataVisualization#AI#BusinessIntelligence#DataDriven#DataAnalysis#AdvancedAnalytics#DataTechnology#DataMiningMarket
0 notes
Text
For a tutorial or article on "MongoDB", you would want to focus on tags related to NoSQL databases, backend development, and database management.
#MongoDB#NoSQL#Database#BackendDevelopment#TechEducation#MongoDBForBeginners#DatabaseManagement#TechBooks#MongoDBTutorial#DataStorage#MongoDBDevelopment#WebDevelopment#MongoDBProjects#TechLearning#DataModeling#MongoDBAtlas#MongoDBTips#FullStackDevelopment#TechCommunity
0 notes
Text
Data science training program in Ahmedabad!
Are you ready to dive into the world of data? Whether you are a recent graduate, an experienced IT professional, or someone looking to switch careers, Data science course is your gateway to mastering the most in-demand skills in data science. Data Science training can mean acquiring the skills needed to enter a high-paying and rewarding career.
Data science can significantly boost your job prospects and open doors to a wide range of opportunities. Shape Your Future with GRRAS Solutions' Data Science Training in Ahmedabad. From Python programming, SQL, and machine learning to data visualization, analytics, and predictive modeling, we’ve got it all covered with a structured, hands-on curriculum.
With the exponential growth of data, companies are actively seeking professionals who can analyze and extract insights to drive business outcomes. Data Scientists, Analysts, and Machine Learning Engineers are among the highest-paid and most sought-after professionals in the tech world today.
The ability to transform raw data into actionable insights opens the door to a wide range of career opportunities, from Data Science roles to Artificial Intelligence and Business Intelligence positions.
Our approach emphasizes practical learning through real-world projects, ensuring you gain the confidence and expertise to excel in roles like Data Scientist, Analyst, or Business Intelligence Specialist.
And here’s the best part—our course comes with 100% job placement assistance! Our placement team offers personalized support, from resume building and interview prep to direct connections with top hiring companies. With flexible learning options and mentorship from industry experts, this course ensures you're ready for your dream job the moment you complete it.
Grras Solutions Data Science training in Ahmedabad offers an excellent opportunity to gain the skills necessary for a future-proof career. With a comprehensive curriculum, practical experience, expert instructors, and job placement support, you can confidently step into the world of data and begin a rewarding career. Don’t miss out on the chance to be a part of the data revolution.
At GRRAS Solutions, we don’t just teach data science—we help you build a career. Enroll now and let us guide you toward a successful, data-driven future!

#datasciencecourseinahmedabad#datascience#datasciencetraining#machinelearning#data visualization#data analysis#datamodeling#grrassolutions
0 notes