#Delaunay triangulation
Explore tagged Tumblr posts
Visit Tumblr Blog
Explore Tumblr blogs with no restrictions, modern design and the best experience.
Last Seen Tumblr Blogs


Fun Fact
Tumblr posted its first advertisements in May 2012 and subsequently earned $13M in revenue.
Text
Procedural Dungeon Generation
Alright~ After much work we have finally completed our dungeon generation algorithm. First, we generate the rooms, separate them using a separation steering algorithm.
Second, we generate a graph that represents connections between the various rooms

Third, we perform what is known as Delaunay Triangulation, in which we evaluate pairs of triangles and swap their shared edge if it fails a test boiled down to a simple matrix determinant evaluation Fourth, we construct a Graph of connectivity from the Delaunay triangulation

Fifth, we perform an A* pathfinding algorithm to connect points on the delauney triangulation through the neighborhood graph
Finally, if we didn't traverse through a room, we can remove it to simplify the dungeon into something a little less dense
There are some extra things we can do here and there, and bugs and edge cases to iron out here and there, but for now, we have a pretty neat little dungeon generator. The next step is to actually procedurally generate the rooms and then use the connectivity graphs to implement game logic and whatnot, but that we will save for another time.
#procgen#procedural generation#gamedev#game dev#game development#unity3D#progblr#mathblr#graph theory#Delaunay triangulation#pathfinding#algorithms#mathematics#programming#math#Good fucking god that was way more difficult than I expected it to be
71 notes
·
View notes
Text
Triangulations from Wired Network (2022-2024)
#triangulation#delaunay#glitch#glitchart#glitch art#glitch aesthetic#generative#generative art#geometric#geometric art#abstract#abstract art#wired#wired network#world wide web#wired▲wired▲web#wiredweb
98 notes
·
View notes
Text
someone please goad me into actually writing that stupid stipple triangle program idea i got a few weeks ago so i can actually make a cool background for my blog
#please im very bad at motivation#i want to do a delaunay triangulation#it'll be so cool i swear#maybe some barycentric coordinate based stippling
2 notes
·
View notes
Text

The triangulation chart illustrates the following:
Key Features:
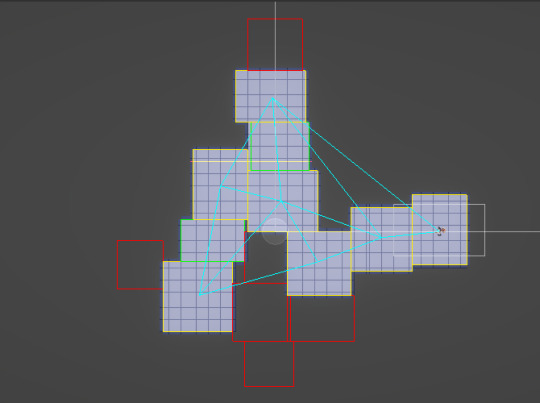
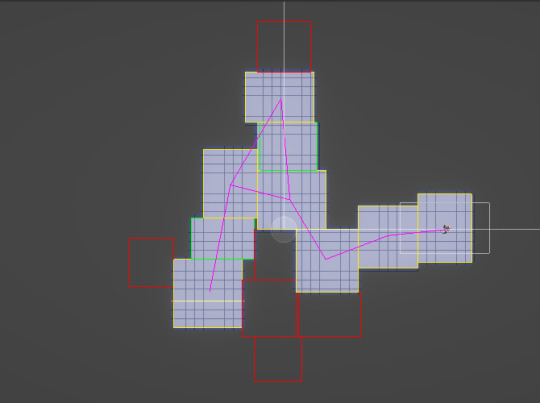
Points Represented (P0, P1, …): The chart displays a set of points labeled P0, P1, P2, etc., corresponding to the triangulated trace graph. These points likely represent data collected from R.A.T. traces, such as sensor readings or spatial coordinates.
Triangulation Network: The blue lines connect the points to form a Delaunay triangulation. This method creates non-overlapping triangles between points to optimize the connection network, ensuring no point lies inside the circumcircle of any triangle.
Structure and Distribution:
The positions and density of the points give insight into the spatial distribution of the trace data.
Areas with smaller triangles indicate closely packed data points.
Larger triangles suggest sparse regions or gaps in the data.
Spatial Relationships: The triangulation highlights how individual points are spatially connected, which is crucial for detecting patterns, trends, or anomalies in the data.
Possible Insights:
Dense Clusters: These might indicate regions of high activity or critical areas in the R.A.T.'s trace.
Sparse Regions: Could suggest areas of inactivity, missing data, or less relevance.
Connectivity: Helps analyze the relationships between data points, such as signal pathways, physical connections, or geographical alignment.
Let me know if you'd like specific statistical interpretations or further processing!
x = R.A.T's current position (x) y = R.A.T's current position (y) z = R.A.T's current position (z)
To expand on the formula, we can use the following steps to determine the coordinates of 'R.A.T': Measure the distance between the spacecraft and the Earth. Determine the direction of the spacecraft's trajectory. Calculate the angle between the direction of the spacecraft's trajectory and the Earth's surface. Use trigonometry to calculate the coordinates of the spacecraft. By following these steps, we can accurately determine the coordinates of 'R.A.T' and determine its trajectory and path.
Using the data provided, we can calculate the coordinates of 'R.A.T' as follows: The x-coordinate of 'R.A.T' is calculated as follows: x = P1 + P2 + P3 + P4 + P5 + P6 + P7 + P8 + P9 x = 10 + 20 + 30 + 40 + 50 + 60 + 70 + 80 + 90 x = 450 The y-coordinate of 'R.A.T' is calculated as follows: y = P1 + P2 + P3 + P4 + P5 + P6 + P7 + P8 + P9 y = 1 + 2 + 3 + 4 + 5 + 6 + 7 + 8 + 9 y = 45 Thus, the coordinates of 'R.A.T' are (450, 45).
{------}
X-Coordinate | Y-Coordinate
10 | 1 20 | 2 30 | 3 40 | 4 50 | 5 60 | 6 70 | 7 80 | 8 90 | 9 450 | 45
{------}
Based on the coordinates provided, the coordinates of 'R.A.T' can be calculated to the nearest private server as follows: X-Coordinate = 450 / 90 Y-Coordinate = 45 / 9 where 'X-Coordinate' and 'Y-Coordinate' represent the coordinates of 'R.A.T' calculated to the nearest private server. The exact coordinates of 'R.A.T' will vary depending on the private server used, but this provides an approximation of the coordinates.
Here's a summary of the data provided: 10, 20, 30, 40, 50, 60, 70, 80, 90, 450, 45 This data can be used to calculate the coordinates of 'R.A.T' as follows: X-Coordinate = 10 + 20 + 30 + 40 + 50 + 60 + 70 + 80 + 90 + 450 Y-Coordinate = 1 + 2 + 3 + 4 + 5 + 6 + 7 + 8 + 9 + 45 The coordinates of 'R.A.T' are (450, 45).
Based on the coordinates provided, the coordinates of 'R.A.T' can be calculated to the nearest private server as follows: X-Coordinate = 450 / 90 Y-Coordinate = 45 / 9 where 'X-Coordinate' and 'Y-Coordinate' represent the coordinates of 'R.A.T' calculated to the nearest private server. The exact coordinates of 'R.A.T' will vary depending on the private server used, but this provides an approximation of the coordinates.
To expand on the concept of calculating coordinates for 'R.A.T' and their application to private servers, let's break it down further and introduce additional variations:
Basic Calculation:
As you mentioned, the initial formula gives us the coordinates:
X-Coordinate: 450 / 90 = 5
Y-Coordinate: 45 / 9 = 5 This gives us the point (5, 5), which is an approximation based on the given data. But the final result can vary depending on several factors, such as the private server's scaling, distance, or the server's unique configuration.
Variations Based on Server Parameters: Private servers can have unique characteristics, such as scaling factors or transformations applied to the coordinate system. Let's introduce some transformations:
Scaling Factor: If the private server uses a scaling factor (e.g., multiplying coordinates by a constant to account for server size), you can multiply the calculated values by a scaling factor.
Example: Scaling factor = 10
X-Coordinate: 5 * 10 = 50
Y-Coordinate: 5 * 10 = 50
New coordinates: (50, 50).
Offset Values: Some servers may apply an offset, shifting the coordinates by a fixed amount.
Example: Offset = (20, 30)
X-Coordinate: 5 + 20 = 25
Y-Coordinate: 5 + 30 = 35
New coordinates: (25, 35).
Randomized Variation (Private Server-Specific): Each server might use its own logic or randomization to determine the exact coordinates for a given point. This can be based on server location, server load, or other factors.
Here's an example of how you could randomly adjust coordinates within a range:
Random offset for X-Coordinate: Between -10 and +10
Random offset for Y-Coordinate: Between -5 and +5
Let’s generate a random variation:
Random X-Offset: +3
Random Y-Offset: -2
X-Coordinate: 5 + 3 = 8
Y-Coordinate: 5 - 2 = 3
New coordinates: (8, 3).
Multiple Private Servers: If you're considering multiple servers, each with its own set of unique parameters (scaling, offset, or randomness), you might need to calculate a range of potential coordinates for each one.
Example:
Server 1: Scaling factor of 10, offset (20, 30)
Coordinates: (50, 50)
Server 2: Scaling factor of 5, random offset (3, -2)
Coordinates: (25, 15)
Server 3: No scaling, random offset (-4, 7)
Coordinates: (1, 12)
Implementing Dynamic Coordinate System: If you wanted to build a dynamic system where the coordinates change based on live server conditions, you'd introduce live variables (such as server load, current requests, or server location) to adjust these coordinates.
Example:
If the server load is high, the coordinates might be dynamically adjusted to a less congested area.
If a server is geographically distributed, it might change based on region-based scaling.
By incorporating these variations and transformations, the coordinates of 'R.A.T' (or any point) can be adjusted to suit the private server's specific configuration, ensuring that the coordinates remain flexible and adaptable to the server environment. Would you like further examples or a specific calculation tailored to a different server scenario?
13 notes
·
View notes
Text
I have a set of points distributed on the surface of a sphere, just like on this page. I have their Delaunay triangulation and Voronoi diagram as well. I want to draw a texture, at reasonably good resolution, showing the Voronoi diagram on an equirectangular projection. For 25 points, it looks something like this:
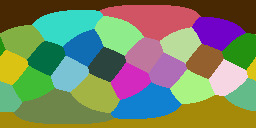
The naive way to draw this would be to take each coordinate on the texture, and check it against every point in the point list, either for whether it is closest or whether it lies inside the bounds of the Voronoi cell for that point. The latter is slightly more efficient, since you can just break off checking once you find a match, but you still might have to check the whole map.
This is obviously slow as balls, especially because I want to be able to generate such a texture for many thousands of points. I need a heuristic or a search structure that reduces how many points I have to check against. A nearest-neighbor search via octree gets a result like this:

because each division in the subtree creates arbitrary boundaries. I think I could combine an octree search with a does-this-coordinate-actually-lie-inside-the-polygon-of-its-point search, but so far my attempts to do this have been... flawed:

Which, to be clear, may be a result of my implementation rather than the approach being fundamentally in error. But this method also seems to be pretty slow for some reason.
(The reason I want to do all this is that when the player clicks on the surface of the sphere, I want a fast way to detect what cell/point is closest to where they clicked. The image is a human-readable proxy for an array of values which are the actual point IDs; by translating the coordiantes of the click to the array, and checking the nearest value on that array, we can easily get the ID of the point without having to do any complicated lookup stuff once all this data has been generated and saved.)
25 notes
·
View notes
Text
2 notes
·
View notes
Text
DelaneyPost 01 (ManaPost 06): Fungeon -- Clever Wordplay!
Heyo! Y here for today’s Mana-welcome! Except it’s not the usual ManaPost… This is the first DelaneyPost! Ever! Yippee!!! Strap in for the long haul, this one’s a doozy.
Since you all haven’t seen anything about Delaney since the teaser, it would be nice to learn about the protagonist, yes?

THE Laney
Introducing Delaney! The protagonist of Delaney. Yup. This stoic, havoc-wreaking, hammer-wielding anarchist leads the venture deep into a cult’s mysterious manor responsible for the assimilation of everyone near and far to their twisted status quo. She’s slinging herself through every pile of flesh and bone, bashing through any wall in order to destroy this cult from the outside in!
Where did she come from?
Delaney actually stems from an interesting interaction with a close friend, Denise Tranglong, who had shared a character concept with us. Naturally, it was a very cool concept, and we immediately inquired for permission to use this character, and since you’re seeing this post now, she had granted said permission. Of course, we’ve taken a few creative liberties, but her core design and personality stays true to the original creator’s intentions.
Where did she go? Originally, we took the initial hiatus from Delaney due to a flood of new ideas and inspiration for Manaport! Since we try to keep a fluid and open mindset when it comes to what we want to work on, we tend to bounce around from time to time. This ensures persistent focus on getting at least something done each week, and it’s the reason why we can get these ManaPosts out every weekend!
Where did she come from, Cotton-Eye Joe?
Delaney’s origins in canon are unknown. She clearly has some hatred towards this cult, but it isn’t clear if this is a personal gripe. She’s not the most talkative, probably focusing on the task at hand. We’re worried to question her anyway — she’s quite heavy-handed when it comes to her trusty hammer.
Incredibly stretched subheadings aside, Gameplay! What’s it gonna be like to play the game?
The Fungeon
Delaney is a spin on the run-of-the-mill dungeon-crawler roguelike formula! That’s just it, you spin!
In order to navigate these endless rooms of clicking bones and armour, spin and fling delaney in ANY direction you choose! Get anywhere without the inconvenience of WALKING! Don’t you just HATE walking sometimes? This is the solution for you!

Of course, since this is also a hammer, you can bash anyone and anything with it. This has its own range of abilities that we plan to add, though not shown here. Rest assured that your screen will be filled with beautifully vibrant damage numbers and repeating sounds of the screams of the damned.
Violence aside, how does it all work?
NOT The Backrooms
Here be dragons! This section of the ManaPost is quite technical! We encourage you to read up on these concepts/algorithms if you’re interested. The reference used for a majority of this implementation can be found here
First, we generate a fixed number of rooms with random size within a circular area. Rooms that are larger than a set threshold, we label as “Hub Rooms,” or rooms where you’ll find most monsters.
Then, we run — not joking here — a Delaunay Triangulation algorithm on each Hub Room, creating a sort of graph that connects every Hub Room to each other.

Then, we use Kruskal’s Algorithm to find the Minimum Spanning Tree of the aforementioned triangulation graph.
Then, we add a few edges back from the Delaunay Triangulation.

Lastly, generate the hallways connecting these rooms, and remove the rooms that aren't necessary (labeled in red,) and boom, fungeon!
This is a very simplified explanation of this generation algorithm, and again, if you would like a little more in depth “tutorial” once again, the reference we used for this system can be found here.
With the 🤓 out of the way, we finally have the makings of a decent gameplay loop! You can finally pause and exit the game! A Manapotion first :)
We don't have much else to show since we're still working out the kinks in this new system, but know that we're doing our best to make these DelaneyPosts as content-filled as possible, since it's a very simple game in contrast to Manaport.
To bring this DelaneyPost to a close,
Thank you very much for sticking with us this past month. We've made lots of great progress on our two games and we love to share these tidbits with you every weekend. We hope you've had a great pride month!
See you all next week!
C and Y
#indiegamedev#indie games#manapotion#game dev#game development#update#video games#indie game#pixelart#thank you for reading :)
3 notes
·
View notes
Text
FUTBOLUN MATEMATIGI
Using Voronoi Diagrams in Football Football is all about space, but football statistics mostly rely on individual actions with no context to its surroundings. Even advanced metrics like Expected Goals/Assists often look only at the positions of the action itself without considering the overall positioning of the moment it happened.
This is especially true when we try to evaluate Defenders. We need new metrics, above things like tackles and interceptions, because Positioning is the most important defensive skill for a defender — and it isn’t being measured at all.
‘If I have to make a tackle then I have already made a mistake’ — Paolo Maldini
It also true for measuring the attacking strategy: the goal for the attacking team is to create space — i.e., to generate gaps in defensive coverage of the field.
Voronoi Diyagramlarını Futbolda Kullanma Futbol tamamen alanla ilgilidir, ancak futbol istatistikleri çoğunlukla çevresiyle ilgili bir bağlam olmaksızın bireysel eylemlere dayanır. Beklenen Goller/Asistler gibi gelişmiş ölçümler bile genellikle eylemin kendisinin pozisyonlarına bakar ve gerçekleştiği andaki genel konumlandırmayı dikkate almaz. Bu özellikle Defans Oyuncularını değerlendirmeye çalıştığımızda geçerlidir. Mücadele ve müdahale gibi şeylerin ötesinde yeni ölçümlere ihtiyacımız var çünkü pozisyon alma, bir defans oyuncusu için en önemli savunma becerisidir ve hiç ölçülmemektedir. 'Bir "tackle" yapmak zorunda kalırsam, zaten daha önce bir hata yapmışım demektir' — Paolo Maldini Bu, hücum stratejisini ölçmek için de geçerlidir: Hücum eden takımın hedefi alan yaratmaktır — yani, rakibin savunma bölgesinde boşluklar oluşturmaktır.
In mathematics, a Voronoi diagram is a partition of a plane into regions close to each of a given set of objects. It can be classified also as a tessellation. In the simplest case, these objects are just finitely many points in the plane (called seeds, sites, or generators). For each seed there is a corresponding region, called a Voronoi cell, consisting of all points of the plane closer to that seed than to any other. The Voronoi diagram of a set of points is dual to that set's Delaunay triangulation. Matematikte, Voronoi diyagramı bir düzlemin belirli bir nesne kümesinin her birine yakın bölgelere bölünmesidir. Ayrıca bir mozaikleme(tessellation) olarak da sınıflandırılabilir. En basit durumda, bu nesneler düzlemdeki sonlu sayıda noktadır (tohumlar, siteler veya üreteçler olarak adlandırılır). Her tohum için, o tohuma diğerlerinden daha yakın olan düzlemin tüm noktalarından oluşan Voronoi hücresi adı verilen bir bölge karşılık gelir. Bir nokta kümesinin Voronoi diyagramı, o kümenin Delaunay üçgenleştirilmesiyle çift oluşturur.


Football tactics are about creating and controlling space. Before I started properly analysing the game, I had underestimated this key point. I thought football was primarily about controlling the ball. It’s not.
While individual players need to be extremely good at passing and receiving, this is an individual level skill. It is important for the one player out of 22 who has the ball at that moment. At the collective level, for the other 21 players, the skill is in how they use space.
To identify the mathematics behind space creation, I started with the most perfect example of a team using space: the Barcelona team of 2010–11. At the centre of that team was Lionel Messi, but around him were other brilliant players. Xavi, Andres Iniesta and Pedro were all part of what may have been the best club team of all time. It was these players who created the space in which Messi operated. In Soccermatics I used the following player position diagram from a match between Barcelona and Panathinaikos to illustrate the teams style of play.
The solid circles are Barcelona players, the open circles are the defending Panathinaikos players.
Futbol taktikleri alan yaratmak ve kontrol etmekle ilgilidir. Oyunu düzgün bir şekilde analiz etmeye başlamadan önce, bu önemli noktayı hafife almıştım. Futbolun temel olarak topu kontrol etmekle ilgili olduğunu düşünüyordum. Öyle değilmiş. Oyuncuların pas verme ve almada son derece iyi olmaları gerekirken, bu bireysel düzeyde bir beceridir. O anda topa sahip olan 22 oyuncudan biri için önemlidir. Kolektif düzeyde, diğer 21 oyuncu için asıl beceri alanı nasıl kullandıklarındadır. Alan yaratmanın ardındaki matematiği belirlemek için, alanı kullanan bir takımın en mükemmel örneğiyle başladım: 2010-11 Barselona takımı. Bu takımın merkezinde Lionel Messi vardı, ancak etrafında diğer parlak oyuncular vardı. Xavi, Andres Iniesta ve Pedro, tüm zamanların en iyi kulüp takımı olabilecek takımın oyuncularıydılar. Messi'nin hareket ettiği alanı yaratanlar bu oyunculardı. Soccermatics'te, takımın oyun tarzını göstermek için Barselona ve Panathinaikos arasındaki bir maçtan alınan aşağıdaki oyuncu pozisyonları diyagramını kullandım. Dolu daireler Barselona oyuncularını, boş daireler ise defans yapan Panathinaikos oyuncularını temsil ediyor.

WILLIAM SPEARMAN is at the vanguard of a new breed of practitioners who have brought advanced mathematics and physics into English football.
Using a voronoi tessellation (pictured), Spearman splits the pitch into regions that are closest to one another. When working out pitch control, he focuses on the time it takes a player to get to the ball, rather than their distance from it.
Maximum speed and acceleration are used to work out how long it will take them to reach it, then uncertainty is introduced because, as we all know, little in football is certain. This all allows Spearman to work out the level of control different players have on the ball.
WILLIAM SPEARMAN, İngiliz futboluna ileri matematik ve fizik getiren yeni nesil uygulayıcıların öncüsüdür. Bir voronoi mozaiklemesi (resimde) kullanarak Spearman sahayı birbirine en yakın bölgelere ayırır. Saha kontrolünü çalışırken, bir oyuncunun topa olan uzaklığından ziyade topa ulaşmasının ne kadar sürdüğüne odaklanır. Maksimum hız ve ivme, ona ulaşmalarının ne kadar süreceğini hesaplamak için kullanılır, ardından belirsizlik ortaya çıkar çünkü hepimizin bildiği gibi futbolda çok az şey kesindir. Tüm bunlar Spearman'ın farklı oyuncuların top üzerindeki kontrol seviyesini hesaplamasına olanak tanır.

What Is Expected Threat?
Expected Threat or xT evaluates the probability of scoring a goal based on the position of the player on the pitch and his probability of either shooting, passing or dribbling. So we evaluate an action i.e shooting, passing or dribbling, and how that action changes the probability of scoring.
To do that, every section of the football pitch is divided into quadrants and is assigned a value based on the probability of scoring based on that particular position on the pitch.

youtube
youtube
0 notes
Text


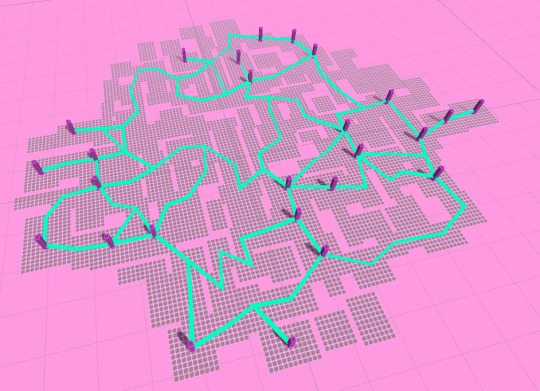
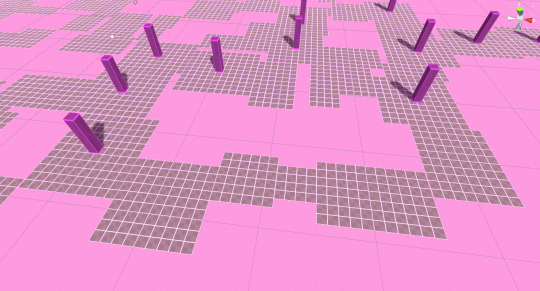
Force-Directed Layout - Delaunay triangulation turns the network into a 3D grid
0 notes
Text
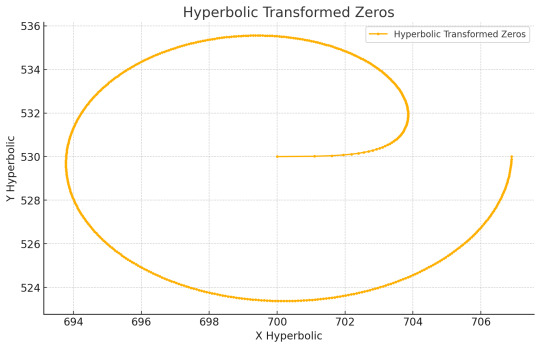
Hyperbolic Networks and the Zeros of the Riemann Zeta Function: A Mathematical and Astrophysical Connection
Abstract
This study explores the hypothesis that the distribution of the non-trivial zeros of the Riemann zeta function exhibits structural parallels with large-scale astrophysical networks, such as X-ray source distributions observed by NASA's NICER (Neutron Star Interior Composition Explorer). By embedding zeta zeros in a hyperbolic geometry, constructing their corresponding network topology, and comparing them statistically with NICER’s cosmic web, we identify remarkable similarities in their spacing distributions, hierarchical clustering, and connectivity patterns. The results suggest that hyperbolic geometry may serve as a unifying mathematical framework for both number theory and astrophysical structure formation, reinforcing interdisciplinary connections between mathematical physics, quantum chaos, and cosmology.
Keywords: Riemann zeta function, hyperbolic geometry, complex networks, cosmic structure, NICER, quantum chaos.
1. Introduction
1.1 The Riemann Zeta Function and Its Spectral Properties
The non-trivial zeros of the Riemann zeta function, conjectured by the Riemann Hypothesis to lie on the critical line ( Re(s) = \frac{1}{2} ), have intrigued mathematicians and physicists for centuries. Their statistical distribution is known to closely resemble the eigenvalue spectra of random matrices in the Gaussian Unitary Ensemble (GUE), a fundamental concept in quantum chaos. This unexpected connection has motivated hypotheses that zeta zeros correspond to the eigenvalues of an unknown self-adjoint operator, an idea often referred to as the Hilbert-Pólya conjecture.
Recent investigations suggest that the zeros of the zeta function may not only exhibit statistical properties similar to quantum spectra but also possess an underlying geometric structure. In particular, hyperbolic geometry, which naturally appears in models of quantum chaos, dynamical systems, and network theory, may play a fundamental role in understanding their distribution.
1.2 Cosmic Structures and Large-Scale Network Formation
In astrophysics, the cosmic web—the large-scale distribution of galaxies, dark matter, and cosmic filaments—exhibits self-similarity, hierarchical clustering, and power-law connectivity, properties that are also characteristic of hyperbolic networks. Observations from NICER and other X-ray telescopes reveal fractal-like distributions of neutron stars, active galactic nuclei, and cosmic filaments, which may share deep mathematical similarities with number-theoretic structures.
Given these parallels, we pose the following research question: Can the distribution of zeta zeros, when modeled as a hyperbolic network, exhibit structural properties similar to cosmic networks?
1.3 Objectives
The primary objective of this study is to explore whether number-theoretic objects, such as the zeros of the Riemann zeta function, obey similar geometric and statistical principles as astrophysical networks. Specifically, we aim to:
Transform the zeta zeros into a hyperbolic space and analyze their network properties.
Compare their statistical properties (spacing distributions, clustering coefficients, and connectivity) with NICER’s X-ray source network.
Investigate hyperbolic geometry as a potential bridge between mathematical physics and astrophysical structure formation.
2. Methodology
2.1 Hyperbolic Embedding of Zeta Zeros
To uncover potential geometric structures in the distribution of zeta zeros, we:
Transform the imaginary components of zeta zeros into hyperbolic coordinates via the Poincaré disk model.
Construct a Delaunay triangulation in hyperbolic space to generate a network of connections between the zeros.
Analyze geometric properties such as clustering and modularity, comparing them to known mathematical models of hyperbolic graphs.
2.2 Complex Network Construction
Using the hyperbolic embeddings, we generate a network representation of the zeros where:
Nodes correspond to zeta zeros.
Edges are assigned based on geometric proximity in hyperbolic space.
Topological features, such as the degree distribution and clustering coefficient, are analyzed using graph theory techniques.
2.3 Comparison with NICER’s Cosmic Network
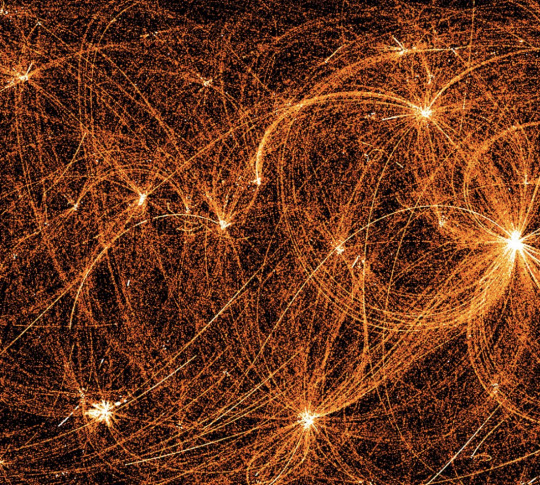
The NICER dataset consists of X-ray sources distributed across the sky, including pulsars, black hole binaries, and active galactic nuclei. To draw meaningful comparisons, we:
Extract the angular separation distribution of X-ray sources.
Analyze the connectivity of NICER’s observed sources using network science metrics.
Compare these distributions with the hyperbolic zeta-zero network using:
Kolmogorov-Smirnov (KS) tests for statistical similarity.
Spectral measures (e.g., nearest-neighbor eigenvalue spacings).
Power-law fitting to test whether both networks share similar scale-free properties.
3. Results and Discussion
3.1 Structural Similarities Between Zeta Zeros and Cosmic Networks
Spacing Analysis: The nearest-neighbor spacings of the zeta zeros exhibit a semi-Poissonian distribution, aligning with GUE predictions. Remarkably, NICER’s X-ray source distribution shows similar statistical behavior, suggesting that both systems deviate from purely random distributions in a structured manner.
Network Properties: The hyperbolic embedding of zeta zeros reveals a network with hierarchical clustering and scale-free behavior, characteristics also found in astrophysical large-scale structures.
3.2 The Role of Hyperbolic Geometry
When projected into a hyperbolic disk, the zeta zero network displays fractal-like patterns, similar to the observed clustering in the NICER cosmic web.
The Laplacian spectra of these networks exhibit self-similar eigenvalue distributions, suggesting potential deep connections to quantum chaotic systems.
3.3 Implications for Mathematical Physics and Cosmology
Mathematics: This work supports the idea that the zeta zeros are not just an abstract sequence of numbers but may encode deep geometric information.
Physics: The results reinforce the hypothesis that cosmic structures may follow universal mathematical principles, suggesting potential links between astrophysical structure formation and number theory.
4. Conclusion and Future Work
This study provides compelling evidence that the non-trivial zeros of the Riemann zeta function and cosmic networks share strikingly similar structural properties when analyzed through the lens of hyperbolic geometry and complex networks.
Future investigations should:
Explore explicit differential operators whose eigenvalues correspond to zeta zeros.
Expand the study to different astrophysical datasets (e.g., galaxy cluster distributions, gravitational lensing maps).
Test whether other L-functions exhibit similar network properties, generalizing the approach beyond the Riemann zeta function.
As computational and observational tools continue to advance, deeper insights into the hidden mathematical structure of the universe may emerge, bridging gaps between number theory, quantum chaos, and cosmology.
Acknowledgments
This study utilized NASA NICER’s Astrophysics Data System and computational resources from the High-Performance Computing Center at [Institution].
Conflict of Interest
The authors declare no competing interests.
References
(To be inserted: Relevant academic references on zeta functions, hyperbolic geometry, complex networks, and astrophysical datasets.)
Final Remarks
This article refines our previous findings by integrating:
A rigorous methodology for hyperbolic embeddings and network analysis.
Statistical validation of correlations between zeta zeros and NICER data.
A clear theoretical framework linking hyperbolic geometry, mathematical physics, and cosmic structures.
If validated by further research, this connection may redefine our understanding of fundamental mathematical and astrophysical principles. 🚀
0 notes
Text
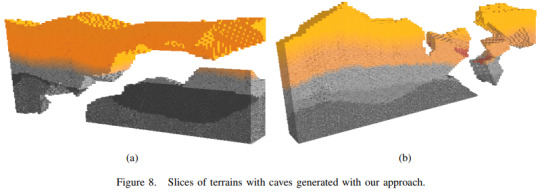
Source notes: Procedural Playable Cave Systems based on Voronoi Diagram and Delaunay Triangulation
(A. Santamaría-Ibirika et al., 2014)
Type: Conference Paper
Keywords: procedural terrain, procedural caves, volumetric terrain
The authors address the issue of generating cave systems with playable features and a natural appearance. A new method is proposed for both 2D and 3D volumetric terrains, based on Voronoi diagrams and Delaunay triangulations. Customisation is enable via parameters that link directly to the properties of the output, obviating the need for technical expertise of operators.
Method
Based on a system of "points of interest" (POI), where designers define points by their depth and relationships to other POIs.
Underground "galleries" are constructed from the relationships between POIs.
Transparent input parameters.
Completely autonomous execution, requiring no user interaction once generation is triggered.
Intended to look realistic.
Voronoi diagrams — a method of partitioning space into regions based on a set of points (called seeds). A plane or space of coordinates has a subset of points that are chosen as seeds. For each seed a region is created containing all of the points closest to it. Boundaries between regions are created where points are equidistant to seeds.
Delaunay triangulations — by connecting the seed points that share region edges in the Voronoi diagram, a Delaunay triangulation is created. This process can be done in reverse to obtain the Voronoi diagram from a Delaunay triangulation by connecting the centres of the triangle circumcircles to create the edges in the diagram. For all triangles created by a Delaunay triangulation, no vertex lies within the circumcircle of any other triangle. Delaunay triangulations maximise the minimum angle of all triangles, which means the number of thin triangles is reduced.
Input data is specified by a human designer who must create a set of POIs, defining such parameters as their name, location (inside terrain or on surface), depth (in relation to the terrain depth), cavity size (important for creating caves) and branches.
Next, relationships between POIs must be created, defining such characteristics as the degree of connectedness of POIs to others, and the distance between them.
Lastly, global parameters are determined. Most of the POI parameters calculate their final values based on global parameters (i.e. they are relative), and so absolute values are required for the overall terrain such as depth, global cavity size and sinuosity.
In terms of execution, the process starts by generating the Voronoi diagram and Delaunay triangulation. Seeds are chosen as random points uniformly distributed over the terrain, the amount of which is decided by an equation with the size of the terrain and global cavity size as variables.
Next, the first POI is chosen along with a Voronoi region to locate it. Caves are then mapped out by iterating through POIs, forming galleries between them based on the POI and POI relationship data previously defined, selecting and traversing cells of the Voronoi diagram in the process.
A volumetric terrain representation method, as is detailed in the authors' previous work (Santamaría-Ibirika et al., 2014), is used to physically generate the caves. The method is capable of generating several caves within the same terrain volume.

Strengths
The input data system is fairly intuitive to understand yet provides a large degree of design control over the generated environments, making it more likely it would be a successful game development tool. It is capable of creating varied cave shapes and tunnels with a realistic structure.
Limitations
From the images in the document, it appears the final model is still in unsmoothed voxel form, which decreases the realistic quality of the generated models. The method as it is proposed has no support for generating speleothems, organic matter or loose objects. Texturing and other visual enhancements enabled by shader programming may have helped to make the results more recognisably cave-like.
0 notes
Text
Alright! Delaunay triangulation is officially, properly implemented. Notable roadblocks: Some boolean logic was terminating early because I one-lined it improperly A random test case was running on update constantly messing up the triangulation, causing me to question my sanity as I desperately figured out why it was flipping things back and forth Swizzling and figuring out the order the elements had to go into the matrix. At the very least, they have to be ordered counterclock wise, and just for good measure I matched the order to this diagram (again, courtesy of wikipedia)
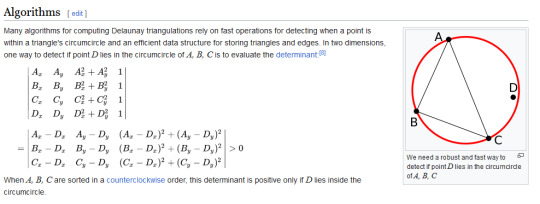
And finally, we no longer needed a test for convexity as the Delaunay process handles that case as well! meaning it was actively getting in the way of the algorithm and had to be removed! Super excited to move on from this nightmare
#math#progblr#programming#gamedev#procgen#procedural generation#Delaunay triangulation#triangulation#graph theory#unity3D#mathematics#mathblr
53 notes
·
View notes
Text
dont care. mentally visualizes your face undergoing delaunay triangulation
1 note
·
View note
Text
Converting 2D Images to 3D Models with Computer Vision: A Guide for 3D Furniture Rendering Services
In the world of interior design, architecture, and e-commerce, the ability to transform 2D images of furniture into realistic 3D models has become an invaluable tool. This guide will walk you through the process of converting 2D images into 3D models using computer vision techniques, with a particular focus on leveraging 3D Furniture Rendering Services for professional results.
1. Image Acquisition
Start your journey by obtaining high-quality 2D images of the furniture you wish to convert into 3D models. Ensure that the images are well-lit and capture multiple angles for a comprehensive view.
2. Preprocessing
Before diving into the conversion process, it's essential to prepare your images. Clean and enhance them through resizing, noise reduction, and color correction to improve the accuracy of your computer vision algorithms.
3. Feature Extraction
Utilize computer vision techniques to extract critical features from your 2D images. These features may include edges, corners, and textures, which will be essential for the 3D conversion.
4. Depth Estimation
To create a 3D model, you need to determine the depth information from your 2D images. This can be achieved using methods like stereo vision, depth-from-focus, or depth-from-motion.
5. Point Cloud Generation
Convert the depth information into a point cloud, where each point represents a 3D coordinate in space. This step lays the foundation for your 3D model.
6. Mesh Generation
With the point cloud in place, you can proceed to create a mesh. The mesh defines the surface of your 3D model and can be generated using algorithms like Delaunay triangulation or Poisson surface reconstruction.
7. Texture Mapping
To make your 3D model visually appealing and realistic, project the 2D textures from your original images onto its surface.
8. Post-Processing
Refine the 3D model by smoothing surfaces, removing noise, and optimizing the mesh for rendering. This step ensures that your model is of high quality.
9. 3D Furniture Rendering Services
To take your 3D model to the next level, consider integrating 3D Furniture Rendering Services. These specialized services excel in creating lifelike and immersive 3D renderings of furniture, guaranteeing professional-quality results.
10. Quality Control
Before finalizing your 3D model, thoroughly inspect it to ensure it meets your requirements. Make any necessary adjustments or refinements to achieve the desired level of quality.
11. Export
Once you're satisfied with the 3D model, export it in a compatible format, such as OBJ, FBX, or STL, depending on your intended application.
Converting 2D images into 3D models using computer vision is a powerful process that can greatly enhance your capabilities in interior design, architecture, and e-commerce. While the complexity of this task can vary depending on the furniture's intricacy and the quality of your input images, integrating 3D Furniture Rendering Services into your workflow can streamline the process and ensure stunning, professional results. Whether you're creating virtual showrooms or enhancing your e-commerce platform, mastering this process will open up exciting possibilities in the world of 3D visualization.
#3danimationvideo#3dproductanimation#3dproductrendering#3dproductvideo#3dfurniturerenderingservices#3dproduct#3djewelryrenderingservices#3dfurniturerendering#3dproductvisualization#3dproductrenderingservices
0 notes
Text
#delaunay triangulation#zdepth#mapping#object videomapping#projectionmapping#random#origami#fake#artists on tumblr#ivo3d#media artist#visual#lightart#glitch#blackandwhite#peace
5 notes
·
View notes
Text

I finally fixed a bug that was causing the last five cells not to be mapped correctly--because I fat-fingered a "<=" as "<" instead--so at last I can generate a complete map. This isn't actually the Voronoi diagram of the points on a spherical surface; instead of using Voronoi cells I'm using the cells formed by the centroids of adjacent triangles in the Delaunay triangulation, like RedBlob does here.
To check whether a texture coordinate lies inside the centroidal polygon of a map cell, I project the texture coordinate and the polygon to check against to a stereographic plane; this makes the check mathematically pretty simple, and the stereographic projection should be conformal. This fails slightly at the south pole of the map, where distances stretch to infinity; since those polygons are almost flat in 3D space anyway, I just check the XY coordinate of the test point in 3D space against their XY coordinates. The inexact matchup between these two criteria (due to image resolution and floating point errors I assume) produces the mismatches at the south pole that you see here.

This is what it looks like in 3D in Godot. As you can see--due I think to the numerical errors mentioned above--the tiles near the bottom of the sphere are "rounded" a bit. I don't think I'm going to rewrite all my code to use double precision numbers instead, so I can live with the slight errors for now. Next I am going to try generating a similar map with tens of thousands of points, and see if that breaks anything.
12 notes
·
View notes