#Grafana and Real-time Monitoring
Explore tagged Tumblr posts
Visit Tumblr Blog
Explore Tumblr blogs with no restrictions, modern design and the best experience.
Last Seen Tumblr Blogs


Fun Fact
Forty percent of Tumblr users are between the ages of 18 to 25.
Text
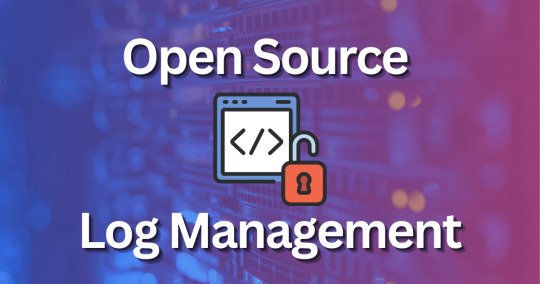
Best Open Source Log Management Tools in 2023
Best Open Source Log Management Tools in 2023 #homelab #OpenSourceLogManagement2023 #TopLogAnalysisTools #CentralizedLoggingSystems #LogstashVsSyslogng #BestLogCollectors #FluentDAndCloudServices #ManageLargeVolumesOfLogData #GrafanaRealtimeMonitoring
When monitoring, troubleshooting, and auditing in today’s IT infrastructure, logs provide the low-level messaging needed to trace down events happening in the environment. They can be an invaluable source of insights into performance, security events, and errors that may be occurring across on-premises, cloud, and hybrid systems. You don’t have to buy into a commercial solution to get started…
View On WordPress
#Best Log Collectors#Centralized Logging Systems#Efficient Log Data Visualization#FluentD and Cloud Services#Grafana and Real-time Monitoring#Logstash vs. Syslog-ng#Manage Large Volumes of Log Data#Open Source Log Management Solutions 2023#Secure Log Data Transfer#Top Log Analysis Tools
0 notes
Text
Unlocking SRE Success: Roles and Responsibilities That Matter
In today’s digitally driven world, ensuring the reliability and performance of applications and systems is more critical than ever. This is where Site Reliability Engineering (SRE) plays a pivotal role. Originally developed by Google, SRE is a modern approach to IT operations that focuses strongly on automation, scalability, and reliability.

But what exactly do SREs do? Let’s explore the key roles and responsibilities of a Site Reliability Engineer and how they drive reliability, performance, and efficiency in modern IT environments.
🔹 What is a Site Reliability Engineer (SRE)?
A Site Reliability Engineer is a professional who applies software engineering principles to system administration and operations tasks. The main goal is to build scalable and highly reliable systems that function smoothly even during high demand or failure scenarios.
🔹 Core SRE Roles
SREs act as a bridge between development and operations teams. Their core responsibilities are usually grouped under these key roles:
1. Reliability Advocate
Ensures high availability and performance of services
Implements Service Level Objectives (SLOs), Service Level Indicators (SLIs), and Service Level Agreements (SLAs)
Identifies and removes reliability bottlenecks
2. Automation Engineer
Automates repetitive manual tasks using tools and scripts
Builds CI/CD pipelines for smoother deployments
Reduces human error and increases deployment speed
3. Monitoring & Observability Expert
Sets up real-time monitoring tools like Prometheus, Grafana, and Datadog
Implements logging, tracing, and alerting systems
Proactively detects issues before they impact users
4. Incident Responder
Handles outages and critical incidents
Leads root cause analysis (RCA) and postmortems
Builds incident playbooks for faster recovery
5. Performance Optimizer
Analyzes system performance metrics
Conducts load and stress testing
Optimizes infrastructure for cost and performance
6. Security and Compliance Enforcer
Implements security best practices in infrastructure
Ensures compliance with industry standards (e.g., ISO, GDPR)
Coordinates with security teams for audits and risk management
7. Capacity Planner
Forecasts traffic and resource needs
Plans for scaling infrastructure ahead of demand
Uses tools for autoscaling and load balancing
🔹 Day-to-Day Responsibilities of an SRE
Here are some common tasks SREs handle daily:
Deploying code with zero downtime
Troubleshooting production issues
Writing automation scripts to streamline operations
Reviewing infrastructure changes
Managing Kubernetes clusters or cloud services (AWS, GCP, Azure)
Performing system upgrades and patches
Running game days or chaos engineering practices to test resilience
🔹 Tools & Technologies Commonly Used by SREs
Monitoring: Prometheus, Grafana, ELK Stack, Datadog
Automation: Terraform, Ansible, Chef, Puppet
CI/CD: Jenkins, GitLab CI, ArgoCD
Containers & Orchestration: Docker, Kubernetes
Cloud Platforms: AWS, Google Cloud, Microsoft Azure
Incident Management: PagerDuty, Opsgenie, VictorOps
🔹 Why SRE Matters for Modern Businesses
Reduces system downtime and increases user satisfaction
Improves deployment speed without compromising reliability
Enables proactive problem solving through observability
Bridges the gap between developers and operations
Drives cost-effective scaling and infrastructure optimization
🔹 Final Thoughts
Site Reliability Engineering roles and responsibilities are more than just monitoring systems—it’s about building a resilient, scalable, and efficient infrastructure that keeps digital services running smoothly. With a blend of coding, systems knowledge, and problem-solving skills, SREs play a crucial role in modern DevOps and cloud-native environments.
📥 Click Here: Site Reliability Engineering certification training program
0 notes
Text
Integrating DevOps into Full Stack Development: Best Practices
In today’s fast-paced software landscape, seamless collaboration between development and operations teams has become more crucial than ever. This is where DevOps—a combination of development and operations—plays a pivotal role. And when combined with Full Stack Development, the outcome is robust, scalable, and high-performing applications delivered faster and more efficiently. This article delves into the best practices of integrating DevOps into full stack development, with insights beneficial to aspiring developers, especially those pursuing a Java certification course in Pune or exploring the top institute for full stack training Pune has to offer.
Why DevOps + Full Stack Development?
Full stack developers are already versatile professionals who handle both frontend and backend technologies. When DevOps principles are introduced into their workflow, developers can not only build applications but also automate, deploy, test, and monitor them in real-time environments.
The integration leads to:
Accelerated development cycles
Better collaboration between teams
Improved code quality through continuous testing
Faster deployment and quicker feedback loops
Enhanced ability to detect and fix issues early
Whether you’re currently enrolled in a Java full stack course in Pune or seeking advanced training, learning how to blend DevOps into your stack can drastically improve your market readiness.
Best Practices for Integrating DevOps into Full Stack Development
1. Adopt a Collaborative Culture
At the heart of DevOps lies a culture of collaboration. Encourage transparent communication between developers, testers, and operations teams.
Use shared tools like Slack, JIRA, or Microsoft Teams
Promote regular standups and cross-functional meetings
Adopt a “you build it, you run it” mindset
This is one of the key principles taught in many practical courses like the Java certification course in Pune, which includes team-based projects and CI/CD tools.
2. Automate Everything Possible
Automation is the backbone of DevOps. Full stack developers should focus on automating:
Code integration (CI)
Testing pipelines
Infrastructure provisioning
Deployment (CD)
Popular tools like Jenkins, GitHub Actions, Ansible, and Docker are essential for building automation workflows. Students at the top institute for full stack training Pune benefit from hands-on experience with these tools, often as part of real-world simulations.
3. Implement CI/CD Pipelines
Continuous Integration and Continuous Deployment (CI/CD) are vital to delivering features quickly and efficiently.
CI ensures that every code commit is tested and integrated automatically.
CD allows that tested code to be pushed to staging or production without manual intervention.
To master this, it’s important to understand containerization and orchestration using tools like Docker and Kubernetes, which are increasingly incorporated into advanced full stack and Java certification programs in Pune.
4. Monitor and Log Everything
Post-deployment monitoring helps track application health and usage, essential for issue resolution and optimization.
Use tools like Prometheus, Grafana, or New Relic
Set up automated alerts for anomalies
Track user behavior and system performance
Developers who understand how to integrate logging and monitoring into the application lifecycle are always a step ahead.
5. Security from Day One (DevSecOps)
With rising security threats, integrating security into every step of development is non-negotiable.
Use static code analysis tools like SonarQube
Implement vulnerability scanners for dependencies
Ensure role-based access controls and audit trails
In reputed institutions like the top institute for full stack training Pune, security best practices are introduced early on, emphasizing secure coding habits.
6. Containerization & Microservices
Containers allow applications to be deployed consistently across environments, making DevOps easier and more effective.
Docker is essential for building lightweight, portable application environments
Kubernetes can help scale and manage containerized applications
Learning microservices architecture also enables developers to build flexible, decoupled systems. These concepts are now a key part of modern Java certification courses in Pune due to their growing demand in enterprise environments.
Key Benefits for Full Stack Developers
Integrating DevOps into your full stack development practice offers several professional advantages:
Faster project turnaround times
Higher confidence in deployment cycles
Improved teamwork and communication skills
Broader technical capabilities
Better career prospects and higher salaries
Whether you’re a beginner or transitioning from a single-stack background, understanding how DevOps and full stack development intersect can be a game-changer. Pune, as a growing IT hub, is home to numerous institutes offering specialized programs that include both full stack development and DevOps skills, with many students opting for comprehensive options like a Java certification course in Pune.
Conclusion
The fusion of DevOps and full stack development is no longer just a trend—it’s a necessity. As businesses aim for agility and innovation, professionals equipped with this combined skillset will continue to be in high demand.
If you are considering upskilling, look for the top institute for full stack training Pune offers—especially ones that integrate DevOps concepts into their curriculum. Courses that cover core programming, real-time project deployment, CI/CD, and cloud technologies—like a well-structured Java certification course in Pune—can prepare you to become a complete developer who is future-ready.
Ready to take your skills to the next level?
Explore a training institute that not only teaches you to build applications but also deploys them the DevOps way.
0 notes
Text
DevOps Course Online for Beginners and Professionals
Introduction: Why DevOps Skills Matter Today
In today's fast-paced digital world, businesses rely on faster software delivery and reliable systems. DevOps, short for Development and Operations, offers a practical solution to achieve this. It’s no longer just a trend; it’s a necessity for IT teams across all industries. From startups to enterprise giants, organizations are actively seeking professionals with strong DevOps skills.
Whether you're a beginner exploring career opportunities in IT or a seasoned professional looking to upskill, DevOps training online is your gateway to success. In this blog, we’ll walk you through everything you need to know about enrolling in a DevOps course online, from fundamentals to tools, certifications, and job placements.
What Is DevOps?
Definition and Core Principles
DevOps is a cultural and technical movement that unites software development and IT operations. It aims to shorten the software development lifecycle, ensuring faster delivery and higher-quality applications.
Core principles include:
Automation: Minimizing manual processes through scripting and tools
Continuous Integration/Continuous Deployment (CI/CD): Rapid code integration and release
Collaboration: Breaking down silos between dev, QA, and ops
Monitoring: Constant tracking of application performance and system health
These practices help businesses innovate faster and respond quickly to customer needs.
Why Choose a DevOps Course Online?
Accessibility and Flexibility
With DevOps training online, learners can access material anytime, anywhere. Whether you're working full-time or managing other responsibilities, online learning offers flexibility.
Updated Curriculum
A high-quality DevOps online course includes the latest tools and techniques used in the industry today, such as:
Jenkins
Docker
Kubernetes
Git and GitHub
Terraform
Ansible
Prometheus and Grafana
You get hands-on experience using real-world DevOps automation tools, making your learning practical and job-ready.
Job-Focused Learning
Courses that offer DevOps training with placement often include resume building, mock interviews, and one-on-one mentoring, equipping you with everything you need to land a job.
Who Should Enroll in a DevOps Online Course?
DevOps training is suitable for:
Freshers looking to start a tech career
System admins upgrading their skills
Software developers wanting to automate and deploy faster
IT professionals interested in cloud and infrastructure management
If you're curious about modern IT processes and enjoy problem-solving, DevOps is for you.
What You’ll Learn in a DevOps Training Program
1. Introduction to DevOps Concepts
DevOps lifecycle
Agile and Scrum methodologies
Collaboration between development and operations teams
2. Version Control Using Git
Git basics and repository setup
Branching, merging, and pull requests
Integrating Git with DevOps pipelines
3. CI/CD with Jenkins
Pipeline creation
Integration with Git
Automating builds and test cases
4. Containerization with Docker
Creating Docker images and containers
Docker Compose and registries
Real-time deployment examples
5. Orchestration with Kubernetes
Cluster architecture
Pods, services, and deployments
Scaling and rolling updates
6. Configuration Management with Ansible
Writing playbooks
Managing inventories
Automating infrastructure setup
7. Infrastructure as Code with Terraform
Deploying cloud resources
Writing reusable modules
State management and versioning
8. Monitoring and Logging
Using Prometheus and Grafana
Alerts and dashboards
Log management practices
This hands-on approach ensures learners are not just reading slides but working with real tools.
Real-World Projects You’ll Build
A good DevOps training and certification program includes projects like:
CI/CD pipeline from scratch
Deploying a containerized application on Kubernetes
Infrastructure provisioning on AWS or Azure using Terraform
Monitoring systems with Prometheus and Grafana
These projects simulate real-world problems, boosting both your confidence and your resume.
The Value of DevOps Certification
Why It Matters
Certification adds credibility to your skills and shows employers you're job-ready. A DevOps certification can be a powerful tool when applying for roles such as:
DevOps Engineer
Site Reliability Engineer (SRE)
Build & Release Engineer
Automation Engineer
Cloud DevOps Engineer
Courses that include DevOps training and placement also support your job search with interview preparation and job referrals.
Career Opportunities and Salary Trends
High Demand, High Pay
According to industry reports, DevOps engineers are among the highest-paid roles in IT. Average salaries range from $90,000 to $140,000 annually, depending on experience and region.
Industries hiring DevOps professionals include:
Healthcare
Finance
E-commerce
Telecommunications
Software as a Service (SaaS)
With the right DevOps bootcamp online, you’ll be prepared to meet these opportunities head-on.
Step-by-Step Guide to Getting Started
Step 1: Assess Your Current Skill Level
Understand your background. If you're a beginner, start with fundamentals. Professionals can skip ahead to advanced modules.
Step 2: Choose the Right DevOps Online Course
Look for these features:
Structured curriculum
Hands-on labs
Real-world projects
Mentorship
DevOps training with placement support
Step 3: Build a Portfolio
Document your projects on GitHub to show potential employers your work.
Step 4: Get Certified
Choose a respected DevOps certification to validate your skills.
Step 5: Apply for Jobs
Use placement support services or apply directly. Showcase your portfolio and certifications confidently.
Common DevOps Tools You’ll Master
Tool
Use Case
Git
Source control and version tracking
Jenkins
CI/CD pipeline automation
Docker
Application containerization
Kubernetes
Container orchestration
Terraform
Infrastructure as Code
Ansible
Configuration management
Prometheus
Monitoring and alerting
Grafana
Dashboard creation for system metrics
Mastering these DevOps automation tools equips you to handle end-to-end automation pipelines in real-world environments.
Why H2K Infosys for DevOps Training?
H2K Infosys offers one of the best DevOps training online programs with:
Expert-led sessions
Practical labs and tools
Real-world projects
Resume building and interview support
DevOps training with placement assistance
Their courses are designed to help both beginners and professionals transition into high-paying roles smoothly.
Key Takeaways
DevOps combines development and operations for faster, reliable software delivery
Online courses offer flexible, hands-on learning with real-world tools
A DevOps course online is ideal for career starters and upskillers alike
Real projects, certifications, and placement support boost job readiness
DevOps is one of the most in-demand and well-paying IT domains today
Conclusion
Ready to build a future-proof career in tech? Enroll in H2K Infosys’ DevOps course online for hands-on training, real-world projects, and career-focused support. Learn the tools that top companies use and get placement-ready today.
#devops training#devops training online#devops online training#devops training and certification#devops training with placement#devops online course#best devops training online#devops training and placement#devops course online#devops bootcamp online#DevOps automation tools
0 notes
Text
Data Analytics for IoT: Unlocking the Power of Connected Intelligence
In today’s hyper-connected world, the Internet of Things (IoT) is reshaping how industries, cities, and consumers interact with the environment. From smart homes to connected factories, IoT devices are generating massive volumes of data every second. But raw data, on its own, holds little value unless transformed into actionable insights — and that’s where data analytics for IoT becomes essential.
What is Data Analytics for IoT?
Data analytics for IoT refers to the process of collecting, processing, and analyzing data generated by interconnected devices (sensors, machines, wearables, etc.) to extract meaningful insights. These analytics can help improve decision-making, automate operations, and enhance user experiences across sectors like healthcare, manufacturing, agriculture, transportation, and more.
IoT data analytics can be categorized into four main types:
Descriptive Analytics – What happened?
Diagnostic Analytics – Why did it happen?
Predictive Analytics – What is likely to happen?
Prescriptive Analytics – What should be done about it?
Why is IoT Data Analytics Important?
As the number of IoT devices is expected to surpass 30 billion by 2030, businesses need robust analytics systems to handle the massive influx of data. Here’s why IoT analytics is critical:
Operational Efficiency: Identify bottlenecks, monitor machine performance, and reduce downtime.
Predictive Maintenance: Avoid costly failures by predicting issues before they occur.
Real-Time Decision Making: Monitor systems and processes in real-time for quick responses.
Customer Insights: Understand usage patterns and improve product design or customer service.
Sustainability: Optimize energy usage and reduce waste through smart resource management.
Key Technologies Powering IoT Data Analytics
To extract valuable insights, several technologies work hand-in-hand with IoT analytics:
Big Data Platforms: Tools like Hadoop, Apache Spark, and cloud storage solutions manage vast data sets.
Edge Computing: Analyzing data closer to where it’s generated to reduce latency and bandwidth.
Artificial Intelligence & Machine Learning (AI/ML): Automating pattern detection, anomaly identification, and forecasting.
Cloud Computing: Scalable infrastructure for storing and analyzing IoT data across multiple devices.
Data Visualization Tools: Platforms like Tableau, Power BI, and Grafana help interpret complex data for decision-makers.
Applications of Data Analytics in IoT
1. Smart Manufacturing
IoT sensors monitor production lines and machinery in real-time. Data analytics helps detect inefficiencies, forecast equipment failures, and optimize supply chains.
2. Healthcare
Wearables and smart medical devices generate health data. Analytics tools help doctors track patient vitals remotely and predict health risks.
3. Smart Cities
Cities use IoT analytics to manage traffic, reduce pollution, optimize energy usage, and improve public safety through connected infrastructure.
4. Agriculture
Smart farming tools monitor soil moisture, weather, and crop health. Farmers use analytics to increase yield and manage resources efficiently.
5. Retail
IoT data from shelves, RFID tags, and customer devices helps track inventory, understand consumer behavior, and personalize shopping experiences.
Challenges in IoT Data Analytics
Despite its benefits, there are significant challenges to consider:
Data Privacy and Security: IoT data is sensitive and prone to breaches.
Data Volume and Velocity: Managing the massive scale of real-time data is complex.
Interoperability: Devices from different manufacturers often lack standard protocols.
Scalability: Analytics systems must evolve as the number of devices grows.
Latency: Real-time processing demands low-latency infrastructure.
The Future of IoT Analytics
The future of IoT data analytics lies in autonomous systems, AI-driven automation, and decentralized processing. Technologies like 5G, blockchain, and advanced AI models will further empower real-time, secure, and scalable analytics solutions. Businesses that harness these advancements will gain a strategic edge in innovation and efficiency.
Conclusion
As IoT devices continue to infiltrate every corner of our world, data analytics will serve as the backbone that turns their data into actionable intelligence. Whether it's a smart thermostat learning your habits or an industrial robot flagging maintenance issues before breakdown, the fusion of IoT and analytics is transforming how we live, work, and think.
Organizations that invest in IoT data analytics today are not just staying competitive — they’re shaping the intelligent, connected future.
0 notes
Text
Boost Your IT Career with a DevOps Course in Bangalore
As organizations rapidly adopt agile methodologies and cloud technologies, DevOps has become an essential practice in modern software development. Companies across industries are looking for professionals who can bridge the gap between development and operations. If you want to gain in-demand skills and secure a promising job in tech, enrolling in a DevOps course in Bangalore is a strategic move.
Why Bangalore Is the Ideal Destination for DevOps Training
Bangalore, often referred to as the Silicon Valley of India, is home to countless startups, IT giants, and cloud service providers. This makes the city a thriving ecosystem for tech education and innovation. Choosing a DevOps course in Bangalore gives you access to industry-experienced trainers, hands-on labs, and a network of professionals and employers.
Whether you are a fresher looking to build a solid foundation or a working professional aiming to upskill, Bangalore offers unmatched resources and opportunities to advance your career in DevOps.
What You’ll Learn in a DevOps Course
A well-structured DevOps course in Bangalore equips learners with the knowledge and tools required to implement DevOps practices in real-world environments. The course typically covers:
Introduction to DevOps Culture and Principles
Continuous Integration and Continuous Deployment (CI/CD)
Configuration Management with tools like Ansible, Puppet, or Chef
Containerization with Docker and orchestration using Kubernetes
Source Code Management with Git and GitHub
Monitoring and Logging using tools like Prometheus, Grafana, and ELK stack
Real-time projects and cloud-based deployment
Training programs are usually designed to include hands-on labs that simulate real business scenarios, allowing learners to gain practical experience.
Career Opportunities and Industry Demand
Completing a DevOps course in Bangalore opens doors to high-demand roles such as DevOps Engineer, Release Manager, Automation Engineer, and Site Reliability Engineer (SRE). These roles are crucial for ensuring fast, efficient, and reliable software delivery in modern enterprises.
DevOps professionals are among the highest-paid in the IT industry. Bangalore’s vibrant tech ecosystem offers a wealth of job opportunities in both large MNCs and fast-growing startups, making it an ideal location to launch or enhance your DevOps career.
Choosing the Right DevOps Training Institute
To get the best results from your training, it's important to choose the right DevOps course in Bangalore. Consider these factors:
Expert Faculty: Trainers should have real-world experience and industry certifications.
Comprehensive Curriculum: Ensure the syllabus covers key DevOps tools and practices.
Hands-On Projects: Practical training is essential to apply your knowledge effectively.
Certifications: Look for courses that prepare you for certifications like Docker, Kubernetes, and AWS DevOps.
Placement Support: Institutes with job assistance services can help you connect with top employers.
Conclusion
A DevOps course in Bangalore https://www.apponix.com/devops-certification/devops-training-institutes-in-bangalore.html provides the technical skills and practical experience needed to thrive in today’s software-driven world. With high-paying roles, strong job growth, and a tech-friendly environment, Bangalore is the perfect city to build your DevOps career. Whether you’re entering the IT field or upgrading your skills, DevOps training is a valuable investment in your future.
0 notes
Text
Unlock Infrastructure Mastery: Join the Prometheus MasterClass for Monitoring & Alerting

If you've ever tried to troubleshoot a slow-loading website, debug a crashing server, or simply wanted more insight into what your system is doing behind the scenes — then monitoring and alerting are already on your radar. But here’s the deal: traditional monitoring tools often leave you juggling incomplete data, clunky dashboards, and alerts that scream, “Something’s wrong!” without telling you what, where, or why.
That’s where Prometheus comes in — and more importantly, where the Prometheus MasterClass: Infra Monitoring & Alerting! becomes your ultimate ally.
Whether you're a DevOps engineer, a system administrator, or just an aspiring tech pro, this course can be your game-changer for mastering infrastructure visibility, real-time alerting, and proactive problem-solving.
Let’s dive into why Prometheus is so powerful, what you’ll learn in this masterclass, and how it sets you on a path to dominate infrastructure monitoring like a pro.
Why Infrastructure Monitoring Matters — A Lot
Let’s break it down.
Infrastructure monitoring is like the health tracker for your digital ecosystem. It tells you how your servers, containers, databases, and applications are doing — whether they’re healthy or if they’re about to explode in a flurry of errors.
Think of it like this:
No monitoring? You're driving blindfolded.
Poor monitoring? You’re guessing where the potholes are.
Great monitoring with Prometheus? You're getting real-time traffic alerts, weather updates, and predictive insights to avoid crashes before they happen.
The problem? Setting all this up isn’t always plug-and-play — unless you're learning from a guided course like the Prometheus MasterClass: Infra Monitoring & Alerting!
Meet Prometheus – Your New Monitoring Power Tool
Prometheus is an open-source monitoring and alerting toolkit designed for reliability, performance, and flexibility. Originally developed by SoundCloud, it has since become a CNCF project (Cloud Native Computing Foundation) and a favorite in the DevOps and cloud-native world.
What makes it a rockstar?
✅ Time-series database – stores metrics efficiently ✅ Flexible query language (PromQL) – get exactly what you want ✅ Pull-based architecture – better control and reliability ✅ Built-in alert manager – integrated and customizable alerts ✅ Integration with Grafana – gorgeous dashboards in minutes ✅ Massive community support – plenty of exporters and documentation
If you're working with Kubernetes, Docker, AWS, GCP, or even legacy servers — Prometheus can slide into your stack seamlessly.
But understanding how to actually use Prometheus effectively? That’s a skill.
What You'll Learn in the Prometheus MasterClass
Now let’s talk about the Prometheus MasterClass: Infra Monitoring & Alerting!, because this isn’t just a “read the docs” kind of learning experience.
This course was crafted with both beginners and intermediate learners in mind. It’s hands-on, example-driven, and refreshingly easy to follow — no overwhelming theory, just clear, actionable learning.
Here’s what you’ll walk away with:
🔍 Understanding Metrics and Monitoring Essentials
Difference between monitoring, observability, and alerting
Types of metrics: gauge, counter, histogram, summary
Designing your monitoring strategy
⚙️ Installing and Setting Up Prometheus
How to install Prometheus on Linux and Windows systems
Navigating the configuration file (prometheus.yml)
Setting up node exporters, cAdvisor, and blackbox exporters
📈 Visualizing Metrics with Grafana
Connecting Prometheus with Grafana
Creating custom dashboards and panels
Using variables, annotations, and templating
📡 Collecting and Querying Metrics
Writing PromQL queries like a pro
Building advanced queries for insights
Getting data from third-party services
🚨 Setting Up Alerts That Actually Work
Configuring alert rules and conditions
Using Alertmanager to manage notifications
Integrating Slack, email, and other services
🛠️ Real-World Scenarios and Use Cases
Monitoring CPU, memory, and disk I/O
Detecting and responding to application crashes
Setting thresholds and predictive alerts
Analyzing service availability and response times
☁️ Bonus: Cloud + Kubernetes Monitoring
Kubernetes cluster monitoring with Prometheus
Service discovery and scraping from pods
Best practices for cloud-native environments
The best part? Every lesson is designed to be practical. You’ll be spinning up Prometheus instances, writing queries, and building dashboards right alongside the instructor.
Who Should Take This Course?
This MasterClass is perfect for:
🧠 System administrators tired of jumping between logs and guesswork
💼 DevOps professionals looking to sharpen their monitoring toolset
🌱 Cloud engineers who want visibility across dynamic infrastructures
💻 Developers interested in app performance and availability
🎯 Career switchers or students learning modern DevOps skills
Even if you’ve never touched Prometheus before, the course takes you step-by-step. And if you have used it casually? It’ll take your knowledge to the next level.
Why This Course Beats Random Tutorials
You might be thinking — can’t I just watch YouTube videos or read blog posts?
Sure. You can — but here’s why this MasterClass is a better investment of your time:
🔁 Structured Learning – Each lesson builds on the last 🎯 Focused Content – No fluff, just what works in real environments 🙋 Hands-On Practice – Real scenarios, live configurations 📚 Lifetime Access – Revisit any lesson, anytime 🧑🏫 Expert Guidance – Learn from an instructor with real-world experience 📈 Career-Boosting Value – Add it to your resume, your GitHub, your confidence
And yes — once you enroll in the Prometheus MasterClass: Infra Monitoring & Alerting!, you’ll gain full access to everything, including updates, resources, and community support.
Real Results: What Others Are Saying
💬 "I went from not knowing what a time-series metric was to building real dashboards for my team." 💬 "The best Prometheus learning resource I’ve ever used. Well-structured and practical." 💬 "I finally understand PromQL. The instructor makes it so clear!" 💬 "After this course, I set up alerting that saved us from a major outage last week."
There’s a reason this course is gaining momentum — because it works.
The Future is Observable — Don’t Stay in the Dark
Modern infrastructure is fast, dynamic, and complex. The days of hoping your app works fine in production are long gone. You need visibility, insights, and the power to act fast.
That’s exactly what Prometheus offers — and what this course teaches you to harness.
The Prometheus MasterClass: Infra Monitoring & Alerting! is your opportunity to master one of the most in-demand tools in modern DevOps. Whether you’re upgrading your skills or future-proofing your career — this is the place to start.
Ready to Take Control of Your Infrastructure?
Enroll now in the Prometheus MasterClass: Infra Monitoring & Alerting! and take the first step toward becoming the go-to monitoring expert in your team.
👉 No guesswork. 👉 No overwhelm. 👉 Just clean, clear, confident infrastructure management.
0 notes
Text

Integrating ARMxy SBC with InfluxDB for Time-Series Monitoring
In the world of Industrial IoT (IIoT), the ability to efficiently monitor, store, and analyze large volumes of time-stamped data is essential. From environmental sensors in smart factories to energy meters in power systems, time-series data forms the backbone of real-time insight and historical analysis.
InfluxDB, an open-source time-series database, is designed specifically for these use cases. Combined with the industrial-grade ARMxy Edge Gateway, it creates a robust edge solution for reliable data acquisition, storage, and visualization—all without depending on cloud availability.
🧠 Why InfluxDB on ARMxy?
InfluxDB is lightweight, high-performance, and optimized for time-series workloads. It supports powerful query languages, retention policies, and integrations with monitoring tools such as Grafana. When deployed directly on an ARMxy (RK3568J/RK3568B2) gateway, it becomes a local data engine with key advantages:
Minimal latency: Store and query data at the edge
Offline reliability: Operate without cloud or internet connection
Flexible integration: Compatible with Modbus, OPC UA, MQTT, and more
🏭 Real-World Use Case Example
Imagine a factory floor with multiple PLCs controlling machinery. Each PLC sends temperature, vibration, and power consumption data every few seconds. Instead of sending that data to a remote server, it can be ingested directly into InfluxDB running on the ARMxy device.
You can then use:
Telegraf for parsing and collecting metrics
Grafana for local visualization dashboards
Node-RED to add logic and alarms
The result? A self-contained edge monitoring system capable of showing trends, detecting anomalies, and buffering data even during connectivity drops.
🔗 Integration Workflow Overview
Install InfluxDB on ARMxy via Docker or native ARM64 package
Connect data sources: Modbus devices, MQTT brokers, etc.
Configure retention policies to manage local storage
Use Grafana (also installable on ARMxy) to build dashboards
(Optional) Forward selected metrics to cloud or central server for backup
✅ Benefits of Edge Time-Series Monitoring
Faster Insights: No need to wait for data to hit the cloud
Bandwidth Optimization: Only send essential data upstream
Improved System Resilience: Data remains accessible during downtime
Security & Compliance: Sensitive data can stay on-premises
🔚 Conclusion
Deploying InfluxDB on ARMxy Edge Gateways transforms traditional data loggers into intelligent local data hubs. With flexible integration options, support for real-time applications, and a compact industrial design, ARMxy with InfluxDB is a perfect fit for smart manufacturing, energy monitoring, and any IIoT scenario that demands fast, local decision-making.
Let the data stay close—and smart.
0 notes
Text
SRE Fundamentals: Understanding the Approach and Core Concepts
Modern digital services demand high availability, scalability, and reliability. Traditional IT operations often struggle to keep up with the dynamic nature of today’s software development cycles. This is where Site Reliability Engineering (SRE) comes into play. SRE combines software engineering principles with IT operations to ensure the development of reliable and scalable systems. Let’s dive into the SRE fundamentals, its approach, and the key concepts every professional should know.

What is Site Reliability Engineering (SRE)?
Site Reliability Engineering is a discipline introduced by Google to manage large-scale systems efficiently. It focuses on automating manual operations, reducing toil, and improving service reliability through engineering.
SRE bridges the gap between development and operations by applying software engineering to infrastructure and operations problems.
The SRE Approach: How It Works
The SRE approach is different from traditional operations in several key ways:
1. Embracing Risk
Instead of striving for 100% uptime, SREs define acceptable levels of failure using Service Level Objectives (SLOs) and Error Budgets. These allow teams to innovate quickly while maintaining reliability.
2. Automation Over Manual Work
SREs aim to reduce toil—repetitive, manual tasks—by automating deployments, monitoring, and incident response. This boosts efficiency and reduces human error.
3. Monitoring and Observability
Proactive monitoring is essential. SREs use tools to measure latency, traffic, errors, and saturation (commonly referred to as the "Four Golden Signals") to detect and resolve issues before they impact users.
4. Incident Management
When failures occur, SREs follow a well-defined incident response process, including alerting, escalation, mitigation, and post-incident reviews (PIRs). This continuous feedback loop improves systems over time.
5. Blameless Culture
SREs promote a blameless postmortem culture, where teams analyze what went wrong and how to prevent it, without blaming individuals. This encourages transparency and learning.
Key Concepts of SRE
SRE Fundamentals, it’s crucial to understand the core concepts that shape its framework:
1. SLIs, SLOs, and SLAs
SLI (Service Level Indicator): A quantitative measure of a service’s behavior (e.g., uptime, latency).
SLO (Service Level Objective): The target value or range for an SLI (e.g., 99.9% uptime).
SLA (Service Level Agreement): A formal agreement with consequences if SLOs aren’t met, often used with external customers.
2. Error Budget
An error budget is the allowable threshold of failure. If your SLO is 99.9%, the error budget is 0.1%. It balances innovation (new releases) with stability (uptime).
3. Toil
Toil refers to manual, repetitive tasks with no long-term value. Reducing toil allows SREs to focus on engineering tasks that improve system reliability.
4. Monitoring and Alerting
SREs implement intelligent alerting based on symptoms, not causes. Tools like Prometheus, Grafana, and ELK Stack help provide real-time insights.
5. Capacity Planning
Anticipating future system load ensures that infrastructure scales without compromising performance. SREs use data to plan capacity growth proactively.
6. Release Engineering
Safe, automated deployments reduce downtime. Techniques like canary releases, blue-green deployments, and feature flags are often used.
Benefits of Implementing SRE
Higher reliability and uptime
Faster incident response and recovery
Greater alignment between dev and ops teams
Reduced burnout from repetitive tasks
Improved customer satisfaction
Conclusion
SRE is not just a role—it’s a culture shift. By combining software engineering principles with traditional IT operations, SRE enables organizations to scale reliably, innovate more quickly, and develop more resilient systems. Whether you’re an aspiring SRE or a tech leader planning to implement SRE in your organization, understanding these fundamentals will set you on the path to success.
Ready to Deepen Your SRE Knowledge?
👉 Explore Our SRE Certification Training and become an expert in building reliable, scalable systems.
0 notes
Text
Streamline Cloud Deployments with CI/CD Pipelines and Automation
In today’s fast-paced digital world, speed and reliability are critical for delivering great software experiences. That’s why more enterprises are embracing CI/CD pipelines and automation to streamline their cloud deployments.
From reducing human error to accelerating time to market, this approach is transforming how modern businesses build, test, and ship software in the cloud.
🔄 What is CI/CD in the Cloud?
CI/CD (Continuous Integration and Continuous Deployment) is a modern DevOps practice that automates the software delivery process. It enables developers to integrate code frequently, test it automatically, and deploy changes rapidly and safely.
When paired with cloud platforms, CI/CD delivers:
Faster release cycles
Reliable rollbacks
Automated testing at every stage
Scalable, repeatable deployments
⚙️ Key Components of a Cloud-Native CI/CD Pipeline
Version Control System (e.g., Git, GitHub, GitLab)
CI Server (e.g., Jenkins, CircleCI, GitHub Actions)
Automated Test Framework (e.g., Selenium, JUnit, Postman)
Infrastructure as Code (IaC) for repeatable cloud infrastructure
Monitoring and Rollback Mechanisms for real-time feedback
⚡ Benefits of CI/CD Pipelines in Cloud Environments
BenefitImpact 🕒 Faster Releases Ship features, fixes, and updates quickly ✅ Higher Code Quality Automated testing reduces bugs in production 🔁 Repeatability Standardized deployment reduces errors 📈 Scalability Easily scale with demand across regions 🧪 Better Collaboration Developers can work in smaller, faster cycles
🔧 Automation in Cloud Deployments
Automation is the backbone of modern cloud operations. When integrated with CI/CD, automation ensures:
Zero-touch deployments across multiple environments
Infrastructure provisioning with tools like Terraform or AWS CloudFormation
Configuration management with Ansible, Chef, or Puppet
Cloud-native scaling with Kubernetes, Docker, and serverless platforms
🛠️ Tools to Build a CI/CD Pipeline in the Cloud
CategoryPopular Tools Version Control GitHub, GitLab, Bitbucket CI/CD Orchestration Jenkins, GitHub Actions, CircleCI, Argo CD IaC Terraform, Pulumi, AWS CDK Containerization Docker, Kubernetes, Helm Monitoring & Rollback Prometheus, Grafana, Datadog, Sentry
🔐 CI/CD Security and Compliance Considerations
As deployments speed up, so must your focus on security and governance:
Use secrets managers for API keys and credentials
Run static code analysis in your pipeline
Enforce access controls and audit logging
Integrate security testing tools (SAST, DAST) early in the pipeline
✅ Real-World Use Case: CI/CD at Salzen Cloud
At Salzen Cloud, our clients achieve:
70% faster deployment times
50% fewer production bugs
Fully automated, auditable release workflows
Our custom-built pipelines integrate with AWS, Azure, GCP, and container-based platforms to ensure secure, high-performance deployments at scale.
🧠 Final Thoughts
If you're still deploying software manually or with long release cycles, you're falling behind.
CI/CD and automation aren't just nice-to-haves — they are essential for cloud-native success. They reduce risk, improve agility, and allow teams to focus on what matters most: delivering great software faster.
Ready to modernize your cloud deployments? Let Salzen Cloud help you build a CI/CD pipeline that fits your business goals.
0 notes
Text
Scaling Inference AI: How to Manage Large-Scale Deployments
As artificial intelligence continues to transform industries, the focus has shifted from model development to operationalization—especially inference at scale. Deploying AI models into production across hundreds or thousands of nodes is a different challenge than training them. Real-time response requirements, unpredictable workloads, cost optimization, and system resilience are just a few of the complexities involved.
In this blog post, we’ll explore key strategies and architectural best practices for managing large-scale inference AI deployments in production environments.
1. Understand the Inference Workload
Inference workloads vary widely depending on the use case. Some key considerations include:
Latency sensitivity: Real-time applications (e.g., fraud detection, recommendation engines) demand low latency, whereas batch inference (e.g., customer churn prediction) is more tolerant.
Throughput requirements: High-traffic systems must process thousands or millions of predictions per second.
Resource intensity: Models like transformers and diffusion models may require GPU acceleration, while smaller models can run on CPUs.
Tailor your infrastructure to the specific needs of your workload rather than adopting a one-size-fits-all approach.
2. Model Optimization Techniques
Optimizing models for inference can dramatically reduce resource costs and improve performance:
Quantization: Convert models from 32-bit floats to 16-bit or 8-bit precision to reduce memory footprint and accelerate computation.
Pruning: Remove redundant or non-critical parts of the network to improve speed.
Knowledge distillation: Replace large models with smaller, faster student models trained to mimic the original.
Frameworks like TensorRT, ONNX Runtime, and Hugging Face Optimum can help implement these optimizations effectively.
3. Scalable Serving Architecture
For serving AI models at scale, consider these architectural elements:
Model servers: Tools like TensorFlow Serving, TorchServe, Triton Inference Server, and BentoML provide flexible options for deploying and managing models.
Autoscaling: Use Kubernetes (K8s) with horizontal pod autoscalers to adjust resources based on traffic.
Load balancing: Ensure even traffic distribution across model replicas with intelligent load balancers or service meshes.
Multi-model support: Use inference runtimes that allow hot-swapping models or running multiple models concurrently on the same node.
Cloud-native design is essential—containerization and orchestration are foundational for scalable inference.
4. Edge vs. Cloud Inference
Deciding where inference happens—cloud, edge, or hybrid—affects latency, bandwidth, and cost:
Cloud inference provides centralized control and easier scaling.
Edge inference minimizes latency and data transfer, especially important for applications in autonomous vehicles, smart cameras, and IoT
Hybrid architectures allow critical decisions to be made at the edge while sending more complex computations to the cloud..
Choose based on the tradeoffs between responsiveness, connectivity, and compute resources.
5. Observability and Monitoring
Inference at scale demands robust monitoring for performance, accuracy, and availability:
Latency and throughput metrics: Track request times, failed inferences, and traffic spikes.
Model drift detection: Monitor if input data or prediction distributions are changing, signaling potential degradation.
A/B testing and shadow deployments: Test new models in parallel with production ones to validate performance before full rollout.
Tools like Prometheus, Grafana, Seldon Core, and Arize AI can help maintain visibility and control.
6. Cost Management
Running inference at scale can become costly without careful management:
Right-size compute instances: Don’t overprovision; match hardware to model needs.
Use spot instances or serverless options: Leverage lower-cost infrastructure when SLAs allow.
Batch low-priority tasks: Queue and batch non-urgent inferences to maximize hardware utilization.
Cost-efficiency should be integrated into deployment decisions from the start.
7. Security and Governance
As inference becomes part of critical business workflows, security and compliance matter:
Data privacy: Ensure sensitive inputs (e.g., healthcare, finance) are encrypted and access-controlled.
Model versioning and audit trails: Track changes to deployed models and their performance over time.
API authentication and rate limiting: Protect your inference endpoints from abuse.
Secure deployment pipelines and strict governance are non-negotiable in enterprise environments.
Final Thoughts
Scaling AI inference isn't just about infrastructure—it's about building a robust, flexible, and intelligent ecosystem that balances performance, cost, and user experience. Whether you're powering voice assistants, recommendation engines, or industrial robotics, successful large-scale inference requires tight integration between engineering, data science, and operations.
Have questions about deploying inference at scale? Let us know what challenges you’re facing and we’ll dive in.
0 notes
Text
Rolling Deployment in Kubernetes for Microservices

In the world of microservices, ensuring zero downtime during updates is crucial for maintaining user experience and operational continuity. Rolling deployment in Kubernetes for microservices provides a powerful strategy to deploy updates incrementally, minimizing disruptions while scaling efficiently. At Global Techno Solutions, we’ve implemented rolling deployments to streamline microservices updates, as showcased in our case study on Rolling Deployment in Kubernetes for Microservices.
The Challenge: Updating Microservices Without Downtime
A fintech startup approached us with a challenge: their microservices-based payment platform, hosted on Kubernetes, required frequent updates to roll out new features and security patches. However, their existing deployment strategy caused downtime, disrupting transactions and frustrating users. Their goal was to implement a rolling deployment strategy in Kubernetes to ensure seamless updates, maintain service availability, and support their growing user base of 500,000 monthly active users.
The Solution: Rolling Deployment in Kubernetes
At Global Techno Solutions, we leveraged Kubernetes’ rolling deployment capabilities to address their needs. Here’s how we ensured smooth updates:
Rolling Deployment Configuration: We configured Kubernetes to use rolling updates, ensuring new pods with updated microservices were gradually rolled out while old pods were phased out. This maintained availability throughout the deployment process.
Health Checks and Readiness Probes: We implemented readiness and liveness probes to ensure only healthy pods received traffic, preventing users from being routed to faulty instances during the update.
Traffic Management: Using Kubernetes’ service and ingress resources, we managed traffic to ensure a seamless transition between old and new pods, avoiding any disruptions in user transactions.
Rollback Mechanism: We set up automatic rollback capabilities in case of deployment failures, ensuring the system could revert to the previous stable version without manual intervention.
Monitoring and Logging: We integrated tools like Prometheus and Grafana to monitor deployment progress and track key metrics, such as error rates and latency, in real time.
For a detailed look at our approach, explore our case study on Rolling Deployment in Kubernetes for Microservices.
The Results: Zero Downtime and Enhanced Scalability
The rolling deployment strategy delivered impressive results for the fintech startup:
Zero Downtime Deployments: Updates were rolled out seamlessly, with no disruptions to user transactions.
50% Faster Deployment Cycles: Incremental updates reduced deployment time, enabling faster feature releases.
20% Reduction in Error Rates: Health checks ensured only stable pods served traffic, improving reliability.
Improved User Trust: Consistent availability during updates enhanced the platform’s reputation among users.
These outcomes highlight the effectiveness of rolling deployments in Kubernetes for microservices. Learn more in our case study on Rolling Deployment in Kubernetes for Microservices.
Why Rolling Deployment Matters for Microservices
Rolling deployments in Kubernetes are a game-changer for microservices in 2025, offering benefits like:
Zero Downtime: Gradual updates ensure continuous service availability.
Scalability: Kubernetes dynamically scales pods to handle traffic during deployments.
Reliability: Health checks and rollbacks minimize the risk of failed updates.
Efficiency: Faster deployment cycles enable rapid iteration and innovation.
At Global Techno Solutions, we specialize in optimizing microservices deployments, ensuring businesses can scale and innovate without compromising on reliability.
Looking Ahead: The Future of Microservices Deployments
The future of microservices deployments includes advancements like canary deployments for testing updates on a small user base, AI-driven deployment optimization, and tighter integration with CI/CD pipelines. By staying ahead of these trends, Global Techno Solutions ensures our clients remain leaders in microservices innovation.
0 notes
Text
Boost Your IT Career with a DevOps Course in Bangalore
As organizations rapidly adopt agile methodologies and cloud technologies, DevOps has become an essential practice in modern software development. Companies across industries are looking for professionals who can bridge the gap between development and operations. If you want to gain in-demand skills and secure a promising job in tech, enrolling in a DevOps course in Bangalore is a strategic move.
Why Bangalore Is the Ideal Destination for DevOps Training
Bangalore, often referred to as the Silicon Valley of India, is home to countless startups, IT giants, and cloud service providers. This makes the city a thriving ecosystem for tech education and innovation. Choosing a DevOps course in Bangalore gives you access to industry-experienced trainers, hands-on labs, and a network of professionals and employers.
Whether you are a fresher looking to build a solid foundation or a working professional aiming to upskill, Bangalore offers unmatched resources and opportunities to advance your career in DevOps.
What You’ll Learn in a DevOps Course
A well-structured DevOps course in Bangalore equips learners with the knowledge and tools required to implement DevOps practices in real-world environments. The course typically covers:
Introduction to DevOps Culture and Principles
Continuous Integration and Continuous Deployment (CI/CD)
Configuration Management with tools like Ansible, Puppet, or Chef
Containerization with Docker and orchestration using Kubernetes
Source Code Management with Git and GitHub
Monitoring and Logging using tools like Prometheus, Grafana, and ELK stack
Real-time projects and cloud-based deployment
Training programs are usually designed to include hands-on labs that simulate real business scenarios, allowing learners to gain practical experience.
Career Opportunities and Industry Demand
Completing a DevOps course in Bangalore opens doors to high-demand roles such as DevOps Engineer, Release Manager, Automation Engineer, and Site Reliability Engineer (SRE). These roles are crucial for ensuring fast, efficient, and reliable software delivery in modern enterprises.
DevOps professionals are among the highest-paid in the IT industry. Bangalore’s vibrant tech ecosystem offers a wealth of job opportunities in both large MNCs and fast-growing startups, making it an ideal location to launch or enhance your DevOps career.
Choosing the Right DevOps Training Institute
To get the best results from your training, it's important to choose the right DevOps course in Bangalore. Consider these factors:
Expert Faculty: Trainers should have real-world experience and industry certifications.
Comprehensive Curriculum: Ensure the syllabus covers key DevOps tools and practices.
Hands-On Projects: Practical training is essential to apply your knowledge effectively.
Certifications: Look for courses that prepare you for certifications like Docker, Kubernetes, and AWS DevOps.
Placement Support: Institutes with job assistance services can help you connect with top employers.
Conclusion
A DevOps course in Bangalore https://www.apponix.com/devops-certification/devops-training-institutes-in-bangalore.html provides the technical skills and practical experience needed to thrive in today’s software-driven world. With high-paying roles, strong job growth, and a tech-friendly environment, Bangalore is the perfect city to build your DevOps career. Whether you’re entering the IT field or upgrading your skills, DevOps training is a valuable investment in your future.
0 notes
Text
"Frontend Flair to Backend Brains: Your Code-to-Cloud Journey"
In today’s digital world, the gap between an idea and a fully functional online product is narrowing faster than ever. Whether you're crafting visually stunning interfaces or architecting robust server logic, the journey from code to cloud is one every modern developer must master. This evolution—from eye-catching frontends to intelligent backends—is not just a career path but a craft. Welcome to the full spectrum: Frontend Flair to Backend Brains.
The Rise of Full Stack Development
Full stack development has emerged as one of the most sought-after skill sets in the tech industry. It empowers developers to build end-to-end applications that operate seamlessly across both the client and server sides. What once required separate roles for frontend and backend specialists can now be handled by a single skilled full stack developer.
Full stack professionals possess a unique blend of skills:
Frontend Mastery: Expertise in HTML, CSS, JavaScript, and frameworks like React or Angular to build responsive and interactive user interfaces.
Backend Logic: Proficiency in server-side languages such as Java, Python, or Node.js, enabling them to manage data, authentication, and business logic.
Database Integration: Familiarity with both SQL and NoSQL databases like MySQL or MongoDB.
DevOps & Cloud Deployment: Understanding of CI/CD pipelines, containerization (Docker), and platforms like AWS, Azure, or Google Cloud.
By mastering these areas, developers can confidently take an idea from its earliest wireframe to a fully deployed application, accessible to users around the globe.
Java Certificate: A Launchpad to Backend Excellence
While full stack development spans a wide array of technologies, strong backend fundamentals are key to building scalable, efficient applications. Java continues to be a mainstay in enterprise software and backend services, thanks to its reliability, security, and cross-platform capabilities.
Earning a Java certificate can be a significant boost for aspiring developers looking to strengthen their backend proficiency. Here’s how:
Structured Learning: A Java certification program ensures comprehensive coverage of core concepts including OOP (Object-Oriented Programming), exception handling, multithreading, and file I/O.
Industry Recognition: It serves as a credential that validates your skill level to employers, helping you stand out in a competitive market.
Problem-Solving Skills: The certification process hones your ability to write efficient and clean code, an essential trait for backend development.
Whether you're transitioning into backend work or enhancing your existing expertise, a Java certificate acts as a reliable stepping stone.
From Code to Cloud: Building Real-World Applications
The journey doesn’t stop with writing code. Deploying your application to the cloud is where theory meets reality. The modern developer's toolkit includes:
Version Control (e.g., Git/GitHub)
CI/CD Pipelines (e.g., Jenkins, GitHub Actions)
Containerization (Docker, Kubernetes)
Monitoring & Logging (Prometheus, Grafana, ELK Stack)
Cloud Providers (AWS, Google Cloud, Azure)
By integrating these tools into your workflow, you ensure your applications are scalable, maintainable, and ready for production.
Why This Journey Matters
Bridging frontend creativity with backend logic isn't just about versatility—it's about creating holistic solutions that perform beautifully and reliably. As organizations increasingly move their operations online, the demand for developers who can think in terms of both design and infrastructure is at an all-time high.
In Summary:
Full stack development enables end-to-end product building, from user interface to server-side logic.
A Java certificate validates your backend expertise and helps build a strong programming foundation.
Understanding deployment, DevOps, and cloud ecosystems is crucial for bringing your code into the real world.
The journey from "Frontend Flair to Backend Brains" isn't linear—it's dynamic, hands-on, and constantly evolving. With the right skills and mindset, you can bring your code from your local machine to the cloud, shaping the digital experiences of tomorrow.
0 notes
Text
How to Handle Failure Gracefully in Cloud Native Applications

Building modern software requires more than just writing clean code or deploying fast features. It also demands resilience—the ability to continue functioning under stress, errors, or system breakdowns. That’s why cloud native application development has become the gold standard for creating fault-tolerant, scalable systems. Cloud-native approaches empower teams to build distributed applications that can recover quickly and handle unexpected failures gracefully.
Failure is inevitable in large-scale cloud systems. Services crash, networks drop, and dependencies fail. But how your application responds to failure determines whether users experience a hiccup or a total breakdown.
Understand the Nature of Failures in Cloud Native Systems
Before you can handle failures gracefully, it’s essential to understand what kinds of failures occur in cloud-native environments:
Service crashes or downtime
Latency and timeouts in microservices communication
Database unavailability
Network outages
Resource exhaustion (memory, CPU, etc.)
Third-party API failures
Because cloud-native systems are distributed, they naturally introduce new failure points. Your goal is not to eliminate failure completely—but to detect it quickly and minimize its impact.
Design for Failure from the Start
One of the core principles of cloud native design is to assume failure. When teams bake resilience into the architecture from day one, they make systems more robust and maintainable.
Here are a few proactive design strategies:
Decouple services: Break down monolithic applications into loosely coupled microservices so that the failure of one service doesn’t crash the entire application.
Use retries with backoff: When a service is temporarily unavailable, automatic retries with exponential backoff can give it time to recover.
Implement circuit breakers: Circuit breakers prevent cascading failures by temporarily stopping requests to a failing service and allowing it time to recover.
Graceful degradation: Prioritize core features and allow non-critical components (e.g., recommendations, animations) to fail silently or provide fallback behavior.
Monitor Continuously and Detect Early
You can't fix what you can’t see. That’s why observability is crucial in cloud native environments.
Logging: Capture structured logs across services to trace issues and gather context.
Metrics: Monitor CPU usage, memory, request latency, and error rates using tools like Prometheus and Grafana.
Tracing: Use distributed tracing tools like Jaeger or OpenTelemetry to monitor the flow of requests between services.
Alerts: Configure alerts to notify teams immediately when anomalies or failures occur.
Proactive monitoring allows teams to fix problems before users are impacted—or at least respond swiftly when they are.
Automate Recovery and Scaling
Automation is a critical pillar of cloud native systems. Use tools that can self-heal and scale your applications:
Kubernetes: Automatically reschedules failed pods, manages load balancing, and ensures desired state configuration.
Auto-scaling: Adjust resources dynamically based on demand to avoid outages caused by spikes in traffic.
Self-healing workflows: Design pipelines or jobs that restart failed components automatically without manual intervention.
By automating recovery, you reduce downtime and improve the user experience even when systems misbehave.
Test for Failure Before It Happens
You can only prepare for failure if you test how your systems behave under pressure. Techniques like chaos engineering help ensure your applications can withstand real-world problems.
Chaos Monkey: Randomly terminates services in production to test the system’s fault tolerance.
Failure injection: Simulate API failures, network delays, or server crashes during testing.
Load testing: Validate performance under stress to ensure your systems scale and fail predictably.
Regular testing ensures your teams understand how the system reacts and how to contain or recover from those situations.
Communicate During Failure
How you handle external communication during a failure is just as important as your internal mitigation strategy.
Status pages: Keep users informed with real-time updates about known issues.
Incident response protocols: Ensure teams have predefined roles and steps to follow during downtime.
Postmortems: After recovery, conduct transparent postmortems that focus on learning, not blaming.
Clear, timely communication builds trust and minimizes user frustration during outages.
Embrace Continuous Improvement
Failure is never final—it’s an opportunity to learn and improve. After every incident, analyze what went wrong, what worked well, and what could be done better.
Update monitoring and alerting rules
Improve documentation and runbooks
Refine retry or fallback logic
Train teams through simulations and incident drills
By continuously refining your practices, you build a culture that values resilience as much as innovation.
Conclusion
In cloud native application development, failure isn’t the enemy—it’s a reality that well-designed systems are built to handle. By planning for failure, monitoring intelligently, automating recovery, and learning from each incident, your applications can offer high availability and user trust—even when things go wrong.
Remember, graceful failure handling is not just a technical challenge—it’s a mindset that prioritizes resilience, transparency, and continuous improvement. That’s what separates good systems from great ones in today’s cloud-native world.
#CloudNative#DevOps#Azure#Kubernetes#Microservices#CloudComputing#SiteReliability#ResilienceEngineering#FailureHandling#Observability#CloudZone
0 notes
Link
0 notes