#Observability
Explore tagged Tumblr posts
Visit Tumblr Blog
Explore Tumblr blogs with no restrictions, modern design and the best experience.
Last Seen Tumblr Blogs


Fun Fact
In 2020, 27% of US Tumblr users had an annual household income of over $100,000.
Text
as a cis guy, when presented with the "99% you get a ton of money, 1% you turn into a girl" it honestly would be dumb to not hit that button until it breaks. like ok now i have 100 bajillion dollars and gender dysphoria. big deal. i have all the money in the world to turn me back into a guy. like with that kind of money i could have obama do me a phalloplasty. he wouldnt be able to do it as he isnt a surgeon but the point still stands
80K notes
·
View notes
Text
i am increasingly convinced that the wedding industry is having a statistically significant impact on young women leaving the mormon church. has anyone looked into this?
24K notes
·
View notes
Text
How to Handle Failure Gracefully in Cloud Native Applications

Building modern software requires more than just writing clean code or deploying fast features. It also demands resilience—the ability to continue functioning under stress, errors, or system breakdowns. That’s why cloud native application development has become the gold standard for creating fault-tolerant, scalable systems. Cloud-native approaches empower teams to build distributed applications that can recover quickly and handle unexpected failures gracefully.
Failure is inevitable in large-scale cloud systems. Services crash, networks drop, and dependencies fail. But how your application responds to failure determines whether users experience a hiccup or a total breakdown.
Understand the Nature of Failures in Cloud Native Systems
Before you can handle failures gracefully, it’s essential to understand what kinds of failures occur in cloud-native environments:
Service crashes or downtime
Latency and timeouts in microservices communication
Database unavailability
Network outages
Resource exhaustion (memory, CPU, etc.)
Third-party API failures
Because cloud-native systems are distributed, they naturally introduce new failure points. Your goal is not to eliminate failure completely—but to detect it quickly and minimize its impact.
Design for Failure from the Start
One of the core principles of cloud native design is to assume failure. When teams bake resilience into the architecture from day one, they make systems more robust and maintainable.
Here are a few proactive design strategies:
Decouple services: Break down monolithic applications into loosely coupled microservices so that the failure of one service doesn’t crash the entire application.
Use retries with backoff: When a service is temporarily unavailable, automatic retries with exponential backoff can give it time to recover.
Implement circuit breakers: Circuit breakers prevent cascading failures by temporarily stopping requests to a failing service and allowing it time to recover.
Graceful degradation: Prioritize core features and allow non-critical components (e.g., recommendations, animations) to fail silently or provide fallback behavior.
Monitor Continuously and Detect Early
You can't fix what you can’t see. That’s why observability is crucial in cloud native environments.
Logging: Capture structured logs across services to trace issues and gather context.
Metrics: Monitor CPU usage, memory, request latency, and error rates using tools like Prometheus and Grafana.
Tracing: Use distributed tracing tools like Jaeger or OpenTelemetry to monitor the flow of requests between services.
Alerts: Configure alerts to notify teams immediately when anomalies or failures occur.
Proactive monitoring allows teams to fix problems before users are impacted—or at least respond swiftly when they are.
Automate Recovery and Scaling
Automation is a critical pillar of cloud native systems. Use tools that can self-heal and scale your applications:
Kubernetes: Automatically reschedules failed pods, manages load balancing, and ensures desired state configuration.
Auto-scaling: Adjust resources dynamically based on demand to avoid outages caused by spikes in traffic.
Self-healing workflows: Design pipelines or jobs that restart failed components automatically without manual intervention.
By automating recovery, you reduce downtime and improve the user experience even when systems misbehave.
Test for Failure Before It Happens
You can only prepare for failure if you test how your systems behave under pressure. Techniques like chaos engineering help ensure your applications can withstand real-world problems.
Chaos Monkey: Randomly terminates services in production to test the system’s fault tolerance.
Failure injection: Simulate API failures, network delays, or server crashes during testing.
Load testing: Validate performance under stress to ensure your systems scale and fail predictably.
Regular testing ensures your teams understand how the system reacts and how to contain or recover from those situations.
Communicate During Failure
How you handle external communication during a failure is just as important as your internal mitigation strategy.
Status pages: Keep users informed with real-time updates about known issues.
Incident response protocols: Ensure teams have predefined roles and steps to follow during downtime.
Postmortems: After recovery, conduct transparent postmortems that focus on learning, not blaming.
Clear, timely communication builds trust and minimizes user frustration during outages.
Embrace Continuous Improvement
Failure is never final—it’s an opportunity to learn and improve. After every incident, analyze what went wrong, what worked well, and what could be done better.
Update monitoring and alerting rules
Improve documentation and runbooks
Refine retry or fallback logic
Train teams through simulations and incident drills
By continuously refining your practices, you build a culture that values resilience as much as innovation.
Conclusion
In cloud native application development, failure isn’t the enemy—it’s a reality that well-designed systems are built to handle. By planning for failure, monitoring intelligently, automating recovery, and learning from each incident, your applications can offer high availability and user trust—even when things go wrong.
Remember, graceful failure handling is not just a technical challenge—it’s a mindset that prioritizes resilience, transparency, and continuous improvement. That’s what separates good systems from great ones in today’s cloud-native world.
#CloudNative#DevOps#Azure#Kubernetes#Microservices#CloudComputing#SiteReliability#ResilienceEngineering#FailureHandling#Observability#CloudZone
0 notes
Text


Some observations on book covers
Edit because apparently this needs to be said: the point of a book cover is to tell you what you're about to read and whether or not you want to read it. Following trends in cover design doesn't mean the book is bad or had a bad cover designer. It's visual communication. I've read and enjoyed about half the books featured here.
9K notes
·
View notes
Text
Datadog Services: Expert Monitoring & Security Solutions
Ensure real-time monitoring, security, and performance optimization with our Datadog services. We provide seamless integration, performance monitoring, log management, and security solutions to help businesses gain full visibility into their cloud and on-premise infrastructure. Our expert team offers custom dashboards, automated alerts, and 24/7 support to keep your IT environment efficient and secure. Whether you're looking to improve application performance, enhance security, or optimize cloud operations, we deliver tailored Datadog solutions to meet your needs. Email: [email protected] Phone: +91 7300070038 Website: Memetic Solutions Visit our website or contact us today to learn how our Datadog expertise can elevate your business!
#Datadog#CloudMonitoring#APM#ITSecurity#DevOps#Log Management#PerformanceOptimization#Cyber Security#Observability#InfrastructureMonitoring
0 notes
Text
How to Use Telemetry Pipelines to Maintain Application Performance.
Sanjay Kumar Mohindroo Sanjay Kumar Mohindroo. skm.stayingalive.in Optimize application performance with telemetry pipelines—enhance observability, reduce costs, and ensure security with efficient data processing. 🚀 Discover how telemetry pipelines optimize application performance by streamlining observability, enhancing security, and reducing costs. Learn key strategies and best…
#AI-powered Observability#Anonymization#Application Performance#Cloud Computing#Cost Optimization#Cybersecurity#Data Aggregation#Data Filtering#Data Normalization#Data Processing#Data Retention Policies#Debugging Techniques#DevOps#digital transformation#Edge Telemetry Processing#Encryption#GDPR#HIPAA#Incident Management#IT Governance#Latency Optimization#Logging#Machine Learning in Observability#Metrics#Monitoring#News#Observability#Real-Time Alerts#Regulatory Compliance#Sanjay Kumar Mohindroo
0 notes
Text
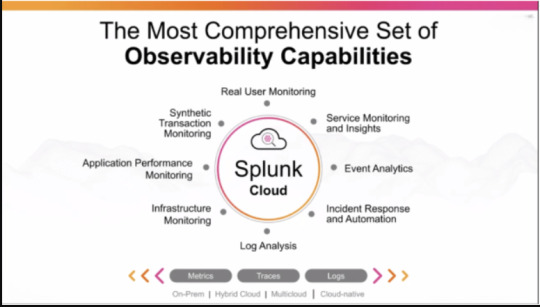
Splunk & DevOps: A New Era for Monitoring & Observability
Splunk is taking DevOps to the next level by integrating powerful monitoring and observability features. By collecting real-time data from logs, metrics, and traces, Splunk empowers teams to spot issues before they escalate, ensuring smooth operations and optimized performance.
🔑 Key Insights:
Real-Time Monitoring: Stay ahead with live data insights.
Unified View: See your entire infrastructure at a glance.
Faster Troubleshooting: Quickly identify and resolve issues.
Splunk’s approach to observability is transforming how DevOps teams manage systems. Curious about how this works? Read the full article here.
#DevOps#Splunk#Observability#RealTimeMonitoring#TechInnovation#DataAnalytics#SystemOptimization#CI_CD#MachineLearning#ProactiveMonitoring#ITManagement
0 notes
Text
How Datadog is Transforming DevOps with Monitoring & Observability
In a world driven by cloud computing and automation, system reliability is crucial. Datadog is leveraging DevOps best practices to enhance monitoring, observability, and security for modern IT infrastructure.
💡 Why Datadog? ✅ Real-time observability across hybrid and cloud environments 🌍 ✅ AI-powered insights to detect performance issues before they escalate 🚨 ✅ Seamless DevOps integration with CI/CD pipelines ⚙️ ✅ Security & Compliance Monitoring for proactive threat detection 🔐
🔗 Read the full article here: 👉 https://www.bestdevops.com/how-datadog-is-using-devops-in-monitoring-and-observability/
💬 What are your favorite monitoring tools? Drop your thoughts in the comments!

0 notes
Text
Enhancing AgenticOps with Observability
To maintain an efficient AgenticOps system, Agent Observability is vital, allowing monitoring and optimization of agent workflows. Let's talk about it.
To ensure an AgenticOps system remains efficient, explainable, and continuously improving, we need Agent Observability as a core feature. This enables monitoring, debugging, and optimizing agent workflows just as we would in a human-managed system. 1️⃣ First Principles of Agent Observability Agent observability allows us to: Track Agent Behavior – Log all actions and decisions for…
0 notes
Text

fatima aamer bilal, excerpt from moony moonless sky’s ‘i am an observer, but not by choice.’
[text id: my fist has always been clenched around the handle of an invisible suitcase. / i am always ready to leave. / there is not a single room in this world where i belong.]
#fatima aamer bilal#i am an observer but not by choice#poetry#literature#poeticstories#poetry collection#typography#words words words#yearning#longing#parent issues#girlhood#dark academia#web weaving#art#bts#franz kafka#sylvia plath#book quotations#lana del rey#mitski#hozier#pheobe bridgers#poem#prose#anne carson#jane austen#mahmoud darwish#fiction#fantasy
35K notes
·
View notes
Text
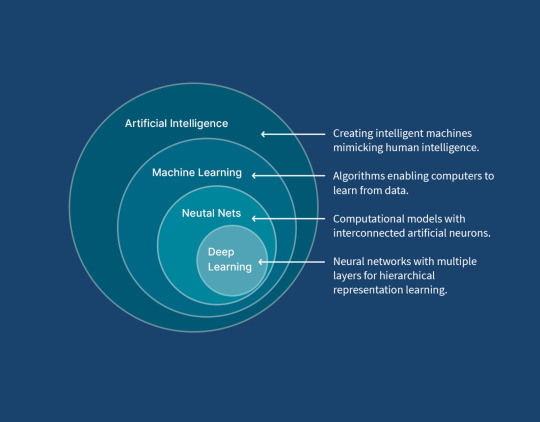
Fluent Bit and AI: Unlocking Machine Learning Potential
These days, everywhere you look, there are references to Generative AI, to the point that what have Fluent Bit and GenAI got to do with each other? GenAI has the potential to help with observability, but it also needs observation to measure its performance, whether it is being abused, etc. You may recall a few years back that Microsoft was trailing new AI features for Bing, and after only having…
View On WordPress
#AI#Cloud#Data Drift#development#Fluent Bit#GenAI#Machine Learning#ML#observability#Security#Tensor Lite#TensorFlow
0 notes
Text
Hallmark Movie tropes where a woman visits her rural hometown and fall in love with a random camo wearing musclebound white man because of the power of Christmas, and then leaves her successful city job, and cuck boyfriend to be said man's submissive wife is conservative and possibly even white nationalist propaganda.
In this essay I will...
52K notes
·
View notes
Text

Peter Birkhäuser (1911–1976) - The Observer
10K notes
·
View notes
Text
From ThoughtWorks radar 10/2024:
[Trial] ClickHouse is an open-source, columnar online analytical processing (OLAP) database for real-time analytics. It started as an experimental project in 2009 and has since matured into a highly performant and linearly scalable analytical database. Its efficient query processing engine together with data compression makes it suitable to run interactive queries without pre-aggregation. ClickHouse is also a great storage choice for OpenTelemetry data. Its integration with Jaeger allows you to store massive volumes of traces and analyze them efficiently.
0 notes