#Importance of Data Model in DBMS
Explore tagged Tumblr posts
Visit Tumblr Blog
Explore Tumblr blogs with no restrictions, modern design and the best experience.
Last Seen Tumblr Blogs


Fun Fact
Tumblr Inc. is funded by 13 investors.
Text
Discovering the Importance of Data Model in DBMS
Summary: This article explores the importance of data models in DBMS, highlighting their role in structuring, storing, and managing data efficiently. It covers various types of data models and their impact on database management, emphasizing how proper data modeling enhances data integrity, query optimization, and overall database performance.

Introduction
Data models in DBMS are essential frameworks that define how data is structured, stored, and managed. Understanding the importance of data models in DBMS is crucial for effective database design and optimization. Data models help organize complex data, ensure consistency, and facilitate efficient querying.
This article explores the significance of data models, their various types, and their impact on database management. By examining these aspects, you'll gain insights into how proper data modeling enhances data integrity and system performance, leading to better overall database solutions.
What is a Data Model?
A data model is a conceptual framework used to define and structure data within a database management system (DBMS). It provides a systematic approach to organizing data, representing the relationships between different data elements, and ensuring data integrity.
Definition of a Data Model
A data model is essentially a blueprint for how data is stored, organized, and manipulated in a database. It defines the data elements and the relationships between them, making it easier to understand and manage the data within the system.
Key Components of a Data Model
A data model consists of three primary components:
Entities: These are the objects or concepts that represent real-world items, such as a customer, product, or order.
Attributes: These are the properties or characteristics of entities, like a customer’s name, address, or phone number.
Relationships: These define how entities are related to each other. For example, a customer can place multiple orders, establishing a one-to-many relationship.
Purpose of Data Modeling
The main purpose of data modeling is to create a clear and logical representation of data that can be used to build a database. It helps ensure consistency, reduce redundancy, and improve data integrity, making the database more efficient and easier to maintain.
Types of Data Models in DBMS

Below, we explore five primary types of data models in DBMS: Hierarchical, Network, Relational, Object-Oriented, and Entity-Relationship (ER) models. Each model has its unique structure, characteristics, advantages, and disadvantages.
Hierarchical Data Model
The hierarchical data model organizes data in a tree-like structure, where each record has a single parent but can have multiple children. This parent-child relationship resembles a hierarchy, with the root node at the top.
Each child node represents a subordinate entity, creating a structure that visually appears like a tree. This model is particularly effective for situations where the data is naturally hierarchical, such as organizational charts or file systems.
One of the main advantages of the hierarchical model is its simplicity and ease of use for certain types of data. It allows for efficient data retrieval when dealing with hierarchical data, as paths between nodes are straightforward.
However, the hierarchical model has significant limitations. It struggles with representing more complex relationships where an entity might have multiple parents. Additionally, the rigidity of the structure makes it challenging to modify or reorganize the database once it has been established.
Network Data Model
The network data model extends the hierarchical model by allowing more complex relationships among data entities. In this model, data is organized as a graph, where each node (record) can have multiple parent and child nodes. This many-to-many relationship makes the network model more flexible than the hierarchical model, accommodating more complex data relationships.
The network model offers greater flexibility in representing relationships, making it suitable for scenarios like airline reservation systems or telecommunications databases where many-to-many relationships are common.
However, its complexity is also a drawback. The network model is more challenging to design and maintain, requiring careful planning to avoid data integrity issues. Additionally, querying the database can be more complex compared to simpler models like the hierarchical or relational models.
Relational Data Model
The relational data model organizes data into tables (or relations) where each table represents a collection of related data.
These tables are made up of rows (tuples) and columns (attributes), with each row representing a unique record and each column representing a field within that record. The relationships between tables are established through the use of keys, such as primary keys and foreign keys.
The relational model is highly flexible and intuitive, making it the most widely used data model in DBMS. It allows for easy data retrieval through Structured Query Language (SQL) and supports complex queries across multiple tables. One of the significant advantages is its ability to maintain data integrity through constraints and relationships.
However, the relational model can become inefficient when dealing with very large databases or highly complex queries, potentially leading to performance issues.
Object-Oriented Data Model
The object-oriented data model integrates concepts from object-oriented programming into database design. In this model, data is represented as objects, similar to objects in programming languages like Java or C++.
Each object contains data (attributes) and methods (procedures) that define its behavior. This model supports inheritance, polymorphism, and encapsulation, allowing for the creation of more complex and dynamic data structures.
The object-oriented model is highly versatile, making it ideal for applications where complex data types and relationships are involved, such as computer-aided design (CAD) systems or multimedia databases. It allows for the seamless integration of database operations with object-oriented programming, facilitating more natural data manipulation.
However, this model's complexity can make it difficult to implement and manage, and it may not be as efficient as the relational model for simple, straightforward data queries.
Entity-Relationship (ER) Model
The Entity-Relationship (ER) model represents data in terms of entities, which are objects or things of interest, and the relationships between them. Entities are depicted as rectangles, while relationships are represented by diamonds, connecting the entities involved.
The ER model is often used in the conceptual design phase of database development, providing a clear and visual way to represent the data structure before it is implemented in a specific DBMS.
The ER model is highly intuitive and provides a clear visual representation of the data and its relationships. It is particularly useful in the initial stages of database design, helping developers and stakeholders understand the data requirements.
However, the ER model is more abstract and needs to be converted into a more concrete data model, such as a relational model, for implementation. This conversion process can sometimes lead to a loss of detail or require additional design effort.
Each of these data models in DBMS serves specific purposes and is suited to different types of data and applications. Understanding their structures, advantages, and limitations is crucial for effective database design and management.
Importance of Data Models in DBMS

Understanding the importance of data models is essential for anyone involved in database management, as it directly impacts the quality and functionality of the database system.
Data Organization and Structure
Data models are fundamental in organizing data within a DBMS. They provide a systematic approach to structuring data, defining the relationships between different data elements, and categorizing data into entities, attributes, and relationships. This organization allows for a clear, logical representation of data, making it easier to understand and manage.
For example, in a relational data model, data is organized into tables (or relations) where each table represents an entity, and each row corresponds to a record within that entity. Columns within these tables represent the attributes of the entity, and relationships between tables are established through keys, such as primary and foreign keys.
This organized structure not only simplifies data management but also facilitates efficient data retrieval and manipulation.
Consider a customer database in a retail system. Using a relational data model, the data is organized into tables such as "Customers," "Orders," and "Products." Each table stores specific information related to that entity, with relationships defined between them to track which customers have placed which orders and what products are included in those orders.
This organized approach ensures that data is easily accessible and can be updated or retrieved without ambiguity.
Data Integrity and Consistency
Maintaining data integrity and consistency is one of the most crucial aspects of database management, and data models are instrumental in achieving this. Data integrity refers to the accuracy and reliability of data within the database, while consistency ensures that data remains uniform across the system.
Data models enforce integrity and consistency by defining constraints and rules that the data must adhere to. For instance, in a relational data model, integrity constraints such as primary keys, foreign keys, and unique constraints are used to ensure that each record is unique, related data across tables are accurately linked, and no duplicate or invalid data exists.
These constraints prevent anomalies and errors during data entry, thereby maintaining the overall quality of the database.
An example of maintaining data integrity can be seen in a student database system. Suppose the database includes tables for "Students" and "Courses." A foreign key constraint in the "Enrollments" table ensures that every course a student is enrolled in exists within the "Courses" table and that the student is registered in the "Students" table.
This relationship enforces data integrity, ensuring that no invalid or incomplete records are entered into the database.
Query Optimization
Data models significantly influence the efficiency of query processing within a DBMS. Query optimization is the process of improving the speed and performance of queries, and the structure provided by data models plays a vital role in this.
By organizing data in a structured manner, data models enable the DBMS to execute queries more efficiently. For instance, in a well-designed relational data model, indexing can be applied to key columns, allowing the system to locate and retrieve data faster.
Additionally, normalized data models reduce redundancy, ensuring that queries do not need to process unnecessary data, thus speeding up query execution.
Consider a large e-commerce database where customers frequently search for products. A well-designed relational data model, with indexes on product names and categories, allows the DBMS to quickly retrieve the relevant products, even from a vast dataset. This optimization improves the user experience by delivering faster search results.
Database Design and Development
Data models are the foundation upon which databases are designed and developed. They provide the necessary guidelines for creating a database that is not only functional but also scalable and maintainable.
During the database design phase, data models help define the schema, which is the overall structure of the database. This includes determining the tables, the relationships between them, and the constraints that ensure data integrity.
A well-structured schema, based on a robust data model, leads to a database that can handle large volumes of data and complex queries without compromising performance.
For example, in the development of a banking system, a data model would guide the design of tables such as "Accounts," "Transactions," and "Customers." It would establish the necessary relationships, such as linking transactions to specific accounts and customers, and define constraints to ensure that transactions are accurately recorded and linked to valid accounts.
This structured approach ensures that the database can effectively support the bank’s operations and scale as needed.
Best Practices for Data Modeling
Adhering to best practices in data modeling ensures that your database is efficient, scalable, and capable of handling complex queries. A well-structured data model not only supports data integrity but also enhances overall system performance. Here are some key best practices to follow when designing and maintaining data models:
Understand the Business Requirements: Before starting, gather detailed information about the business processes and data needs. This ensures that the data model aligns with business objectives.
Choose the Right Data Model: Select a data model that best suits the application. Whether it’s hierarchical, network, relational, or object-oriented, the choice should reflect the specific requirements of the project.
Normalize Data Where Necessary: Apply normalization to eliminate redundancy and ensure data integrity. However, balance normalization with performance needs, as overly normalized models can lead to complex queries.
Incorporate Future Scalability: Design the model with future growth in mind. Anticipate changes in data volume and complexity to ensure the model can adapt without requiring a complete redesign.
Regularly Review and Update the Model: Continuously review the data model to keep it aligned with evolving business needs. Regular updates prevent the model from becoming outdated or inefficient.
Document the Data Model: Keep thorough documentation of the data model. This aids in maintenance and helps new team members quickly understand the structure and logic behind the design.
Frequently Asked Questions
What is the importance of data models in DBMS?
Data models in DBMS are crucial as they define how data is structured, stored, and managed. They ensure data consistency, integrity, and efficient querying, leading to optimized database performance and easier management.
How do data models improve database management?
Data models organize complex data into structured frameworks, making it easier to manage, retrieve, and manipulate data. They enforce data integrity, optimize queries, and provide a clear blueprint for database design.
What are the key components of a data model in DBMS?
The key components of a data model in DBMS include entities, attributes, and relationships. These elements define the data structure, ensuring a logical organization of data within the database.
Conclusion
Understanding the importance of data models in DBMS is vital for anyone involved in database design and management. Data models provide the necessary structure for organizing, storing, and managing data efficiently. They ensure data integrity, consistency, and optimized query performance, leading to more reliable and scalable database systems.
By selecting the appropriate data model and adhering to best practices in data modeling, you can create databases that not only meet current needs but also accommodate future growth and complexity. Proper data modeling ultimately enhances the effectiveness and functionality of your database management system.
0 notes
Text
0 notes
Text
Data Engineer vs Data Analyst vs Data Scientist vs ML Engineer: Choose Your Perfect Data Career!
In today’s rapidly evolving tech world, career opportunities in data-related fields are expanding like never before. However, with multiple roles like Data Engineer vs Data Analyst vs Data Scientist vs ML Engineer, newcomers — and even seasoned professionals — often find it confusing to understand how these roles differ.
At Yasir Insights, we think that having clarity makes professional selections more intelligent. We’ll go over the particular duties, necessary abilities, and important differences between these well-liked Data Engineer vs Data Analyst vs Data Scientist vs ML Engineer data positions in this blog.
Also Read: Data Engineer vs Data Analyst vs Data Scientist vs ML Engineer
Introduction to Data Engineer vs Data Analyst vs Data Scientist vs ML Engineer
The Data Science and Machine Learning Development Lifecycle (MLDLC) includes stages like planning, data gathering, preprocessing, exploratory analysis, modelling, deployment, and optimisation. In order to effectively manage these intricate phases, the burden is distributed among specialised positions, each of which plays a vital part in the project’s success.
Data Engineer
Who is a Data Engineer?
The basis of the data ecosystem is built by data engineers. They concentrate on collecting, sanitising, and getting data ready for modelling or further analysis. Think of them as mining precious raw materials — in this case, data — from complex and diverse sources.
Key Responsibilities:
Collect and extract data from different sources (APIS, databases, web scraping).
Design and maintain scalable data pipelines.
Clean, transform, and store data in warehouses or lakes.
Optimise database performance and security.
Required Skills:
Strong knowledge of Data Structures and Algorithms.
Expertise in Database Management Systems (DBMS).
Familiarity with Big Data tools (like Hadoop, Spark).
Hands-on experience with cloud platforms (AWS, Azure, GCP).
Proficiency in building and managing ETL (Extract, Transform, Load) pipelines.
Data Analyst
Who is a Data Analyst?
Data analysts take over once the data has been cleansed and arranged. Their primary responsibility is to evaluate data in order to get valuable business insights. They provide answers to important concerns regarding the past and its causes.
Key Responsibilities:
Perform Exploratory Data Analysis (EDA).
Create visualisations and dashboards to represent insights.
Identify patterns, trends, and correlations in datasets.
Provide reports to support data-driven decision-making.
Required Skills:
Strong Statistical knowledge.
Proficiency in programming languages like Python or R.
Expertise in Data Visualisation tools (Tableau, Power BI, matplotlib).
Excellent communication skills to present findings clearly.
Experience working with SQL databases.
Data Scientist
Who is a Data Scientist?
Data Scientists build upon the work of Data Analysts by developing predictive models and machine learning algorithms. While analysts focus on the “what” and “why,” Data Scientists focus on the “what’s next.”
Key Responsibilities:
Design and implement Machine Learning models.
Perform hypothesis testing, A/B testing, and predictive analytics.
Derive strategic insights for product improvements and new innovations.
Communicate technical findings to stakeholders.
Required Skills:
Mastery of Statistics and Probability.
Strong programming skills (Python, R, SQL).
Deep understanding of Machine Learning algorithms.
Ability to handle large datasets using Big Data technologies.
Critical thinking and problem-solving abilities.
Machine Learning Engineer
Who is a Machine Learning Engineer?
Machine Learning Engineers (MLES) take the models developed by Data Scientists and make them production-ready. They ensure models are deployed, scalable, monitored, and maintained effectively in real-world systems.
Key Responsibilities:
Deploy machine learning models into production environments.
Optimise and scale ML models for performance and efficiency.
Continuously monitor and retrain models based on real-time data.
Collaborate with software engineers and data scientists for integration.
Required Skills:
Strong foundations in Linear Algebra, Calculus, and Probability.
Mastery of Machine Learning frameworks (TensorFlow, PyTorch, Scikit-learn).
Proficiency in programming languages (Python, Java, Scala).
Knowledge of Distributed Systems and Software Engineering principles.
Familiarity with MLOps tools for automation and monitoring.
Summary: Data Engineer vs Data Analyst vs Data Scientist vs ML Engineer
Data Engineer
Focus Area: Data Collection & Processing
Key Skills: DBMS, Big Data, Cloud Computing
Objective: Build and maintain data infrastructure
Data Analyst
Focus Area: Data Interpretation & Reporting
Key Skills: Statistics, Python/R, Visualisation Tools
Objective: Analyse data and extract insights
Data Scientist
Focus Area: Predictive Modelling
Key Skills: Machine Learning, Statistics, Data Analysis
Objective: Build predictive models and strategies
Machine Learning Engineer
Focus Area: Model Deployment & Optimisation
Key Skills: ML Frameworks, Software Engineering
Objective: Deploy and optimise ML models in production
Frequently Asked Questions (FAQS)
Q1: Can a Data Engineer become a Data Scientist?
Yes! With additional skills in machine learning, statistics, and model building, a Data Engineer can transition into a Data Scientist role.
Q2: Is coding necessary for Data Analysts?
While deep coding isn’t mandatory, familiarity with SQL, Python, or R greatly enhances a Data Analyst’s effectiveness.
Q3: What is the difference between a Data Scientist and an ML Engineer?
Data Scientists focus more on model development and experimentation, while ML Engineers focus on deploying and scaling those models.
Q4: Which role is the best for beginners?
If you love problem-solving and analysis, start as a Data Analyst. If you enjoy coding and systems, a Data Engineer might be your path.
Published By:
Mirza Yasir Abdullah Baig
Repost This Article and built Your Connection With Others
0 notes
Text
Revolutionizing Data Storage: An In-Depth Analysis of the Database Management System Market
The global database management system market size was estimated at USD 100.79 billion in 2023 and is expected to grow at a CAGR of 13.1% from 2024 to 2030. Organizations across industries are undergoing digital transformation to enhance their operations, customer experiences, and business models. This transformation requires advanced DBMS solutions to manage complex data environments effectively. In addition, the exponential increase in data generation from various sources, including social media, IoT devices, and enterprise applications, necessitates robust database management system (DBMS) solutions to manage, store, and analyze this vast amount of data.
The increasing importance of big data analytics for decision-making and gaining competitive insights is driving the demand for the DBMS market. Advanced analytics and real-time data processing capabilities are essential for extracting value from big data. The shift towards cloud computing is a significant driver for the DBMS market. Cloud-based DBMS solutions offer scalability, flexibility, and cost-efficiency, making them efficient for businesses of all sizes. Furthermore, the integration of artificial intelligence and machine learning technologies in DBMS enhances data processing, management, and analysis capabilities. AI-powered DBMS can automate tasks, provide predictive insights, and improve overall efficiency.
The rise of NoSQL databases, which are designed for unstructured data and scalable, distributed systems, is driving market growth. These databases are particularly popular in various applications such as social media, e-commerce, and big data analytics. The adoption of microservices architecture in software development requires flexible and scalable DBMS solutions to manage data across distributed environments. Advancements in DBMS technology, such as in-memory databases and distributed databases, offer improved performance and scalability.
Global Database Management System Market Report Segmentation
This report forecasts revenue growth at global, regional, and country levels and provides an analysis of the latest industry trends in each of the sub-segments from 2017 to 2030. For this study, Grand View Research has segmented the global database management system market report based on type, deployment, organization size, vertical, and region:
Type Outlook (Revenue, USD Million, 2017 - 2030)
Relational
Non-relational
Deployment Outlook (Revenue, USD Million, 2017 - 2030)
Cloud
On-premises
Organization Size Outlook (Revenue, USD Million, 2017 - 2030)
Large Enterprises
SMEs
Vertical Outlook (Revenue, USD Million, 2017 - 2030)
BFSI
IT & Telecom
Retail & E-commerce
Healthcare & Life Sciences
Government
Manufacturing
Media & Entertainment
Others
Regional Outlook (Revenue, USD Million, 2017 - 2030)
North America
US
Canada
Mexico
Europe
UK
Germany
France
Asia Pacific
China
India
Japan
Australia
South Korea
Latin America
Brazil
MEA
UAE
South Africa
KSA
Key Database Management System Companies:
The following are the leading companies in the database management system market. These companies collectively hold the largest market share and dictate industry trends.
Amazon Web Services
Google Cloud
International Business Machines Corporation
Microsoft
MongoDB, Inc.
Oracle
Redis
SAP SE
Snowflake Inc.
Teradata
Order a free sample PDF of the Database Management System Market Intelligence Study, published by Grand View Research.
0 notes
Text
Btech Computer Science
BTech in Computer Science: An Overview
Bachelor of Technology (BTech) in Computer Science is an undergraduate degree program that equips students with the knowledge and skills required to succeed in the dynamic field of computer science. This program typically spans four years and is designed to provide a deep understanding of computer systems, software development, algorithms, data structures, networking, and emerging technologies.
In today’s digital age, computer science plays a central role in driving innovation, shaping industries, and influencing almost every aspect of our lives. From artificial intelligence (AI) and machine learning (ML) to cloud computing and cybersecurity, a BTech in Computer Science opens doors to a wide range of career opportunities.
This article will explore the key aspects of a BTech in Computer Science, including its curriculum, career prospects, skills developed, and its significance in the ever-evolving tech landscape.
1. Curriculum of BTech Computer Science
The BTech in Computer Science curriculum is designed to provide a balanced blend of theoretical concepts and practical applications. The program typically includes courses in mathematics, programming, computer architecture, data structures, algorithms, databases, and software engineering. Here's an overview of the core subjects that students encounter during their studies:
Year 1: Foundation Courses
Mathematics: Topics such as calculus, linear algebra, discrete mathematics, and probability theory are covered in the first year. These are fundamental to understanding algorithms and data structures in computer science.
Programming Languages: Students learn languages such as C, C++, or Python. This is an essential part of the curriculum, as programming forms the backbone of software development.
Introduction to Computer Science: This includes an introduction to basic computer operations, hardware, and software fundamentals.
Year 2: Core Computer Science Courses
Data Structures and Algorithms: This is one of the most important subjects in computer science. Students learn how to organize and manage data efficiently, and how to design and analyze algorithms.
Computer Organization and Architecture: Students learn the structure of computer hardware, including processors, memory, input/output systems, and how they interact with software.
Database Management Systems (DBMS): This course focuses on the design, development, and management of databases, an essential skill for handling data in real-world applications.
Year 3: Advanced Topics
Operating Systems: This subject teaches how operating systems manage hardware and software resources, and how to work with system-level programming.
Software Engineering: Students learn about software development methodologies, project management, and quality assurance practices.
Computer Networks: This course covers the principles and protocols of networking, including the OSI model, TCP/IP, and routing algorithms.
Theory of Computation: This is an advanced topic focusing on automata theory, formal languages, and computational complexity.
Year 4: Specializations and Electives
In the final year, students have the opportunity to choose electives based on their areas of interest. Some of the popular electives include:
Artificial Intelligence (AI) and Machine Learning (ML): Students learn about intelligent systems, algorithms, and techniques used in AI and ML.
Cybersecurity: This course focuses on protecting computer systems, networks, and data from cyber threats.
Cloud Computing: Students learn about cloud architectures, services, and how to develop applications for cloud platforms.
Big Data Analytics: Students gain knowledge of analyzing and processing large datasets using various tools and techniques.
Mobile App Development: This focuses on developing applications for mobile devices using platforms like Android and iOS.
Additionally, students also undertake a final year project that allows them to apply the concepts they have learned throughout the course in a real-world scenario.
2. Skills Developed During the BTech in Computer Science
Throughout the course, students develop a wide range of technical and soft skills, preparing them for a successful career in technology. These skills include:
Technical Skills
Programming and Coding: Students become proficient in multiple programming languages like C, C++, Python, Java, and JavaScript.
Problem Solving: A BTech in Computer Science emphasizes logical thinking and problem-solving, which are essential for developing algorithms and software solutions.
System Design: Students learn how to design scalable and efficient software systems, ensuring they meet real-world requirements.
Data Management: The course provides deep knowledge of databases, including relational databases, NoSQL databases, and big data technologies.
Networking and Security: Knowledge of network protocols, data communication, and cybersecurity practices is a vital part of the curriculum.
Software Development: Students gain experience in the entire software development lifecycle, from design to coding to testing and maintenance.
Soft Skills
Teamwork and Collaboration: Most of the coursework, especially project work, involves collaboration, teaching students to work effectively in teams.
Communication: Students learn to communicate complex technical concepts to non-technical stakeholders, a skill critical for interacting with clients, managers, and team members.
Time Management: Managing deadlines for assignments, projects, and exams develops strong time management skills.
3. Career Opportunities for BTech Computer Science Graduates
A BTech in Computer Science offers a wide range of career opportunities across various industries. As technology continues to evolve, the demand for skilled computer science professionals has been steadily increasing. Here are some of the top career paths for BTech graduates:
Software Developer/Engineer
Software development is one of the most popular career options for computer science graduates. As a software developer, you will design, develop, and maintain software applications across various domains such as web development, mobile applications, gaming, and enterprise software solutions.
Data Scientist/Analyst
With the growing importance of big data, data scientists and analysts are in high demand. These professionals analyze large datasets to extract meaningful insights, helping businesses make data-driven decisions.
Cybersecurity Analyst
Cybersecurity is a rapidly growing field, with organizations looking for experts to protect their systems from cyber threats. Cybersecurity analysts monitor, analyze, and respond to security incidents to safeguard data and infrastructure.
Artificial Intelligence/Machine Learning Engineer
AI and ML engineers build intelligent systems and algorithms that enable machines to learn from data. These professionals work on creating autonomous systems, recommendation algorithms, and predictive models for various industries.
Cloud Architect
Cloud computing has become an essential part of modern infrastructure. Cloud architects design and implement cloud solutions for businesses, ensuring scalability, security, and reliability of applications hosted in the cloud.
Mobile App Developer
With the increasing use of smartphones, mobile app development has become a crucial area in computer science. Mobile app developers create applications for iOS and Android platforms, working on user interface design and functionality.
Systems Analyst
A systems analyst evaluates and designs IT systems for organizations, ensuring that technology solutions meet business requirements and improve overall efficiency.
Researcher/Academic
Graduates interested in academic pursuits can opt for a career in research, either in industry or academia. Computer science research is constantly evolving, with new innovations and technologies being developed regularly.
4. Future of BTech in Computer Science
The future of BTech in Computer Science is extremely promising. The rapid pace of technological advancements means that there will always be a need for skilled computer science professionals. Some of the key areas of growth include:
Artificial Intelligence and Machine Learning: AI and ML continue to evolve, with applications across industries ranging from healthcare to finance to autonomous vehicles.
Quantum Computing: As quantum computing becomes more advanced, computer scientists with specialized knowledge in this field will be in high demand.
Blockchain Technology: Blockchain has applications beyond cryptocurrencies, including supply chain management, voting systems, and secure transactions.
Internet of Things (IoT): The IoT revolution will create new opportunities for computer science professionals to develop connected devices and systems.
Robotics: Robotics is expected to grow significantly, particularly in automation and manufacturing industries.
Conclusion
A BTech in Computer Science provides students with a strong foundation in both theoretical and practical aspects of computing, preparing them for a wide range of career opportunities in the tech industry. With the world increasingly relying on technology, the demand for computer science professionals is expected to continue to rise.
In addition to technical expertise, graduates develop critical thinking, problem-solving, and communication skills, which are essential for success in the modern workforce. Whether pursuing software development, data science, AI, or cybersecurity, a BTech in Computer Science can lead to a fulfilling and rewarding career in one of the most dynamic and rapidly evolving fields of our time.
#BTech#ComputerScience#TechEducation#SoftwareEngineering#Coding#Programming#ArtificialIntelligence#MachineLearning#DataScience#Cybersecurity#TechCareers#CloudComputing#MobileAppDevelopment#BigData#IoT#Blockchain#TechInnovation#TechStudents#STEM#FutureOfTech#ComputerScienceDegree#TechSkills#TechTrends#InnovationInTech#AI#SoftwareDevelopment#EngineeringDegree#Technology#DigitalTransformation#Computing
1 note
·
View note
Text
Best Computer Courses To Boost Your Professional Skills
1. Introduction
In today’s digital world, computers have become an integral part of our daily lives. Whether it’s for work, education, or entertainment, knowing how to operate a computer efficiently is essential. Computer courses provide structured learning, which can help individuals develop the skills necessary to excel in this tech-driven era.
Computer course options are vast, ranging from beginner-level training to advanced professional development. These courses not only boost technical proficiency but also open doors to various career opportunities. This article explores the significance of computer courses, types, benefits, and how to choose the best one for your needs.
2. Why is a Computer Course Important?
Future Career Opportunities
With the increasing reliance on technology, computer courses can help you stay competitive in the job market. Many industries, including finance, healthcare, and IT, require skilled professionals who are proficient with computer systems. By taking a computer course, you can enhance your employability and increase your chances of landing a high-paying job.
Enhances Technical Skills
Technical skills are no longer optional. Today’s professionals need to understand not just basic software like Word and Excel but also more advanced tools used in data analysis, web development, or cybersecurity. A computer course allows you to master these tools and technologies, making you an asset to any company.
3. Types of Computer Courses
Basic Computer Courses
Basic computer courses cover essential topics like operating systems, office software (Word, Excel, PowerPoint), and internet browsing. These courses are ideal for beginners and those looking to improve their digital literacy. Common courses in this category include:
Microsoft Office
Internet Browsing Basics
Email Management
Advanced Computer Courses
For those with a foundational understanding of computers, advanced courses focus on more technical subjects like programming, networking, and database management. These include:
Software Development
Networking and Security
Database Management Systems (DBMS)
Specialized Computer Courses
These courses are tailored for specific fields like data science, AI, or digital marketing. They are perfect for individuals looking to specialize in a particular area. Popular options include:
Machine Learning
Web Development
Graphic Designing
4. Popular Computer Courses in Demand
Data Science and AI
With the rise of big data, data science and AI have become some of the most sought-after skills in the tech industry. These fields focus on analyzing data to gain insights, build predictive models, and develop intelligent systems.
Python for Data Science
Machine Learning Algorithms
Web Development
Web development remains a key area in the IT industry. Learning how to create websites, web applications, and mobile apps can lead to a rewarding career. Common skills include:
HTML, CSS, JavaScript
React, Angular
Cybersecurity
As cyber threats become more sophisticated, cybersecurity experts are in high demand. A computer course in cybersecurity equips you with the tools and knowledge to protect networks, systems, and data.
Network Security
Ethical Hacking
5. How to Choose the Right Computer Course?
Choosing the right computer course depends on your career goals, interests, and skill level. Here are some key factors to consider:
Skill Level: Are you a beginner or an advanced learner?
Career Goals: Do you want to work in IT, marketing, or design?
Certification: Does the course provide recognized certifications?
Make sure to research the curriculum, course duration, and instructor experience before committing to any program. Online platforms like Coursera, Udemy, and edX offer flexible learning options.
6. Benefits of Pursuing a Computer Course
Improved Job Opportunities
Completing a computer course significantly improves your job prospects. You will have a competitive edge over those with limited technical knowledge. Moreover, many employers prioritize candidates who are skilled in software and programming.
Skill Enhancement
Pursuing a computer course helps you learn new tools and technologies, making you more adaptable in a rapidly changing work environment. Whether it’s mastering new software or learning to code, these skills will enhance your overall professional value.
7. Conclusion
In conclusion, computer courses are essential for anyone looking to succeed in the modern workforce. Whether you are just starting or seeking to advance your skills, there is a course for every level. These courses open up endless career possibilities and help you stay ahead of the technological curve.
Investing in a computer course can offer long-term rewards, from skill enhancement to improved job prospects. So, choose the course that best aligns with your interests and take the first step toward a brighter future!
IPA OFFERS:-
Computer Accounting Course ,
Diploma in Taxation law,
Best courses after 12th Commerce ,
after b com which course is best ,
Diploma in finance ,
SAP fico Course fee ,
BAT Course ,
GST Course fee ,
Computer Course in delhi ,
Payroll Course in Delhi,
Online Tally course ,
One year course diploma after b com ,
Advanced Excel classes in Delhi ,
Diploma in computer application course
Data Entry Operator Course,
diploma in banking finance ,
stock market trading Course ,
six months course
Income Tax
Accounting
Tally
Career

0 notes
Text
Running a Classification Tree
Objective:
The goal of this analysis was to model the relationship between life expectancy and various socioeconomic and environmental predictor variables using a decision tree approach in SAS (PROC HPSPLIT). The objective was to identify the most influential predictors of life expectancy and understand how different factors contribute to its variation.
Code:
Libname data '/home/u47394085/Data Analysis and Interpretation';
Proc Import Datafile='/home/u47394085/Data Analysis and Interpretation/gapminder.csv' Out=data.Gapminder Dbms=csv replace; Run;
Proc Means Data=data.Gapminder NMISS; Run;
Data Gapminder_Decision_Tree; Set data.Gapminder; If incomeperperson =. OR alcconsumption =. OR armedforcesrate =. OR breastcancerper100th =. OR co2emissions =. OR femaleemployrate =. OR hivrate =. OR internetuserate =. OR lifeexpectancy =. OR oilperperson =. OR polityscore =. OR relectricperperson =. OR suicideper100th =. OR employrate =. OR urbanrate =. Then Delete; Run;
Proc Means Data=Gapminder_Decision_Tree NMISS; Run;
Ods Graphics On;
Proc Hpsplit Data=Final_Decision_Tree; Model lifeexpectancy = incomeperperson alcconsumption armedforcesrate breastcancerper100th co2emissions femaleemployrate hivrate internetuserate oilperperson polityscore relectricperperson suicideper100th employrate urbanrate; grow variance; prune costcomplexity; Run;
Output:

Results Interpretation:
Model Structure & Performance:
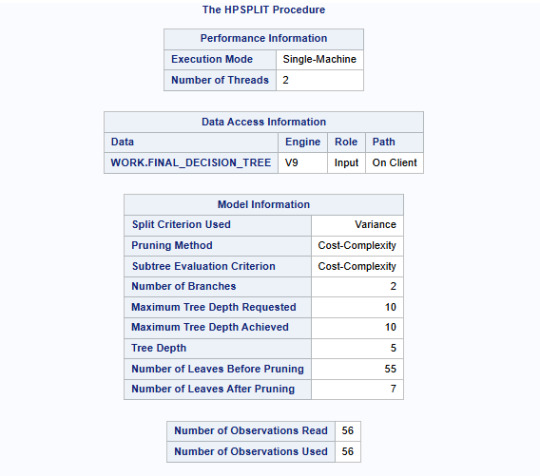
The split criterion used was variance, meaning the tree split at points where it minimized the variance in life expectancy.
The cost-complexity pruning method was used to avoid overfitting.
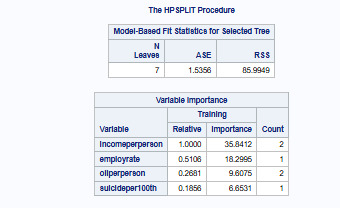
Maximum tree depth achieved: 10, but after pruning, the final tree had 7 leaves, suggesting an optimal level of complexity.
Key Predictors of Life Expectancy:
Income per person was identified as the most important predictor (Relative Importance = 1.000, Highest Importance Score: 35.34).
Other notable predictors included:
Employment rate (Relative Importance = 0.5108)
Oil consumption per person (Relative Importance = 0.2681)
Suicide rate per 100,000 (Relative Importance = 0.1856)
The tree shows that higher-income countries generally have higher life expectancy, but factors like employment rate and oil consumption modify the effect.
Prediction Accuracy & Model Fit:
ASE (Average Squared Error): 1.5356 (indicates reasonable model performance).
Residual Sum of Squares (RSS): 85.99 (suggests some remaining unexplained variability).
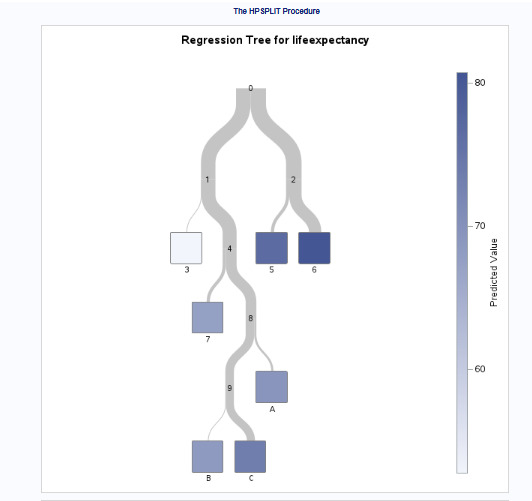
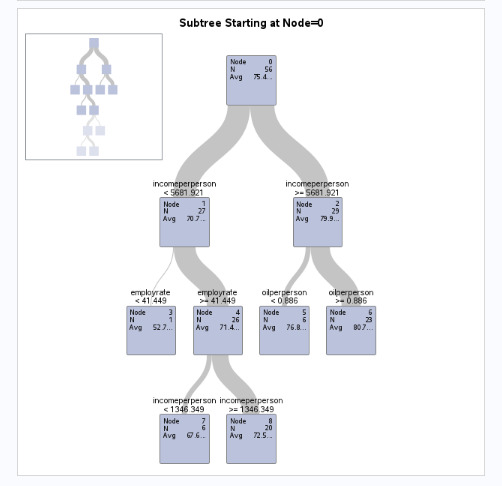
Decision Tree Interpretation:
The root node starts at an average life expectancy of 75.4 years.
The first split occurs at income per person = 5681.921, separating higher and lower-income groups.
Further splits refine the prediction using employment rate and oil consumption.
Final Verdict
Life expectancy is primarily driven by income per person, with employment rate and oil consumption playing modifying roles.
The final pruned tree balances model complexity and interpretability, making it a useful tool for policy-making in health and economics.
0 notes
Text
Key Computer Engineering Degree Courses

Computer Engineering is a vast field, merging hardware and software expertise for designing new technologies. The students at TCCI Computer Coaching Institute are prepared for the future with courses in keeping with essential topics of a Computer Engineering degree. Here are the key subjects that should be learned:
Programming Fundamentals
Languages such as C, C++, Java, and Python are basic. They train students in logical thinking and problem-solving, which are essential in software development and computational work.
Data Structures and Algorithms (DSA)
Knowing how data is structured and processed is very important to coding efficiently and solving problems. Concepts include stacks, queues, trees, and graph algorithms.
Database Management Systems (DBMS)
Learn the principles of handling data with relational databases like MySQL, PostgreSQL, and MongoDB. DBMS knowledge is crucial for backend development and in data-driven applications.
Computer Networks
It delves into communication protocols, internet functionality, and network security, preparing them to build or manage a network.
Operating Systems (OS)
A student learns how operating systems work, including memory management, process scheduling, and system security, preparing for systems programming roles.
Software Engineering
This subject focuses on software development methodologies, such as Agile practices, project management, and quality assurance.
Web Development
This course combines HTML, CSS, JavaScript, and the latest frameworks to prepare students for responsive and user-friendly websites.
Artificial Intelligence and Machine Learning (AI/ML)
As an emerging core area, AI/ML includes predictive modeling, neural networks, and the design of intelligent systems.
Embedded Systems
This course is fundamental for the development of IoT devices and robotics, focusing on hardware-software integration.
Cybersecurity
Cybersecurity teaches cryptography, secure communication, and cyber threat defense, ensuring solid security in digital environments.
Why Choose TCCI for These Courses?
At TCCI Computer Coaching Institute, we offer:
Experienced Faculty: Experts with industry experience.
Customized Learning: Courses tailored to skill levels.
Practical Training: Real-world projects for better understanding.
Flexible Timings: Classes to fit your schedule.
Whether you seek a degree or professional advancement in the field of Computer Engineering, TCCI equips you with the knowledge and the expertise to succeed.
Enroll now and shape your future in technology!
Call now on +91 9825618292
Get information from https://tccicomputercoaching.wordpress.com/
#TCCI computer coaching institute#Best computer courses near me#Computer engineering courses Ahmedabad#Best computer training Bopal Ahmedabad#Best computer courses in Iskon crossroad Ahmedabad
0 notes
Text
Why Data Models Matter in DBMS
Discover the crucial role of data models in database management systems (DBMS). Learn how they help in structuring data, ensuring consistency, and improving database efficiency and integrity.
0 notes
Text

Crypto Exchange Development Process - Expert Insights 2024
The cryptocurrency landscape has seen unprecedented growth over the past few years, making crypto exchanges a central pillar in the digital economy. For businesses looking to launch a crypto exchange, understanding the development process is essential. A well-structured, efficient development process is key to delivering a secure, user-friendly, and compliant exchange platform. Here, we’ll take a closer look at the core stages involved in developing a crypto exchange, along with expert insights on industry best practices for 2024.
The Strategic Importance of Crypto Exchanges
A crypto exchange provides users with a platform to buy, sell, and trade digital assets. It can offer a range of functionalities, from basic trading and market analysis to more advanced features like lending, staking, and cross-chain interoperability. Given the rapid evolution in the crypto space, launching an exchange is a strategic move for businesses to expand into the growing market of digital finance. Additionally, operating a crypto exchange offers multiple revenue streams, such as trading fees, withdrawal charges, and premium service subscriptions.
Key Stages of Crypto Exchange Development
Developing a crypto exchange platform requires a systematic approach to ensure security, scalability, and regulatory compliance. Here’s a breakdown of the essential steps involved:
1. Market Research and Requirement Analysis
The first step in developing a crypto exchange is thorough market research to understand the target audience, regional regulations, and competitor offerings. This analysis helps businesses define unique selling points (USPs) for their exchange and decide on the features to be incorporated.
Experts suggest identifying:
Target market demands and pain points
Competitor strategies and feature sets
Regional legal requirements and compliance standards
2. Choosing the Right Type of Crypto Exchange
Crypto exchanges can vary significantly in their structure and functionality. The choice between a centralized exchange (CEX), decentralized exchange (DEX), or hybrid model depends on the business’s objectives, target audience, and regulatory environment.
Centralized Exchanges (CEX): These platforms offer greater liquidity and faster trading but require robust security and regulatory measures.
Decentralized Exchanges (DEX): A DEX provides users with more privacy and control but may come with lower liquidity and a more complex user experience.
Hybrid Exchanges: These aim to offer the best of both worlds, combining high liquidity and security with some elements of decentralization.
3. Architecture Design and Technology Stack Selection
A successful crypto exchange relies on a solid and scalable architecture. This involves selecting a technology stack that can handle high volumes of transactions and prevent downtime, especially during market surges.
Typical components of an exchange architecture include:
Database Management System (DBMS): Manages all transaction data securely.
Matching Engine: The core of the exchange, which matches buy and sell orders.
Wallet Integration: Manages cryptocurrency deposits, withdrawals, and storage.
API Layer: Allows integration with external services like market data providers and liquidity sources.
Experts advise using high-performance, scalable databases like MongoDB or PostgreSQL and ensuring compatibility with popular programming languages like Python, Java, or C++.
4. Security Measures Implementation
Security is paramount for crypto exchanges, as they are common targets for cyber-attacks. A well-developed exchange integrates several layers of security, including:
Encryption Protocols: For securing sensitive data.
Two-Factor Authentication (2FA): To protect user accounts.
Cold and Hot Wallet Management: Cold wallets store funds offline for added security, while hot wallets are used for active transactions.
DDoS Protection: Prevents denial-of-service attacks that can disrupt exchange operations.
In addition to these measures, regular security audits and penetration testing are essential for identifying vulnerabilities before they can be exploited.
5. Liquidity Management
High liquidity is essential to ensure smooth transactions on an exchange. To achieve this, exchanges can integrate with external liquidity providers or employ liquidity management solutions.
Strategies for enhancing liquidity include:
Market Making: Engaging in market-making activities to increase trading volume.
Partnering with Liquidity Providers: Linking with third-party providers to improve market depth.
Order Book Sharing: Collaborating with other exchanges to access larger liquidity pools.
6. Compliance and Regulatory Adherence
The crypto industry is subject to an evolving regulatory landscape, making compliance a key consideration for any crypto exchange. Ensuring adherence to Anti-Money Laundering (AML) and Know Your Customer (KYC) requirements is crucial for obtaining regulatory approval and building user trust.
Expert Insight: "In 2024, regulatory scrutiny on crypto exchanges has intensified. Failing to comply with regulations can lead to penalties and even shutdowns. It’s essential to work with legal experts to stay updated on the latest regulatory developments."
7. Developing User Experience (UX) and User Interface (UI)
User experience is a critical aspect of a successful exchange, as it impacts user satisfaction and retention. A simple, intuitive interface that offers clear navigation and responsive design ensures users can easily access features like trading, withdrawals, and support.
Elements to focus on include:
Dashboard Design: Displaying key trading data and balances at a glance.
Mobile Compatibility: Mobile trading is on the rise, making it essential for exchanges to offer seamless mobile experiences.
Onboarding Process: A quick and simple registration and verification process enhances user experience.
8. Testing and Quality Assurance
Before launch, rigorous testing ensures the exchange is secure, stable, and user-friendly. This involves:
Security Testing: Identifying and resolving any security vulnerabilities.
Load Testing: Verifying performance under high transaction volumes.
User Acceptance Testing (UAT): Ensuring the platform meets user expectations and provides a satisfactory experience.
9. Launch and Ongoing Maintenance
After development and testing, the exchange is ready for launch. However, maintenance is crucial to address emerging bugs, security issues, and updates. Ongoing improvements and new feature rollouts help retain users and keep the platform competitive.
Trending Features for Crypto Exchanges in 2024
For a crypto exchange to stand out, offering advanced features is essential. Here are some features that have become a must-have in 2024:
AI-Powered Trading Tools: AI-driven insights and automated trading bots are popular, assisting users in managing their portfolios.
Cross-Chain Compatibility: Allowing users to trade assets across different blockchains seamlessly.
Advanced Security Protocols: Features like multi-signature wallets, biometric authentication, and fraud detection systems enhance security.
DeFi Integrations: Direct access to decentralized finance services like lending, staking, and yield farming can attract a broader user base.
Social and Copy Trading: Enabling users to follow and replicate the strategies of experienced traders adds a community aspect.
Final Thoughts
Developing a crypto exchange in 2024 requires strategic planning and a comprehensive approach. Partnering with an experienced crypto exchange software development company is crucial for building a platform that meets high standards of security, usability, and regulatory compliance. By integrating the latest trending features and ensuring robust security and liquidity, businesses can create a competitive and successful crypto exchange that meets the demands of today’s users.
#cryptocurrencies#crypto exchange software development#cryptocurrency exchange platform development#white-label crypto exchange development#cryptocurrency exchange development services
0 notes
Text
Essential Skills for Data Analytics: What to Learn Before You Enroll
As the demand for data analytics professionals continues to rise, aspiring data analysts must equip themselves with the necessary skills to thrive in this dynamic field. Enrolling in a comprehensive data analytics course is an excellent step toward a successful career. However, before you dive into your studies, it's crucial to understand the essential skills that will set you up for success.

1. Statistical Knowledge
At the heart of data analytics lies statistics. A solid grasp of statistical concepts is vital for interpreting data and making informed decisions. You'll need to understand descriptive statistics (mean, median, mode), inferential statistics (hypothesis testing, confidence intervals), and various probability distributions. This foundation will enable you to analyze data trends, assess the reliability of data, and draw meaningful conclusions.
2. Proficiency in Programming Languages
Programming is an indispensable skill for data analysts. Familiarity with languages such as Python and R is essential, as these languages are widely used in data analysis for tasks like data manipulation, statistical analysis, and machine learning. Python, for example, offers libraries like Pandas and NumPy that streamline data handling, while R excels in statistical modeling and visualization.
Incorporating a data analytics course like those offered by Imarticus Learning can significantly enhance your programming skills. Their curriculum emphasizes hands-on experience with these languages, ensuring you gain practical knowledge that can be directly applied in real-world scenarios.
3. Data Visualization Skills
The ability to visualize data effectively is another crucial skill for data analysts. Data visualization transforms complex datasets into clear, understandable representations. Mastery of tools like Tableau, Power BI, or Matplotlib in Python allows you to create impactful visualizations that convey insights effectively to stakeholders.
Imarticus Learning’s data analytics course includes modules focused on data visualization techniques, enabling you to present your findings in a visually compelling way. This skill is particularly important, as organizations increasingly rely on data storytelling to drive strategic decisions.
4. Understanding of Data Management
Data analysts often work with large datasets, making data management skills essential. Knowledge of database management systems (DBMS) like SQL is critical for querying and managing data efficiently. Understanding how to extract, clean, and manipulate data will be integral to your role.
Imarticus Learning’s course emphasizes the importance of data management, providing hands-on experience with SQL and other relevant tools. This training ensures you develop the capability to handle complex datasets, a skill that employers highly value.
5. Critical Thinking and Problem-Solving
Data analytics is not just about analyzing numbers; it's about interpreting those numbers to solve problems. Strong critical thinking skills enable you to ask the right questions, identify patterns, and derive actionable insights. You'll need to approach data with a problem-solving mindset, applying analytical techniques to real-world business challenges.
6. Communication Skills
Finally, effective communication is essential in data analytics. You’ll need to articulate your findings clearly to non-technical stakeholders. Being able to translate complex data insights into understandable language is crucial for influencing decision-making processes.
Imarticus Learning emphasizes soft skills in its data analytics course, preparing you not only to analyze data but also to communicate your insights effectively. This holistic approach to learning ensures that graduates are well-rounded professionals capable of making an impact in their organizations.
Conclusion
Equipping yourself with the essential skills outlined above is critical before enrolling in a data analytics course. With a strong foundation in statistics, programming, data visualization, data management, critical thinking, and communication, you'll be well-prepared to tackle the challenges of the data analytics landscape. Imarticus Learning offers a comprehensive program that addresses these skills, providing a robust pathway for your career in data analytics. Enroll today and take the first step toward becoming a proficient data analyst!
0 notes
Text
What Are The Technical Requirements For Developing A Fantasy Tennis App?

Fantasy tennis app development is a thriving industry with millions of fans worldwide. Tennis fans from all over the globe are searching for the opportunities to watch their favorite sports from the comfort of their home through smart devices. This technological transformation is changing the way tennis fans connect the game. It allows them to immerse and engage with the game, getting the best fantasy tennis experience at their fingertips.
As per experts’ prediction, the fantasy sports industry will expand it’s reach between 2023 to 2030 at a compound annual growth rate (CAGR) of 14.1%. In this blog, we delve into the world of fantasy sports app development and provide you with valuable insights on its technical requirements and other important factors. This mix of sports excitement and technology could take you on an exciting journey to change the perspective of people regarding fantasy sports through a fantasy app.
What is a fantasy tennis app?
You can use the app to access this online fantasy game. In this case, you can select the players based on how well they perform. and assemble a fictional team to take on other gamers. Do you have any plans to create your own Fantasy Tennis app? and intend to make money off of it? This is a great opportunity for you at the right time.
With the help of Fantasy Tennis Software Solutions, you might consistently generate money. The sponsor promotion, in-app purchases, and entrance fees are the Fantasy Tennis League app's revenue models.
Technical requirements for fantasy tennis app development
Technical requirements including database management systems, hosting services, programming languages, software frameworks, and APIs must be clearly specified before creating a fantasy tennis app can be developed.For an application to be effective, scalable, and satisfy user expectations, it is imperative to comprehend these needs.
1. Programming Languages
A fantasy Tennis App Solution typically involves both front-end and back-end programming languages. For the front-end, languages such as HTML, CSS, and JavaScript are crucial for creating an interactive and visually appealing user interface. On the back-end, Java, PHP, or Ruby are commonly chosen to manage server-side logic and handle database interactions, user authentication, and scoring systems.
2. Frameworks for Development
Utilizing suitable frameworks can streamline the development process. Front-end frameworks like AngularJS, Bootstrap, and Vue.js enhance user interface development and facilitate responsive designs. For mobile app development, frameworks such as Flutter or React Native provide cross-platform solutions that allow a Fantasy Tennis App Developer to build applications for both Android and iOS with a single codebase.
3. Systems for managing databases
Selecting the right Database Management System (DBMS) is essential for effectively managing transactions, storing user data, and player statistics. Popular choices that offer reliable relational and non-relational data storage include MySQL, soluPostgreSQL, and MongoDB. Scalability should be supported by the chosen DBMS to handle increasing user traffic and data volume.
4. Real-Time Data Integration APIs
For a fantasy tennis software to provide player statistics, match details, and real-time scoring, real-time data API integration is a must. Comprehensive data coverage, including live scores, player profiles, and competition details, is provided by APIs like Sportradar's Tennis API. By making use of these APIs, gamers may be guaranteed to receive pertinent and timely information, which improves their gaming experience.
5. Hosting and Server Requirements
A sophisticated hosting setup is necessary to ensure the app's performance and availability. Cloud services such as Amazon Web Services (AWS) or Google Cloud can provide the necessary server infrastructure to handle traffic load and data storage needs. Web servers like Apache and Nginx are recommended for managing web application traffic and ensuring efficient load balancing.
6. Security Measures
Given the sensitivity of user data in fantasy sports, implementing robust security measures is paramount. This includes employing strong encryption protocols for data transmission, secure authentication methods, and regular security audits to identify vulnerabilities. Incorporating features such as two-factor authentication and ensuring compliance with data protection regulations will foster user trust and protect personal information.
By addressing these technical requirements, developers can build a competent fantasy tennis app that not only engages users but also performs reliably and securely.
Tech Stacks for Building a Fantasy Sports App
The selection of the right tech stack is crucial for building a successful fantasy sports mobile app. The right combination of technologies can make all the difference, ensuring your app is not only robust and secure but also user-friendly and scalable. A well-selected tech stack lays the foundation for seamless performance, real-time data processing, and an engaging user experience.
Front-End Programming Languages
CSS, HTML, JavaScript
Back-End Programming Languages
Java, PHP, Ruby
Mobile App Frameworks
AngularJS, BootStrap, Vue.JS, jQuery, Yii2
Database Management
MongoDB, PostgreSQL, MySQL, HBase, MailChimp Integrations, Cassandra.
Web Servers
Apache, Linux
Cloud Servers
Amazon Web Services, Google Cloud Azure
Native Mobile App Development
Kotlin (Android), Swift (iOS)
Cross-Platform App Development
ReactJS, React Native, Flutter
Payment Integrations
PayUMoney, Stripe, PayPal, Braintree
Push Notifications
Twilio, Apple Push Notifications
Conclusion
The above provided details and information discusses the technical requirements for creating a fantasy tennis application. Leveraging modern technologies and adhering to best practices ensures the app delivers a seamless user experience while catering to the evolving needs of fantasy sports enthusiasts.
FAQs
What technologies are needed to develop a fantasy tennis app?
A robust backend (e.g., Node.js or Django), real-time data processing frameworks (e.g., Apache Kafka), cloud services (AWS, Azure), and mobile-friendly front-end technologies like Flutter or React Native are essential.
How can I integrate real-time tennis match data?
Use APIs from official tennis federations or third-party sports data providers to fetch live match statistics and player performance updates.
Is mobile optimization necessary for a fantasy tennis app?
Absolutely! Most users access fantasy sports platforms on mobile devices, so a responsive design and mobile-first approach are crucial.
How do I ensure security in a fantasy tennis app?
Use SSL encryption for data protection, secure payment gateways for transactions, and two-factor authentication (2FA) for user logins.
#Fantasy Tennis Software#Tennis App Solution#Fantasy Tennis App Developer#Fantasy Tennis App Development
0 notes
Text
Enterprise Data Modeling and Enterprise Data Services: The Backbone of Data-Driven Organizations
In the modern world which can be referred to as the world of data and information, the companies have to deal with structured and easily accessible data. Two approaches that are central to leveraging this are Firstly, enterprise data modeling Secondly, enterprise data services. These elements play a crucial role in defining the ways organizations govern, use and safeguard their data resources.
What is Enterprise Data Modeling?
Enterprise data modeling is the process of documenting structures of an enterprise data by designing diagrams. It may be described as a set of procedures for organizing, formalizing and integrating the data elements, and data structures existing in an organization into a usable system. The objective is simple, yet it is widely pursued: it seeks for uniform, properly structured, and easily accessible data at any business unit.
Key Components of Enterprise Data Modeling:
Conceptual Data Model: This is basically a high-level model which defines various entities and their interactions but does not go into the specifics from the business as well as the technological standpoints.
Logical Data Model: This model goes further to identify attributes, relationships, constraints thus making it stronger, but it does not consider the actual database systems.
Physical Data Model: This is the operationalization of the model and the model is then related to a specific DBMS scheme taking into account, for example, performance, storage, or data handling requirements.
Enterprise data modeling gives an integrated view of data and this leads to improved business insight, minimized duplication of data and data quality.
What are Enterprise Data Services?
Enterprise data may therefore be defined as the set processes, tools and systems that enable organizations to deal with data in a structured and efficient manner. These services include such processes as data integration, data governance, data quality management, and data security.
Core Aspects of Enterprise Data Services:
Data Integration: Enterprise data assists in funneling data from several sources and passes through the necessary flow across enterprise applications.
Data Governance: Another important consideration is keeping data compliant, accurate and secure. Data governance also defines rules, regulations, and procedures that define the usage of data in the entire company.
Data Quality Management: This reflects the fact that high quality data that is sourced and reliable is very important. EDS also has procedures that are put in place to provide ways of checking and enhancing the quality of data.
Data Security and Compliance: Security of information and compliance with the requirements of specific sectors are rather important. Enterprise data include a set of tools and protocols that guarantee proper security of data.
The Fusion of Enterprise Data Modeling and Data Service
Enterprise data modeling and enterprise data are two concepts which are associated with each other. At the core of good data services is the data model that gives an understanding on where data is located, accessed and controlled. On the other hand, high-quality data services make sure that data figured in these models are correct and easily retrievable without compromise on security.
The Benefits of Integrating Both Approaches
Improved Decision-Making: When companies and organizations have a proper understanding of the type of data structure applicable and how to access data easily using the sources then it is possible to make better decisions within a shorter duration of time.
Cost Efficiency: Standardized data models and services improve substation practices; this, in turn, reduces expensive errors in data.
Scalability: That is, while business applications and databases are growing, enterprise data modeling and services offer the necessary amount of versatility to address the further expansion of data volumes as well as its increasing complexity.
Conclusion
Consequently, enterprise data modeling and enterprise data services offer a governance, structure, and processes to fully realize the potential of data as an enterprise asset. Together, they define the critical, structural foundation of a data-oriented business, that in addition to successfully organizing data, also effectively applies data to achieve business goals.
0 notes
Text
Data Analysis Tools and Techniques in DY Patil Online MBA

The term 'Data Analysis' is a very familiar word if you are looking for information on DY Patil distance learning MBA. In today's data-for-analytics world, it is essential to know about different tools and techniques for Data analysis. This program introduces you to a few important tools that will make you strong in terms of understanding as well as application of Data Analytics on real projects. The program covers the following common tools for data analysis.
1. Spreadsheet Software
Why It Matters:
Data analysis and computation Spreadsheet software (Microsoft Excel, Google Sheets) As most people have used a spreadsheet at some point, it is accessible to students of all levels.
Key Features:
Organize data- Easily deal with the organized and unorganized form of your needed information.
Formulas and Functions - you can analyze trends, and perform calculations.
Chart and Graph Creation: A good approach to visualize data is by creating graphs or charts.
Tip:
Formulas can be intimidating in the beginning, but mastering SUM, AVERAGE, and IF functions will get you very far Practice is key!
2. Statistical Analysis Software
Overview:
If you want to step the game up a bit more, these are some great programs such as SPSS, SAS, or R for statistical analysis. This software is used for intensive statistical testing and performing big data analysis.
Key Highlights:
In-Depth Analysis: Perform advanced statistical analyses.
Predictive Analytics: These models predict future behavior based on past experiences data.
Cleaning Data: Structuring data in such a way that makes it much simpler to actually read and see the truth of my experience.
Quick Win:
Statistical software — the fact of getting comfortable with one separates you Begin with R, which has been used more widely and the online community is excellent in support.
3. Data Analysis Programming Languages
A Game Changer:
Data analysis is evolving, and programming languages form an integral part of the process- more so now because Python and R are coming into their own concerning data management which saves time as far as getting powerful solutions from your DY Patil Online MBA.
Benefits:
Automating repetitive tasks quickly
Sophisticated Analysis: This involves driving machine learning algorithms for deeper insights.
Library Rich: Get access to many libraries that are made for data manipulation (e.g, Pandas in Python)
Engagement Tip:
Free online resources for learning Python or R e.g., Codecademy where you can start with the basics easily.
4. Business Intelligence Tools
Purpose and Benefits:
Used to visualize big data in easy-to-follow charts, graphs, and tables; Business Intelligence (BI) tools such as Tableau, Power BI, etc. are imperative for enabling stakeholders to make informed decisions easily.
Core Functions:
Dashboards: Maintain real-time data monitoring via interactive dashboards.
Data Integration: Collate data from an array of sources for a comprehensive evaluation.
Easy To Use Interface: For the most part, no programming is needed.
Insider Tip:
Be able to work with one form of BI tool. You will thank me when you are exposing data insights to your fellows, or even at work.
5. Database Management Systems
Understanding the Landscape:
E.g: In the data-land, we will rely on Database Management Systems (DBMS) such as MySQL, Oracle, or Microsoft SQL Server to store and retrieve data.
Primary Functions:
Save all kinds of your data — save a lot of it securely.
SQL Commands: Use structured query language (SQL) to fetch and perform work on data.
Transaction Management: Maintains the integrity and consistency of data between transactions.
Actionable Insight:
Learn the fundamentals of SQL statements Creating, reading, updating, and deleting data are basic operations carried out with data in the realm of data analysis.
Wrapping Up
The data analysis tools and techniques that have been incorporated into DY Patil distance MBA are for you to gain the skills of working with these useful career skills so that when you hit the real world, where there are no help guides around every corner they still have your back. Every tool out there has unique features and people like us need to be experts in using any one or two of them since you never know how many are familiar with the ones that trap you and get placed elsewhere when those guys leave.
#DataAnalysis#MBAOnline#DYPATIL#BusinessIntelligence#DataDriven#OnlineLearning#MBATools#CareerGrowth"
0 notes
Text
Assignment 3
Lasso regression analysis for shrinkage variable selection in the banking system
Introduction:
A personal equity plan (PEP) was an investment plan introduced in the United Kingdom that encouraged people over the age of 18 to invest in British companies. Participants could invest in shares, authorized unit trusts, or investment trusts and receive both income and capital gains free of tax. The PEP was designed to encourage investment by individuals. Banks engage in data analysis related to Personal Equity Plans (PEPs) for various reasons. They use it to assess the risk associated with these investment plans. By examining historical performance, market trends, and individual investor behavior, banks can make informed decisions about offering PEPs to their clients.
In general, banks analyze PEP-related data to make informed investment decisions, comply with regulations, and tailor their offerings to customer needs. The goal is to provide equitable opportunities for investors while managing risks effectively.
SAS Code
LIBNAME mylib "/home/u63879373";
proc import out=mylib.mydata datafile='/home/u63879373/bank.csv' dbms=CSV replace;
proc print data=mylib.mydata;
run;
/*********DATA MANAGEMENT****************/
data new; set mylib.mydata; /*using numerical values for new variables*/
if pep="YES" then res=1; else res=0;
if sex="MALE" then gender=1; else gender=0;
if married="YES" then status=1; else status=0;
if car="YES" then cars=1; else cars=0;
if save_act="YES" then save=1; else save=0;
if current_act="YES" then current=1; else current=0;
if mortgage="YES" then mortg=1; else mortg=0;
ods graphics on;
* Split data randomly into test and training data;
proc surveyselect data=new out=traintest seed = 123 samprate=0.7 method=srs outall;
Run;
* lasso multiple regression with lars algorithm k=10 fold validation;
proc glmselect data=traintest plots=all seed=123;
partition ROLE=selected(train='1' test='0');
model res=age gender income status children cars save
current mortg/selection=lar(choose=cv stop=none) cvmethod=random(10);
RUN;
Dataset
The dataset I used in this assignment contains information about customers in a bank. The Data analysis used will help the bank take know the important features that can affect the PEP of a client from the following features: age, sex, region, income, married, children, car, save_act, current_act and the mortgage.
Id: a unique identification number,
age: age of customer in years (numeric),
income: income of customer (numeric)
sex: MALE / FEMALE
married: is the customer married (YES/NO)
children: number of children (numeric)
car: does the customer own a car (YES/NO)
save_acct: does the customer have a saving account (YES/NO)
current_acct: does the customer have a current account (YES/NO)
mortgage: does the customer have a mortgage (YES/NO)
Figure1: dataset

Lasso Regression
LASSO is a shrinkage and variable selection method for linear regression models. The goal of lasso regression is to obtain the subset of predictors that minimizes prediction error for a quantitative response variable. The lasso does this by imposing a constraint on the model parameters that causes regression coefficients for some variables to shrink toward zero. Variables with a regression coefficient equal to zero after the shrinkage process are excluded from the model. Variables with non-zero regression coefficients variables are most strongly associated with the response variable. Explanatory variables can be either quantitative, categorical or both.
In this assignement, we will use Lasso on the above dataset to identify a set of variables that best predicts the binary response variable which is the pep for the bank customers.
Lasso Regression Analysis
I used the libname statement to call my dataset.
data management: I created new variables that will hold numerical values instead of the string values we had in the table:
for the pep variable res=1; if pep is yes and res=0 otherwise;
if sex="MALE" then gender=1; else gender=0; 0 for Female and 1 for Male
if married="YES" then status=1; else status=0; the customer is married or not
if car="YES" then cars=1; else cars=0; the customer has a car or not
if save_act="YES" then save=1; else save=0; the customet has a saving account or not
if current_act="YES" then current=1; else current=0; the customer has a current account or not
if mortgage="YES" then mortg=1; else mortg=0; the customer has a mortgage or not
The SURVEYSELECT procedure
ODS graphics is turned on for the SAS to plot graphics. The data set is randomly split into a training data set consisting of 70% of the total observations in the data set, and a test data set consisting of the other 30% of the observations as seen in the figure below.
Figure 2

The GLMSELECT procedure
This figure shows information about the Lasso regression. The dependent Variable, res (which is the pep in the bank table), and the LAR selection method used. It also shows that I used as a criterion for choosing the best model, K equals 10-fold cross validation, with random assignments of observations to the folds.
Figure 3
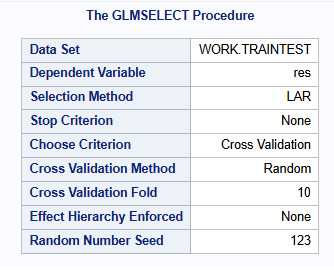
The GLMSELECT procedure
The figure below shows the total number of observations in the data set, 600 observations, which is the same as the number of observations used for training and testing the statistical models.
It shows also the number of parameters to be estimated which is 10 for the intercept plus the 9 predictors.
Figure 4

The LAR Selection summary
The next figure shows information about the LAR selection. It shows the steps in the analysis and the variable that is entered at each step. We can see that the variables are entered as follows, income then status (married or not), then age, and so on.
Figure 5
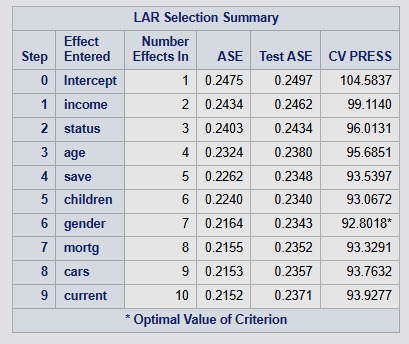
At the beginning, there are no predictors in the model. Just the intercept. Then variables are entered one at a time in order of the magnitude of the reduction in the mean, or average squared error (ASE). The variables are ordered in terms of how important they are in predicting the customer’s PEP. From the figure and according to the lasso regression results, we can see that the most important predictor of the PEP is the customer’s income, then whether the customer is married or not then the age and so on. You can also see how the average square error declines as variables are added to the model, indicating that the prediction accuracy improves as each variable is added to the model.
The CV PRESS shows the sum of the residual sum of squares in the test data set. There's an asterisk at step 6. This is the model selected as the best model by the procedure since it is the model with the lowest summed residual sum of squares and that adding other variables to this model, actually increases it.
Finally, we can see that the training data ASE continues to decline as variables are added. This is to be expected as model complexity increases.
Coefficient Progression
Next figure shows the change in the regression coefficients at each step, and the vertical line represents the selected model. The plot shows the relative importance of the predictor selected at any step of the selection process, how the regression coefficients changed with the addition of a new predictor at each step as well as the steps at which each variable entered the model. For example, as also indicated in the summary table above, the customer’s income has the largest regression coefficient, followed by married then the age.
We can also see that the number of children and whether the customer has a mortgage or not are negatively associated with the PEP.
The lower plot shows how the chosen selection criterion, in this example CVPRESS, which is the residual sum of squares summed across all the cross-validation folds in the training set, changes as variables are added to the model.
Initially, it decreases rapidly and then levels off to a point in which adding more predictors doesn't lead to much production in the residual sum of squares.
Figure 6

Fit criteria for pep
The figure plot shows at which step in the selection process different selection criteria would choose the best model. Interestingly, the other, criteria selected more complex models, and the criterion based on cross validation, possibly selecting an overfitted model.
Figure 7
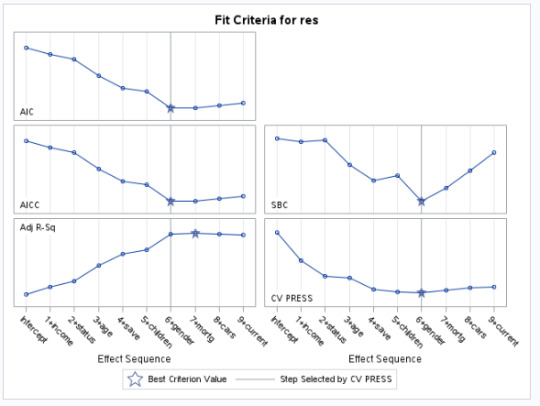
Progression of average square errors by Role for the PEP (res)
The next figure shows the change in the average or mean square error at each step in the process. As expected, the selected model was less accurate in predicting the PEP in the test data, but the test average squared error at each step was pretty close to the training average squared error especially for the first important variables.
Figure 8
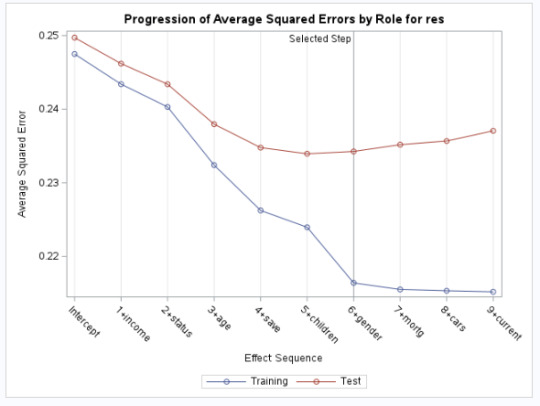
Analysis of variance
The figure below shows the R-Square (0.1256) and adjusted R-Square (0.1129) for the selected model and the mean square error for both the training (0.21)and test data (0.23).
Figure 9
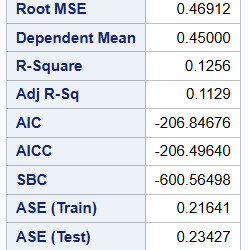
Parameter estimates
The goal of lasso regression is to obtain the subset of predictors that minimizes prediction error for a quantitative response variable. Variables with a regression coefficient equal to zero after the shrinkage process are excluded from the model. So, we can see from the results that the two variables current_act and car variables were excluded as they are not associated with the PEP response variable. The other variables age, sex(gender), and income variables are most strongly associated with the response variable.
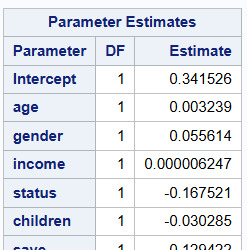
Conclusion
Lasso regression is a supervised machine learning method often used in machine learning to select the subset of variables. It is a Shrinkage and Variable Selection method for linear regression models. Lasso Regression is useful because shrinking the regression coefficient can reduce variance without a substantial increase in bias. However, without human intervention, variable selection methods could produce models that make little sense or that turn out to be useless for accurately predicting a response variable in the real world. If machine learning, human intervention, and independent application are combined, we will get better results and therefore better predictions.
0 notes
Text
Assignment 2:
Finding important features to predict the personal equity plan (PEP) in the banking system
Introduction:
A personal equity plan (PEP) was an investment plan introduced in the United Kingdom that encouraged people over the age of 18 to invest in British companies. Participants could invest in shares, authorized unit trusts, or investment trusts and receive both income and capital gains free of tax. The PEP was designed to encourage investment by individuals. Banks engage in data analysis related to Personal Equity Plans (PEPs) for various reasons. They use it to assess the risk associated with these investment plans. By examining historical performance, market trends, and individual investor behavior, banks can make informed decisions about offering PEPs to their clients.
In general, banks analyze PEP-related data to make informed investment decisions, comply with regulations, and tailor their offerings to customer needs. The goal is to provide equitable opportunities for investors while managing risks effectively.
SAS Code
proc import out=mydata
datafile="/home/u63879373/bank.csv"
dbms=csv
replace;
getnames=YES;
PROC SORT; BY id;
ods graphics on;
PROC HPFOREST;
target PEP/level=nominal; /*target variable*/
input sex region married children car save_act current_act mortgage /level=nominal;
input age income /level=interval ;
RUN;
Dataset
The dataset I used in this assignment contains information about customers in a bank. The Data analysis used will help the bank take know the important features that can affect the PEP of a client from the following features: age, sex, region, income, married, children, car, save_act, current_act and the mortgage.
Id: a unique identification number,
age: age of customer in years (numeric),
income: income of customer (numeric)
sex: MALE / FEMALE
married: is the customer married (YES/NO)
region: inner_city/rural/suburban/town
children: number of children (numeric)
car: does the customer own a car (YES/NO)
save_acct: does the customer have a saving account (YES/NO)
current_acct: does the customer have a current account (YES/NO)
mortgage: does the customer have a mortgage (YES/NO)
Figure1: dataset

Random Forest
Random forests are predictive models that allow for a data driven exploration of many explanatory variables in predicting a response or target variable. Random forests provide important scores for each explanatory variable and also allow you to evaluate any increases in correct classification with the growing of smaller and larger number of trees.
Random forest was used on the above dataset to evaluate the importance of a series of explanatory variables in predicting a binary, categorical response variable (PEP).
Following the import to import the dataset, I will include PROC HPFOREST. Next, I name my response, or target variable, PEP which is a nominal variable.
For the input statements I indicate the following:
Sex, region, married, children, car, save_act, current_act, and mortgage are nominal variables (categorical explanatory variables).
Age and income are interval variables (Quantitative explanatory variables).
Random Forest Analysis:
After running the code above we get the following results:
Model information
Figure2: Model of Information

We can see from the model that variables to try is equal to 3, indicating that a random selection of three explanatory variables was selected to test each possible split for each node in each tree within the forest.
SAS will grow 100 trees by default and select 60% of their sample when performing the bagging process (inbag fraction=0.6).
The prune fraction is equal to the default value: 0 which means that the tree is not to prune.
Leaf size specifies the smallest number of training observations that a new branch can have. The default value is 1.
The split criteria used in HPFOREST is the Gini index.
Missing value: Valid value since the target variable is not missing.
Number of Observations
Figure 3

The number of observations read from my data set is the same as the number of observations used (N= 600 for both number of observations).
For the baseline fit statistics output, the misclassification rate of the RF is 0.457. So, the algorithm misclassified 45.7% of the sample and the remaining 54.3% of the data were correctly classified (1-0.457=0.543).
Fit Statistics for 1 to 100 number of trees
PROC HPFOREST computes fit statistics for a sequence of forests that have an increasing number of trees. As the number of trees increases, the fit statistics usually improve. And this can be seen by the decreasing value of the average square error as the number of trees increases.
for 1 tree ASE (train)=0.1354, ASE (OOB)=0.211
for 10 trees ASE (train)=0.0810, ASE (OOB)=0.178
Figure 4: 10 first forests

for 90 trees ASE (train)=0.0716, ASE (OOB)=0.147
for 100 trees ASE (train)=0.0712, ASE (OOB)=0.146
Figure 5: 10 last forests

For the out of bag misclassification rate (OOB), we can notice that we get a near perfect prediction in the training samples as the number of trees grown gets closer to 100. When those same models are tested on the out of bag sample, the misclassification rate is around 17% (0.172 for 100 number of trees). OOB estimate is a convenient substitute for an estimate that is based on test data and is a less biased estimate of how the model will perform on future data.
Variable Importance Ranking
Figure 6: Loss Reduction Variable Importance

The final table in the output table for the random forest algorithms applied to this dataset which is the variable importance rankings. The number of rules column shows the number of splitting rules that use a variable. Each measure is computed twice, once on training data and once on the out of bag data. As with fit statistics, the out of bag estimates are less biased. The rows are sorted by the OOB Gini measure.
The variables are listed from highest importance to lowest importance in predicting the PEP value. Here we see that some of the most important variables in predicting the PEP for a client is the number of children, then whether he is married or not, whether he has a mortgage or not, whether he has a saving then current accounts, whether he has a car or not, his sex, his region, the income and age come at the end which means those are the least important values to decide determine his PEP value.
Conclusion
Random forests are a type of data mining algorithm that can select from among a large number of variables, those that are most important in determining the target or response variable to be explained. The target and the explanatory variables can be categorical or quantitative, or any combination. The forest of trees is used to rank the importance of variables in predicting the target. In this way, random forests are sometimes used as a data reduction technique, where variables are chosen in terms of their importance to be included in regression and other types of future statistical models.
爆發
0 則迴響
0 notes