#Multi Timeframe Analysis
Explore tagged Tumblr posts
Visit Tumblr Blog
Explore Tumblr blogs with no restrictions, modern design and the best experience.
Last Seen Tumblr Blogs


Fun Fact
Tumblr Inc. is using 66 technologies for its website.
Text
6 RISKY Forex Trades I Took This week!
Feeling the heat of the markets? Over the past three days, I’ve taken six high-conviction trades—five live now, one on deck—and in my latest video I break down exactly why I pulled the trigger, how I managed risk, and what I’m watching next. Whether you’re a seasoned forex trader or just curious how I use fair value gaps across multiple timeframes, this is one you don’t want to miss. What You’ll…
#AUD/CHF#AUD/JPY#CAD/CHF#Chart Analysis#Emotional Discipline#EUR/JPY#Fair Value Gap#Forex Education#Forex Trading#High-Probability Setups#Live Trading#Money Management#Multi-Timeframe Analysis#NZD/CHF#Price Action#Risk Management#Technical Analysis#Trade Breakdown#Trading Strategy#USD/CHF
0 notes
Text
Order of the Black Sun analysis
As always constructive feedback is welcome.
"Alan Moore's back-up strips were an obvious influence on both Marc Platt's view of ye olde Gallifrey and my view of its future (Alien Bodies shares 95% of its .D.N.A. with its closest relative, 4-D War", Lawrence Miles.
Timeline 10,000,000.B.T.W.: The Anchoring. The Order of the Black Sun hired mercenary Fenris fails in his mission to prevent the Timelords from developing physical timetravel but does unintentionally succeed in sending and stranding Omega to the antimatter universe, his timetravel belt's directional control device is taken by Rassilon to be reverse engineeered. Rassilon tricks him him to banishing himself The Zone of No Return as punishment. (.D.W.M.: Stardeath).
9,999,980.B.T.W.: The Timelords retrieve Fenris from The Zone of No Return in order to mindprobe him to learn what they can about their current enemy, discovering only that they are from 30,000 years into the future when a squad Order of the Black Sun operatives who kill Fenris and the mindprobe operator aswell as injuring several others before phasing away. The conflict's nature as a time war is acknowledged. (.D.W.M.: 4D War).
9,999,970.B.T.W.: The Timelords enter into the delicate multi day Desraulturanium trade negeogiations with the Sontarans and to their surprise The Order of the Black Sun. However the Order's representatives are not hostile and they devise a successful joint bid. However the Sontarans disrupt the declaration by mind controling one of the Special Executive into assassinating the Order Elder in front of everyone. This maybe the incident which gets the Order to declare war.
At somepoint soon after 151 .B.T.W.: After their self exile from Gallifrey 1 and reorganisation, Faction Paradox continued their lesser species interference but in the form of creating secret groups telling them, "all the nastiest secrets of the Timelords". One of these groups is the, "Cult of the Black Sun" it's native timeframe is unknown.
30000's: The Order of the Black Sun attack squad's apparent native timeframe.
Somepoint: The First Great Time War is brought to a peaceful conclusion with The Order of the Black Sun somehow realising they had caused the war due to a mistaken assumption and first revenge strike.
10639.5 Rassilon era: While the Eighth Doctor's body healed his mind resided in the Matrix meeting the High Evolutionaries which included the Order member Demoiselle Drin who describes that the conflict as, "ought never to have happened". (.D.W.M.: The Final Chapter).
Notes The Cult/Order is the first Timelord enemy to knowingly use black sun imagery. Whether it's a coincidence like some others or intentional on the Faction's behalf is unknown, (though it must of known about the conflict as it happened before House Paradox was founded). The Order is from the 30000's yet is seen and treated as a respectable Galactic power in the decades after the anchoring. The Order's first/revenge strike against Gallifrey utilising Fenris is perhaps the Faction's largest and only real success agains the Timelords as it has embedded a bootstrap paradox into the Timelord's timetravel development. While it could have been planned the lack of any overt Faction presence or signature suggests otherwise. The First Great Time War is implied to have ended peacefully with the recognition it should/would never have happed to begin with in contrast to The Third & Last Great Time War against the Daleks. An Order member's presence as a High Evolutionary suprises the Eighth Doctor suggesting it wasn't part of the public or recorded peace pomp and circumstance. From the dialogue her actual placement seems recent but the fact she was considered at all says alot. A member in waiting? A secondary tier member? The Order may have be responsible for the black sun radation that turned the Meep species violent. The lack of any Faction style regalia suggests the contact between the two was limited. The Order is a probable Timelord ally in the Third & Last Great Time War.
#DWM#The First Great Time War#The Last Great Time War#Lawrence Miles#marc platt#alan moore#faction paradox#doctor who#bbc doctor who#whoniverse#classic who#classic doctor who#nuwho#modern who#dw#dweu#dw novels#dw books#dw audios#fp#Big Finish#novelisations#eda#vna#the doctor#classic doctors#new doctors#book of the war#the book of the war#timelords
14 notes
·
View notes
Text
Advance Technical Analysis Course – Trade Like a Pro with The Stock Learning
Take your trading skills to the next level with The Stock Learning’s Advance Technical Analysis course. Learn expert-level chart patterns, multi-timeframe analysis, advanced indicators, and real-world trading strategies. Designed for serious traders, this course helps you identify high-probability trades and make smarter, faster decisions in live market conditions.
📊 Enroll now at www.thestocklearning.co.in 🎯 Don’t just follow trends — master them. Join The Stock Learning today and upgrade your trading edge!
#AdvanceTechnicalAnalysis #TheStockLearning #SmartTrading #StockMarketCourse #TradingStrategies
0 notes
Text
9 Market Moves for Strategic Forex Trade Planning

Market Overview
Strategic forex trade planning is now essential as geopolitical risks dominate global sentiment. Israel's pre-dawn strikes on Iran's key military sites, including the Khojir missile facility, and Iran's retaliatory missile launches have sent shockwaves through the markets. Global powers like the U.S., China, and India are urging their citizens to evacuate Tehran. Meanwhile, safe-haven demand, oil volatility, and macro policy catalysts like the upcoming FOMC meeting are influencing both commodities and currency pairs.
COT Reports Analysis
AUD - WEAK (5/5)
GBP - STRONG (5/5)
CAD - WEAK (3/5)
EUR - STRONG (5/5)
JPY - STRONG (2/5)
CHF - WEAK (3/5)
USD - MIXED
NZD - WEAK (3/5)
GOLD - STRONG (4/5)
SILVER - STRONG (5/5)
Market Analysis
GOLD
GOLD prices are influenced by heightened Middle East conflict but remain somewhat subdued. In this environment, strategic forex trade planning demands patience, especially with Gold lingering near historic highs. While the MACD suggests bullish continuation, RSI shows consolidation. We anticipate renewed momentum, aligning with multi-pair forex strategies that emphasize safe-haven assets.
SILVER
SILVER has surged to 13-year highs, diverging sharply from Gold. This breakout reflects heavy capital flow into the metal as a safer alternative. Technicals are aligned for continuation, and traders involved in forex analysis and predictions should monitor how Silver’s strength reshapes correlated setups.
DXY
The Dollar's spike reflects a classic risk-off bid, yet technicals hint at longer-term weakness. Though the MACD and RSI support short-term bullish momentum, overall structures remain bearish. With the FOMC looming, strategic forex trade planning must account for volatility and potential reversals, especially in multi-pair forex strategies.
GBPUSD
The Pound faces pressure ahead of U.K. CPI data. While the MACD and RSI point to more downside, the pair is testing critical support at 1.34294. Traders using price action trading for EUR/USD can adapt this approach to GBP/USD, watching for confirmation before positioning.
AUDUSD
The Aussie is consolidating under pressure from risk-off flows. Despite mixed signals, the broader context aligns with EUR/USD trend analysis and overall market sentiment that favors defensiveness.
NZDUSD
NZD/USD remains in a tight range, with no clear structural break. Until confirmation comes, this pair aligns with broader forex analysis and predictions suggesting hesitance in risk-sensitive currencies.
EURUSD
EUR/USD continues to build a consolidation zone below 1.16110. While short-term momentum is bearish, the broader structure remains bullish. This is a key setup for price action trading for EUR/USD. We await a breakout for directional confirmation, vital for strategic forex trade planning in euro-related setups.
USDJPY
Despite global tensions, the Yen is surprisingly weak. The pair remains in consolidation. A cautious approach is needed, especially when integrating multi-pair forex strategies where both USD and JPY are safe-haven options with divergent reactions.
USDCHF
USD/CHF is testing EMA200. The MACD shows volume growth, but RSI remains flat. With USDCHF in a broader bearish context, we wait for structure to develop. This fits well into forex analysis and predictions based on safe-haven interplay.
USDCAD
USD/CAD shows rising bullish momentum and volume. The MACD and RSI confirm this move, though the longevity of the trend remains questionable. For strategic forex trade planning, watch for exhaustion or confirmation on higher timeframes.
Final Thoughts
Geopolitical risks are front and center, demanding a disciplined and flexible approach to strategic forex trade planning. From EUR/USD trend analysis to metals divergence and safe-haven flows, each asset presents opportunities—but only for those using well-structured multi-pair forex strategies. Stay alert for structural shifts and central bank guidance as volatility remains the dominant theme.
0 notes
Text
Master Market Trends with Advanced Technical Analysis
Take your trading skills to the next level with the Advanced Technical Analysis course at Empirical F&M Academy. Designed for traders who already know the basics, this course dives deeper into: ✅ Advanced chart patterns & multi-timeframe analysis ✅ Volume profile, trend strength, and market structure ✅ Professional indicators like RSI, MACD, Bollinger Bands ✅ Live market sessions with strategy back-testing ✅ Risk management and trade psychology techniques
Perfect for serious traders aiming to make data-driven decisions and increase profits.🔴 Enroll now at Empirical F&M Academy and become an expert in Advanced Technical Analysis! 🔴
0 notes
Text
most profitable forex scalper non repaint mt4 indicator
What is Scalping in Forex?
https://secretindicator.com/product/powerful-true-mt4-scalping-indicator/
telegram channel
Forex scalping is a trading method that focuses on profiting from small price changes. Scalpers typically open and close trades within minutes or even seconds. The key features of scalping are:

High frequency of trades
Small profit per trade (5–15 pips)
High leverage
Strict risk management
What is a Non-Repaint Indicator?
A non-repaint indicator shows trading signals in real time and does not repaint or change the signal once a candle closes. In contrast, repaint indicators can change signals after new price data appears, which may mislead traders into believing a signal was more accurate than it really was.
Why Use Non-Repaint Indicators?
Accuracy: Signals stay consistent once formed.
Backtesting reliability: Historical signals are valid.
Better decision-making: Traders can trust the indicator.
Key Features of the Most Profitable Scalping Indicators
To qualify as a top-performing non-repaint scalping indicator, it must have:
Non-repainting signals
Fast signal generation
Low lag
Clear entry and exit points
High win rate
Customizable alerts (pop-up/email/mobile)
Top 5 Most Profitable Non-Repaint Scalping Indicators for MT4
Let’s explore the best of the best. These indicators are proven to be effective on multiple currency pairs and timeframes (especially M1, M5, M15).
1. X Scalper (Non-Repaint)
X Scalper is a high-performance non-repaint MT4 indicator specifically designed for scalping on lower timeframes.
Features:
100% non-repaint buy/sell signals
Accurate trend direction
Real-time alerts (email, sound, push notification)
Works best on M5 and M15
Custom risk-reward adjustment
Profitability:
Up to 85% accuracy reported on backtests
Average 10–15 trades per session
Best For:
Beginners and professionals looking for clarity and simplicity.
2. Fast Scalper Indicator
The Fast Scalper indicator is tailored for extreme short-term trades, giving signals within seconds of volatility.
Features:
Lightning-fast signal generation
Non-repaint arrow signals
Adaptive to trending and ranging markets
Filters false signals with volatility filter
Profitability:
8–12 pips average gain per trade
70–90% signal success rate in major pairs (EUR/USD, GBP/USD)
3. Super Signal V3
One of the oldest yet highly reliable MT4 indicators, Super Signal V3 is widely respected for its robust non-repaint nature.
Features:
Displays clear arrows (Buy/Sell)
Works on M1 to H1 timeframes
Simple to understand
Clean interface
Profitability:
Average win ratio: 75–80%
Can be combined with RSI or moving averages for higher confirmation
4. Scalper Dream (Ultimate Version)
Scalper Dream is a newer generation MT4 tool that uses a hybrid of machine learning and historical price action.
Features:
AI-powered signal processing
100% non-repaint signals
Multi-timeframe analysis in one window
Automatic take-profit and stop-loss suggestions
Profitability:
Up to 90% accuracy in ranging markets
Adaptive TP based on volatility
Suitable for automated Expert Advisors (EAs)
5. Trend Pulse Pro
A trend-based scalper for aggressive traders. Ideal for scalping during trending conditions.
Features:
Trend strength meter
Visual signal confirmation (color-coded bars)
Alerts with screenshot on signal
Non-repainting confirmation candles
Profitability:
10–30 pips per trade on trending pairs
85%+ accurate when used during London/New York sessions
How to Use These Indicators for Maximum Profit
Using non-repaint indicators is not just about getting signals. Here’s how to maximize profitability:
1. Combine with Price Action
Use support and resistance zones, candlestick patterns, or chart patterns to confirm indicator signals.
2. Stick to High-Liquidity Pairs
Major pairs like EUR/USD, GBP/USD, USD/JPY provide better spread and volatility for scalping.
3. Use Tight Stop Losses
Scalping relies on low-risk setups. Stop losses should be between 5 to 10 pips.
4. Trade During Volatile Sessions
Trade during London and New York sessions for better momentum.
5. Backtest Before Live Trading
Run backtests and demo trades to understand the behavior of the indicator across different conditions.
Sample Strategy Using X Scalper
Here’s a quick example of a simple scalping setup using the X Scalper:
Timeframe: 5-minute chart (M5)
Pair: EUR/USD
Entry: Buy when X Scalper gives a green arrow and candle closes above 20 EMA
Exit: 10 pips target or opposite arrow
Stop Loss: 7 pips
Risk per trade: 1% of capital
Result:
Win rate: 75%
Risk:Reward: 1:1.5
Weekly target: 50–100 pips
Pros and Cons of Using Non-Repaint Indicators for Scalping
Pros:
No false confidence from changing signals
Precise entries and exits
Great for fast strategies
Backtesting is reliable
Easy to automate with EAs
Cons:
May generate fewer signals (to maintain quality)
Not immune to losses in sideways markets
Require high-speed execution (low-latency broker recommended)
Best MT4 Settings and Tips for Scalping Indicators
Use Low Spreads Broker: Look for brokers offering ECN or raw spread accounts.
VPS Hosting: For speed, run your MT4 on a Virtual Private Server (VPS).
One-Click Trading: Enable MT4's one-click trading to reduce entry time.
Avoid High-Impact News: Use economic calendars to avoid major announcements during scalping.
Risk Management: Never risk more than 1–2% per trade.
Frequently Asked Questions (FAQs)
Q1. Can I use multiple non-repaint indicators together?
Yes, combining two or more non-repaint indicators can filter out weak signals and increase accuracy.
Q2. Are these indicators free or paid?
Some are free (like Super Signal V3), while others like X Scalper or Trend Pulse Pro are premium.
Q3. Do non-repaint indicators repaint in real-time?
No, once the candle closes, the signal remains fixed.
Q4. Which timeframe is best for scalping?
M1, M5, and M15 are most common. M5 offers a balance of speed and accuracy.
Q5. Can I automate these indicators?
Yes, you can code Expert Advisors (EAs) around most of these non-repaint indicators.
Conclusion
The most profitable forex scalping indicators for MT4 in 2025 are those that deliver accurate, non-repainting signals, have a strong track record, and fit your personal trading style. Tools like X Scalper, Fast Scalper, Super Signal V3, and Scalper Dream are great assets in a trader’s toolkit. However, no indicator can guarantee 100% success. Success in scalping comes from:
Consistent practice
Good risk management
Fast execution
Emotional discipline
https://secretindicator.com/product/powerful-true-mt4-scalping-indicator/
#forex#forex indicators#forex market#forex ea#forex online trading#forex education#forex factory#forex news#crypto#forex broker#forexsignals#forexlifestyle#forexstrategy#forexsuccess#investors
0 notes
Text
Best Free Tools to Help You Do Better in Competitions

Imagine lining up for a Tradeiators challenge with your demo account primed and charts blinking—then realizing you’re missing the very tools that could help you nail entries, manage risk, and spot momentum before anyone else. From my experience as a trading expert, savvy competitors don’t rely on gut feelings alone; they lean on a suite of free tools to sharpen their edge.
First up, charting platforms like TradingView. Even a free account unlocks multi-timeframe analysis, customizable indicators, and community scripts. You can overlay moving averages and RSI on your candlesticks, then tweak alert triggers so you never miss a breakout. In those fast-paced daily contests, having an alert pop the moment price breaches your level can be the difference between a winning scalp and a missed opportunity.
Next, economic calendars such as the one on ForexFactory. It’s tempting to ignore macro events when you’re stalking intraday moves, but surprise central bank statements or jobs reports can vaporize your unrealized profits. By syncing your contest schedule with major releases—GDP, inflation, nonfarm payrolls—you’ll know exactly when to tighten stops or sit on your hands.
For position sizing and risk calculations, tools like MyFxBook’s position size calculator are indispensable. Input your demo equity, pick your stop-loss distance, and it spits out the precise lot size to cap your risk at, say, 1% per trade. When you’re juggling multiple positions in a trading battle, consistency in risk management keeps your drawdown in check and your ranking steadily climbing.
Don’t overlook sentiment gauges like the IG client sentiment index. It shows the percentage of retail traders long or short a given forex pair. From my observations, extreme readings—say 80% of traders jammed in long—often precede a contrarian move. If everyone’s piled in one direction in a contest, you might find a neat mean reversion scalp.
Lastly, free backtesting utilities embedded in many platforms let you quickly scan your strategy over historical data. You can test a breakout approach or a moving average crossover over the past month’s volatility spikes. That trial-and-error process is how you refine entry filters before the contest bell rings, ensuring you’re not running blind in those high-pressure sessions.
Putting these tools together—TradingView alerts, economic calendars, position size calculators, sentiment gauges, and backtesters—gives you a toolkit that feels almost like having your own research desk. It’s not cheating; it’s smart preparation. With these free resources at your fingertips, your next competition run on Tradeiators might be the one where everything clicks.
1 note
·
View note
Text
Unlock Real-Time Forex & Stock Data for Professional-Grade Quantitative Trading
——Free API + High-Frequency Market Feeds to Seize Millisecond-Level Opportunities
I. The Core Challenge of Quantitative Trading: Data Quality Determines Strategy Success
In the competitive world of financial markets, the success of quantitative trading hinges on real-time availability, completeness, and accuracy of data. Traditional data sources often face three critical limitations:
High Latency: Minute-level delayed data fails to capture micro market movements, missing high-frequency arbitrage opportunities.
Limited Coverage: Narrow asset classes or regional restrictions hinder cross-market strategies.
Unreliable Stability: Data outages or duplicate records distort backtesting results and increase execution risks.
Alltick API delivers professional-grade financial data services, offering developers, traders, and institutions a free API key and ultra-low-latency market feeds (avg. 170ms) across 100,000+ instruments including stocks, forex, and cryptocurrencies. It powers quantitative systems as the ultimate "data engine".
II. Core Advantages of Alltick API: Free Tier + High-Frequency Data
1. Zero-Cost Entry: Free API for Rapid Prototyping
Instant Registration: Create an account via our website or GitHub examples in 5 minutes.
Full Basic Features: Free tier includes 10 instrument queries, 1 WebSocket connection, and 1-year historical data for strategy validation.
2. Millisecond-Level Forex Data, Direct from Top Liquidity Sources
100+ Currency Pairs: Covering majors (EUR/USD, USD/JPY) and emerging pairs (AUD/CAD), sourced directly from global banks and exchanges.
Tick-by-Tick Updates: Receive real-time bid/ask prices and volumes via WebSocket for high-frequency decision-making.
3. Global Stock Market Coverage: HK, US, and A-Shares
30,000+ Equities: Full coverage of Hong Kong (3,000+), US (11,000+), and China A-shares (5,000+) with order book and trade-by-trade data.
Multi-Timeframe OHLC: Flexible intervals from 1-minute to monthly charts for diverse strategies.
4. Enterprise-Grade Reliability & Scalability
99.95% SLA Guarantee: Less than 5 hours annual downtime ensures uninterrupted trading.
Multi-Protocol Support: REST API, WebSocket, and FIX protocols for low-latency to high-frequency needs.
III. Four Key Use Cases for Alltick API
1. High-Frequency Trading (HFT)
Example Strategy: Capture forex arbitrage opportunities using tick-level spread analysis.
Implementation: Subscribe to EUR/USD real-time quotes via WebSocket, trigger orders based on order book patterns.
2. Multi-Asset Portfolio Management
Data Integration: Monitor US tech stocks, gold futures, and Bitcoin simultaneously for risk diversification.
3. Machine Learning Model Training
Historical Data: Train models with 5+ years of tick-level data to reduce overfitting risks.
4. Institutional Risk Management
Real-Time Alerts: Track currency fluctuations via API to minimize cross-border settlement slippage.
IV. Three Steps to Integrate Alltick API
1. Register & Get API Key
Visit Alltick Official Site, sign up via email or Gmail, and generate your token instantly.
2. Run Sample Code (Python)
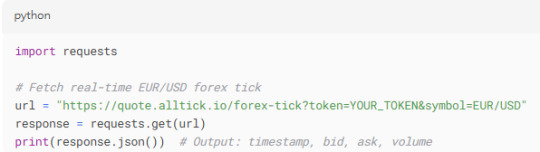
3. Scale with Premium Plans
Upgrade for 1,200+ requests/minute, full-market data, and multi-WebSocket connections.
V. Client Success Stories: Data-Driven Profit Growth
Hong Kong Quant Fund: Boosted annual returns by 15% using Alltick’s HK stock tick data.
Cross-Border Payment Platform: Reduced settlement slippage by 70%, saving $50k+ daily.
Act Now!
Whether you’re an individual developer, startup, or financial institution, Alltick API combines zero-barrier free access with institutional-grade data to accelerate your strategy deployment.
Visit [Alltick API] now!!!

0 notes
Text
Why MetaTrader 5 Is the Future of Online Trading

MetaTrader 5 (MT5) has revolutionized the way traders operate in the financial markets. Unlike its predecessor MT4, MetaTrader 5 offers multi-asset capabilities, faster processing, advanced charting tools, and a more intuitive interface. Tradewill brings this cutting-edge platform directly to your fingertips, giving traders a competitive edge with seamless execution and reliable infrastructure.
At Tradewill, we understand that success in trading depends on technology, strategy, and speed. That’s why MT5 is the go-to choice for traders who are serious about making informed decisions and maximizing their returns.
Advanced Trading Tools at Your Fingertips
One of the standout features of MetaTrader 5 is its array of analytical tools. With over 80 built-in technical indicators and analytical objects, you can perform in-depth market analysis with precision. Whether you're trading forex, stocks, or commodities, MT5 offers everything you need to analyze price movements and identify trends.
Tradewill enhances this experience by providing:
Real-time data feeds
Custom indicators
Algorithmic trading
One-click trading
Multi-threaded strategy tester
These features enable traders to execute complex strategies and automate their trading through Expert Advisors (EAs). No matter your level of experience, Tradewill's MT5 platform supports your growth with powerful trading tools.
Multiple Asset Classes on One Platform
MetaTrader 5 is a true multi-asset platform. Unlike MT4, which primarily supports forex trading, MT5 expands your trading opportunities by providing access to:
Forex
Stocks
Indices
Commodities
Futures
Cryptocurrencies
With Tradewill, you can diversify your portfolio and trade across various markets all in one place. This multi-market approach allows you to hedge risks more effectively and capitalize on opportunities in multiple sectors.
Superior Charting and Technical Analysis
MT5’s charting system is one of the most sophisticated in the industry. It allows for 21 timeframes, ranging from one minute to one month, giving you a comprehensive view of market trends. You can use built-in indicators or add custom ones to create a unique trading setup that fits your strategy.
Tradewill empowers traders with:
Interactive charts
Real-time updates
Drawing tools
Multiple order types
These features help you make timely decisions based on accurate data and technical insight.
Fast Order Execution and Minimal Latency
In the world of trading, timing is everything. MetaTrader 5 ensures lightning-fast order execution and low latency, helping you get in and out of trades quickly and efficiently. Tradewill’s optimized servers and global network infrastructure reduce slippage and deliver an uninterrupted trading experience.
Whether you’re scalping, swing trading, or holding long-term positions, Tradewill and MT5 offer the stability and speed needed to execute your strategy flawlessly.

Mobile and Web Trading for Maximum Flexibility
In today’s fast-paced world, flexibility is key. MetaTrader 5 is available on desktop, web, and mobile platforms, allowing you to trade from anywhere at any time. Tradewill’s MT5 mobile app lets you manage your portfolio, place trades, and monitor the markets on the go—without compromising functionality.
With full account synchronization and real-time data, you never miss a market opportunity. Whether you’re at home, at the office, or on the move, your trades are always within reach.
Trusted Broker Support and Security
When you choose Tradewill, you’re choosing a broker committed to transparency, integrity, and customer success. We offer secure trading environments, robust support, and comprehensive educational resources to help traders succeed.
Our team of experts is always ready to assist with:
Technical support
Trading guidance
Market analysis
Account management
Your success is our mission, and we provide the tools and support to help you achieve it.
Start Trading with Tradewill Today
Whether you’re new to trading or a seasoned investor, MetaTrader 5 with Tradewill offers a superior trading experience that puts you ahead of the curve. Take advantage of advanced tools, diverse markets, and reliable infrastructure.
Don’t settle for less. Explore the full capabilities of MetaTrader 5 with Tradewill today and elevate your trading to a professional level.
Join us now and download MetaTrader 5 to begin your journey toward smarter and more effective trading.
#metatrader 5#option profit calculator#best broker for option trading#crypto calculator profit#profit calculator#forex trading app#meta trader 5
0 notes
Text
Inflation Breakouts and Risk in Daily Forex Trading

The forex market never sleeps and today, May 23, 2025, is a prime example of why staying sharp and adaptable matters. As a trader who relies heavily on strategy and structured analysis, today’s shifts across major currency pairs were both challenging and full of opportunity.
USD/JPY: A Shift in Momentum
The yen gained strength as Japan’s core inflation surprised to the upside, pulling USD/JPY below the 144.00 level. With expectations rising for a potential BoJ rate hike, I saw this as a signal to reassess my grid positions and focus on the narrowing interest rate differential. Patience and measured risk management played a key role in capturing moves during the dip.
EUR/USD: The Weight of Weak Data
The euro slipped as Germany’s PMI data disappointed. For me, it wasn’t just about the headline, it was about the follow-through on price. The 1.1335 resistance zone became the trigger point to consider short-term selling opportunities. Using multi-timeframe analysis and some solid backtested setups, I worked my plan and stayed clear of emotional trades.
GBP/USD: A Breakout in Sight?
The pound continued its upward grind, and I watched closely as it approached a key resistance. Momentum strategies came into play here, and I was looking for confirmation before entering. With some structured decision-making and a clear understanding of price behavior, this setup aligned well with what I’ve been training for over the past year.
Broader Picture: Oil and EM Currencies
Oil softened today on a stronger USD and concerns over OPEC+ output, an important reminder of how commodities and currencies often move in sync. Meanwhile, emerging market currencies like the Pakistani Rupee and Vietnamese Dong faced renewed pressure. While not my primary focus, I monitor these trends as part of my broader sentiment tracking.
What ties today’s market action together is the importance of structure. Whether it’s technical zones, momentum cues, or macroeconomic triggers, a well-rounded strategy helps cut through the noise. One of the most valuable parts of my development as a trader has been engaging with educational platforms that emphasize both the “why” and the “how” of trading.
In my case, learning through resources like Orion Wealth Academy has helped frame my thinking and improve my decision-making process, especially on days like today, where staying calm and informed is the real edge.
#forexmarket#forextrading#forexprofit#forexmentor#forexbroker#forexsignals#forex online trading#forexstrategy#forex
0 notes
Text
Learn, Trade, Succeed – Discover the Complete Trading Education by Chart Monks

Are you tired of hopping from one YouTube video to another, still confused about how the stock market really works? At Chart Monks, we’ve created a complete trading education platform that takes you from clueless to confident—whether you’re a complete beginner or someone looking to refine advanced strategies.
With our trading courses for beginners and advanced modules like the psychology of trading and technical analysis stock market course, we provide the structured learning that most traders miss.
Why Choose Chart Monks for Your Trading Journey?
Unlike most platforms that give you scattered lessons or overly complex theories, Chart Monks simplifies trading education. Our courses are structured, easy to follow, and practical—built by real traders for real people.
We offer:
Basic Trading Course for absolute beginners
Hindi Trading Course to break the language barrier
Advanced modules like the silent language of markets and stock market technical analysis course
Live mentorship and doubt-clearing sessions
Affordable pricing and lifelong access
Start with the Basics – Our Trading Courses for Beginners
If you’re new to the market, you’re likely overwhelmed by buzzwords, conflicting advice, and volatile trends. That’s why our basic trading course is designed to help you understand the building blocks of trading—from market types and order placements to candlestick patterns and risk management.
What you’ll learn:
What is the stock market?
Types of traders and their styles
Basics of technical analysis
Intro to chart reading and market indicators
This trading course for beginners is ideal for students, working professionals, and anyone looking to build a second income.
Understand the Mind Game – Psychology of Trading
One of the most overlooked elements in trading education is psychology. Many traders incur losses not due to a lack of knowledge, but because they fail to manage their emotions effectively. At Chart Monks, our in-depth module on the psychology of trading is crafted to address this crucial yet often ignored aspect of trading success.
In this module, you'll learn to:
Cultivate discipline and emotional resilience
Control fear and greed before they control your trades.
Think sharp, trade smart—like a pro.
This is where you learn to think like a trader—not just act like one.
Technical Analysis Stock Market Course – Learn to Read the Market
Charts speak a silent but powerful language—and we’ll teach you how to read it fluently. Our technical analysis stock market course focuses on actionable strategies that you can apply immediately.
Key topics covered:
Candlestick patterns and their meanings
Support & resistance zones
Trend analysis and price action strategies
Volume interpretation
Entry/exit points and stop-loss planning
Whether you’re a swing trader or an intraday trader, this course will give you the edge you need to make informed and profitable decisions.
Silent Language of Markets – Advanced Price Action Training
Our flagship module, silent language of markets, is for traders who want to sharpen their instincts. This course goes beyond indicators and helps you understand how the market “thinks.”
You’ll learn:
How to interpret raw price action
Multi-timeframe analysis
Market structure and behavior
Reading market intentions without lagging indicators
This is where experienced traders discover their “aha!” moments.
Learn in Your Language – Hindi Trading Course
At Chart Monks, we’re committed to making learning accessible—because language should never limit your potential.That’s why we offer a hindi trading course for those who prefer to learn in their native language. It covers everything from basics to technical analysis and is perfect for traders across India.
Boost Your Profits with the Right Trading Course
The right trading education can save you months of trial and error—and more importantly, protect your capital. At Chart Monks, our goal is not to make you over-reliant on indicators or copy-paste strategies. Instead, we teach you how to think independently and trade confidently.
Strategic planning
Risk-reward optimization
Trade journaling and performance review
Mindful execution based on market context
Why We’re Among the Best Online Trading Courses in India
There are hundreds of online trading courses, but here’s why Chart Monks stands out:
Lifetime access to updated content
Community support and active discussion groups
One-on-one mentorship sessions
Real-world examples and back tested strategies
Affordable pricing
Whether you want to start your trading journey or sharpen your edge, Chart Monks has a course tailored for you.
Ready to Begin? Your Trading Journey Starts Today
At Chart Monks, we believe trading is not a gamble—it’s a skill. And like any skill, it requires the right guidance and consistent practice. Our structured programs combine technical knowledge, psychological insights, and practical strategies to help you trade with confidence.
Call us today at +91-9220943789 or explore our courses at Chart Monks to find the program that fits your goals.
#Trading Courses For Beginners#Basic Trading Course#Psychology Of Trading#Boost Your Profits with the Right Trading Course#Silent Language of Markets#Hindi trading course#Best Online Trading Courses#Stock Market Technical Analysis Course#Technical Analysis Stock Market Course#Chart Monks
0 notes
Text
Advanced Technical Analysis Course | Pro-Level Trading Skills
Take your trading expertise to the next level with our Advanced Technical Analysis course — designed for serious traders and finance professionals who want to dive deep into market behavior and develop high-precision trading strategies. This course goes beyond the basics, offering in-depth insights into advanced charting techniques, multi-timeframe analysis, Elliott Wave Theory, Fibonacci retracements, Ichimoku Cloud, Bollinger Bands, volume analysis, and market psychology.
You'll learn how to interpret complex patterns, recognize high-probability setups, and apply risk management techniques used by professional traders. Through live market sessions, case studies, and strategy backtesting, you’ll gain practical experience in executing trades with accuracy and confidence.
Ideal for traders who already understand technical basics and want to refine their edge in volatile markets. Complete the course and earn a recognized certification in Advanced Technical Analysis — a key step toward becoming a consistently profitable trader.
0 notes
Text
Understanding the Smart Analyzer Pro Indicator for MT4

Introduction to Trading Indicators
Technical indicators are critical for traders aiming to make data-driven decisions in financial markets. The Smart Analyzer Pro indicator MT4 free download is a powerful tool designed to simplify price action analysis and deliver reliable trading signals. Built for the MetaTrader 4 (MT4) platform, this indicator caters to traders of all levels, offering a user-friendly interface and advanced features to enhance trading performance.
What is the Smart Analyzer Pro Indicator?
The Smart Analyzer Pro is a non-repainting indicator that leverages price action strategies to generate accurate buy and sell signals. It uses a unique averaging candle system without wicks, providing a clearer view of market direction by filtering out noise. The indicator supports multiple trading styles—scalping, day trading, and swing trading—and includes a multi-timeframe filter to align trades with broader market trends. Traders often seek to download the Smart Analyzer Pro indicator for MT4 free from reputable sources to integrate its advanced capabilities into their charts.
Benefits of Using the Indicator
The Smart Analyzer Pro indicator for MT4 free download offers several key advantages:
Clear Signals: Displays arrows for trade entries (blue for buy, white for sell) with a three-way alert system (email, mobile, or pop-up), ensuring traders never miss opportunities.
Noise Reduction: Uses special candlesticks to simplify chart reading, eliminating confusing patterns like doji candles or consolidation zones.
Versatility: Works across all currency pairs, timeframes (M1 to D1), and assets like stocks, commodities, and cryptocurrencies.
Risk Management: Suggests stop-loss and take-profit levels to protect capital and lock in profits.
By opting to download the Smart Analyzer Pro indicator for MT4 free, traders gain access to a tool that streamlines analysis and boosts efficiency.
How to Download and Install the Indicator
To use the Smart Analyzer Pro on MT4, follow these steps:
Find a Trusted Source: Search for the indicator on reliable platforms like trading forums or websites such as ForexCracked or ForexFactory. Ensure the files include .ex4 or .mq4 formats and templates.
Download the Files: Save the indicator files and any accompanying templates or manuals. Be cautious of unverified sources to avoid malware.
Install on MT4: Copy the indicator files to the “MQL4” > “Indicators” folder and templates to the “Templates” folder in MT4’s data directory. Restart MT4.
Apply to Chart: Open a chart, select a template (e.g., Scalping, Day Trading, or Swing Trading) from the template menu, and customize settings like alert preferences or timeframes.
Always verify the source when you download the Smart Analyzer Pro indicator for MT4 free to ensure safety and functionality.
Practical Applications
The indicator supports various trading strategies:
Scalping: Use the “Smart – Scalping” template on lower timeframes (M1–M15) for fast, high-risk trades.
Day Trading: Apply the “Day Trading” template on M15–H1 for intraday opportunities with balanced risk.
Swing Trading: Select the “Swing Trading” template on H1–D1 for longer-term trades with filtered signals.
Tips for Effective Use
To maximize the indicator’s potential:
Combine with other tools like RSI or support/resistance levels to confirm signals.
Backtest on a demo account to optimize settings for your trading style.
Avoid trading during high-impact news events to minimize false signals.
Practice proper money management to mitigate risks.
Conclusion
The Smart Analyzer Pro indicator for MT4 free download is a versatile and powerful tool for traders seeking to enhance their market analysis. Its noise-filtering candlesticks, clear signals, and risk management features make it ideal for scalping, day trading, or swing trading. By choosing to download the Smart Analyzer Pro indicator for MT4 free from trusted sources, traders can elevate their strategies and improve profitability. With disciplined use and thorough testing, this indicator can be a game-changer in navigating dynamic markets.
0 notes
Text
What Makes Technical Stocks So Effective in Fast Markets?
In a world of rapid market fluctuations and data-driven strategies, Technical Stocks remain a central focus for short-term traders and tactical investors. These stocks are evaluated through price action and trading patterns, not just earnings or revenue. As markets evolve with increased volatility and liquidity, technical analysis continues to offer practical, real-time insights into stock behavior.
Breaking Down the Basics of Technical Analysis
The foundation of analyzing Technical Stocks lies in understanding historical price movements, volume, and recurring chart patterns. Instead of relying on company fundamentals, this approach uses technical indicators to identify trends, reversals, and breakout levels. Traders use candlestick charts, support and resistance zones, and trendlines to make actionable decisions in fast-moving markets.
Whether the goal is scalping small intraday movements or capturing multi-day trends, these tools offer a clear roadmap for timing entries and exits.
Core Indicators That Drive Trading Decisions
To evaluate Technical Stocks, traders depend on a range of technical indicators. Moving averages like the 50-day and 200-day provide insight into momentum and long-term trends. Meanwhile, tools such as the Relative Strength Index (RSI), Bollinger Bands, and MACD help identify overbought or oversold conditions.
Each indicator offers a unique perspective. When combined, they enhance the accuracy of market signals, allowing traders to refine their approach and reduce risk exposure.
How Emotions and Psychology Shape Technical Moves
Market psychology is a key element behind price movements in Technical Stocks. Fear, greed, and uncertainty often drive rapid shifts in sentiment, especially around earnings announcements, geopolitical events, or economic data releases. Technical analysis captures this behavior in chart formations like head-and-shoulders, double tops, and bullish flags.
Understanding these patterns allows traders to anticipate reactions and adjust their strategies accordingly—an essential skill when navigating emotionally charged markets.
The Double-Edged Sword of Technical Trading
Volatility is both a challenge and an opportunity when it comes to Technical Stocks. These stocks often experience significant price swings, which can create short-term profit potential. However, high volatility also increases the risk of losses if trades are not managed carefully.
Using tools like Average True Range (ATR) and volatility bands, traders can set stop losses, adjust position sizes, and manage trades with discipline—ensuring volatility is leveraged strategically rather than reactively.
Timeframes and Strategy Short-Term vs. Swing Trading
While technical analysis is often associated with day trading, it also supports longer-term strategies. Scalpers might focus on one-minute charts, whereas swing traders analyzing Technical Stocks might rely on daily or weekly setups. The time horizon influences everything from chart selection to indicator settings and risk tolerance.
Having a clearly defined trading plan tailored to your chosen timeframe is crucial for success. It ensures consistent decision-making and reduces emotional interference in trade execution.
Tech-Driven Tools Changing the Game
Technology has revolutionized how traders analyze Technical Stocks. Platforms now offer algorithmic trading, AI-powered alerts, and real-time charting features. Machine learning models can scan multiple securities simultaneously, identify pattern breakouts, and suggest high-probability setups.
These tools enhance speed and efficiency, helping traders react to market changes in seconds. For those seeking a competitive edge, integrating technology with a solid technical foundation is a game-changer.
Risk Management: Protecting Capital with Precision
The key to surviving and thriving in volatile markets lies in managing downside risk. Traders focused on Technical Stocks must know how to place stop-loss orders, set realistic profit targets, and determine the ideal trade size relative to portfolio value.
Tools such as risk-reward ratios, position-sizing calculators, and drawdown metrics allow traders to structure positions methodically—protecting gains while minimizing exposure to large losses.
News, Events, and the Unexpected
Although technical analysis is rooted in price and volume, external factors like earnings reports, central bank decisions, and geopolitical developments often trigger major moves in Technical Stocks. These events can invalidate patterns or cause false breakouts.
Successful technical traders stay aware of the macro calendar, using event timing as a backdrop when planning trades. Combining market awareness with technical setups results in more informed decisions and fewer surprises.
The Future of Technical Trading
As more investors adopt quantitative approaches, the importance of real-time analysis and adaptability is growing. The role of Technical Stocks is expected to expand as automation becomes more prevalent. Traders will need to continue learning, testing strategies, and integrating new tools to maintain an edge.
Staying updated on platform innovations, learning from past trades, and continuously refining entry/exit strategies are critical habits in the modern technical trader’s toolkit.
Technical Stocks as a Tactical Asset Class
Whether you're a day trader or a long-term trend follower, Technical Stocks offer a powerful way to capitalize on market behavior. By mastering indicators, understanding trader psychology, managing risk, and embracing tech innovations, investors can navigate short-term volatility with greater confidence.
As markets remain unpredictable, technical strategies provide the structure and discipline needed to respond effectively. For those willing to study the charts and respect the patterns, Technical Stocks offer opportunity, flexibility, and tactical advantage in today’s complex trading landscape.
0 notes
Text
Alltick API: Precise Tick-Level Data Capture, Stay Ahead in Quantitative Trading!
In today’s rapidly evolving financial markets, the success of quantitative trading often hinges on the quality and speed of data. Tick-level data—the raw record of every market quote—has become a core requirement for professional traders and quant teams due to its high precision and completeness. However, obtaining stable, low-latency tick data is no easy task. Issues like data delays, incomplete quotes, and unstable interfaces can directly impact strategy performance. Alltick API is designed to solve these challenges, providing traders with a reliable and efficient Forex tick data interface, empowering quant teams to gain a competitive edge.
Why Is Tick Data So Important?
Tick data represents the most granular transaction records in the market, including timestamps, bid/ask prices, and trading volumes for every quote. Compared to candlestick or minute-level data, tick data offers a more precise reflection of market microstructure, making it indispensable for:
High-Frequency Trading (HFT): Relies on millisecond-level market movements
Algorithm Optimization: Reduces "slippage" errors in backtesting
Order Flow Analysis: Identifies large order movements and market sentiment
Volatility Prediction: Captures instantaneous price jumps
Traditional data sources often suffer from delays or aggregation issues, while Alltick API connects directly to liquidity providers, ensuring raw and real-time data integrity.
Core Advantages of Alltick API
Millisecond-Level Low Latency, Zero Data Gaps Alltick API uses direct market data feeds, delivering tick updates in milliseconds, enabling HFT strategies to capture every critical market movement.
Complete Historical Data for Accurate Backtesting Beyond real-time data, Alltick provides full historical tick data with multi-timeframe query support, ensuring backtests mirror real-market conditions.
Stable and Reliable API Infrastructure
High Availability: 99.9% uptime guarantee, avoiding disconnections during trading hours
Multi-Protocol Support: REST, WebSocket, FIX, and more
Global Coverage: Major Forex, precious metals, and CFD markets
Developer-Friendly, Fast Integration Clear API documentation, code samples (Python/Java/C#), and SDKs streamline integration, reducing development cycles.
Use Cases
Quant Hedge Funds: Optimize high-frequency strategy execution
Retail Traders: Enhance precision in short-term trading
FinTech Firms: Build data-driven analytical tools
Academic Research: Market microstructure analysis
Conclusion
In quantitative trading, data quality directly determines strategy profitability. Alltick API delivers professional tick data services, freeing traders from delays and missing information, ensuring every decision is based on the truest market dynamics.
Integrate Alltick API today and turn tick data into your trading advantage!
1 note
·
View note