#Python Pandas Series
Explore tagged Tumblr posts
Visit Tumblr Blog
Explore Tumblr blogs with no restrictions, modern design and the best experience.
Last Seen Tumblr Blogs


Fun Fact
When “GIF” was named word of the year in 2012, Oxford Dictionaries U.S.A. credited Tumblr for pushing the word.
Text

Went to the thrift store and bought a bunch of those toy bags
Real happy with my haul!
Gonna start doing this thing where I post a list of things I got in a haul under the cut
Top Row:
Yeti from Monsters Inc (Hasbro figure set 2001)
Alien from Toy Story (Can not find any information about year or collection)
Tigger from Winnie the Pooh (McDonalds Disney home video masterpiece collection 1996)
Elmer Fudd from Looney Tunes (Arby’s Looney Tunes kids meal set 1988)
Hanzo from Overwatch w/o base (Blizzard Cute but Deadly 2017)
Reaper from Overwatch w/o base (Blizzard Cute but Deadly 2017)
Second Row:
Tigress from Kung Fu Panda (McDonalds Dreamworks All-Stars 2022)
Mini Slumber Party Yasmin (Mini Bratz 2023)
Khalil the caterpillar as Jonah from Veggietales (2002)
Lost Kitties Snoopz (Lost Kitties Kit-twins series 2 2019)
Little gnome dude (1990s Kinder Egg toy)
Rockhopper from Club Penguin (Sometime around 2010)
Third Row (the Shopkins row):
Cookie Nut (Season Four 2014)
Caramel Topping (Season Six 2016)
Penny Wishing Well (Season Five 2016)
Happy Places Key Holder (Grand Mansion playset 2017)
Grace Baseball Bat (Season Five Super Shopper Pack edition 2016)
Veronica Vase (Season Five 2016)
Gracie Birthday Cake (Season Seven 2017)
Happy Places Umbrella Stand (Grand Mansion playset 2017)
Choc Chips (Season Six 2016)
Mintee (Season Four Glitzi Collector’s Case 2015)
Jilly Jam Roll (Season Five Super Shopper Pack edition 2016)
Tammy Tambourine (Season Five Super Shopper Pack edition 2016)
Fourth Row (Trash Pack Row):
Rotten Roll in Yellow (Series Three 2012)
Saver Krout in White (Series Five 2013)
Dung Bug in Purple (Gross Ghosts Series Two 2013)
Trashteroid in Green (Gross Ghosts Series Two 2013)
Grotty Fruity in Green (Gross Ghosts Series Two 2013)
Trash Top in Purple (Series Five 2013)
Skabby Shark in Light Blue (Series Three 2012)
Garbage Goat in Brown (Series Three 2012)
Sudz in Orange(Gross Ghosts Series Two 2013)
Burny in Green (Gross Ghosts Series Two 2013)
Burny in Purple (Gross Ghosts Series Two 2013)
Slime Python in Red (Series Three 2012)
Slime Python in Purple (Series Three 2012)
Cruddy Kebab in Lime (Series Three 2012)
Football Virus in Light Green (Series 7 2014)
Grot Pot in Yellow (Series Three 2012)
Fifth Row (Trash Wheels Row):
Beetle in Yellow (Series One 2013)
Fast Flea in Yellow (Series One 2013)
Muck Monster in Green (Series One 2013)
Last Row (Grossery Gang Row):
Rotting Toothpaste in Blue (Series One 2016)
Sour Milk in Blue (Series One 2016)
Fungus Fries in Purple (Series One 2016)
Stale Muffin in Blue (Series One 2016)
Sour Pineapple in Orange (Series One 2016)
#kidcore#toy collection#toy collector#toycore#mcdonalds toys#thrifting#disney#overwatch#looney tunes#kung fu panda#bratz doll#veggietales#club penguin#shopkins#trash pack#trash wheels#grossery gang#my collection#nostalgia
16 notes
·
View notes
Text
Get To Know Your Mutuals
Thanks for the tag Massi 《 @livingformintyoongi 》 I'm gonna answer as much of this as I can (and see if we can beat the destiny allegations 👀) (This is my 4th!! time doing this. Tumblr.com has been fighting me with this 😭)
what's the origin of your blog title? The truth is I'm terrible at usernames and I wanted something really cool and I blanked out and said angelwings- which was absolutely taken so I had to choose random combos until... well here we are <3
favorite fandoms: Armys, Stays, Carats, Swifties.
OTP(s)/shipname: Maybe Chlonath. When I first made this blog they were my first ship so I'm kinda sentimental about it lol
favorite color: Warning for any of the 'favourite items' questions. I hate choosing just one thing 😅 but I love blue and pink- and also latley, i've been loving pastels and muted shades.
favorite game: I've played the pokemon games so many times, replayed them so much... I think it would only be fair to say those.
song stuck in your head: Autumn Leaves - BTS (to be fair, this song is always in my head and I'm never normal about it), Python - GOT7, Cornelia Street�� and Say Don’t Go - Taylor Swift
weirdest habit/trait? So I don't find it weird, but my friends say it's so strange that i literally can't concentrate if I have dry hands. They say it's weird to moisturize so much
hobbies: Reading, writing, plus doing my own nails (this in particular brings me so much joy 😊), and I also really enjoy making a meal from scratch
if you work, what's your profession? customer service.
if you could have any job you wish what would it be? I wanted to be an astronaut for the longest time growing up. I really adore the sky.
something you're good at: I'm gonna go ahead and say cooking and my nails here again- I've been doing them both for so long 😊
something you're bad at: Confrontation? Bro I will run
something you love: The six letters Cardan wrote for Jude in the Folk of the Air Series (I can go into serious detail and I will.)
something you could talk about for hours off the cuff: Actually don't try me I'm a yapper.
something you hate: AVOCADO... I even tried it again as an adult... never again :,)
something you collect: I can't think of anything that I collect right now as we speak. But I would like to collect the BTS albums (I have 2 solo albums that i was gifted and they are my babies)
something you forget: That I don't have to handle everything on my own.
what's your love language? Words of affirmation, quality time and acts of service in this order.
favorite movie/show: So any spiderman movie will have a special place in my heart always. Also Peter Pan (2003). As for shows... well I've watched the kdrama One Spring Night more times than I can count. I recommend it 10000% btw
favorite food: I'll be honest... as long as the food tastes, good I will eat
favorite animal: Empire Penguins, dogs, PANDAS, other bears (if it was safe to hug a bear I would tbh)
are you musical? I mean think, maybe?
what were you like as a child? I've been told I was quited but "had a penchant for the dramatic at the most random times." (personally, i think this still checks out tbh)
favorite subject at school? All the sciences. Biology, chemistry, physics (my love- please don't ask me why I love this subject and consistently failed math) and geography.
least favorite subject? Math and History
what's your best character trait? I've been told i have a good sense of humour? Does this work?
what's your worst character trait? I can be so stubborn at times but I'm trying to work on this (and it's hard :( but we persist)
if you could change any detail of your day right now what would it be? To be honest... nothing. Idk like today happened how it needs to for tomorrow, you know?
if you could travel in time who would you like to meet? I can't think of anyone right at this moment
recommend one of your favorite fanfics (spread the love!): Ok I have more than one favourites but what I'll do is share the one that devastated me and that would be Chasing Cars. I've read it at least twice and after reading it the first time I actually cried a few times and stared at the ceiling while simultaneously making a playlist because there was just so much that I really wanted to say but I didn't know how to. Maybe I should start saving my fave fics because I have sooo much more I could share here but I can't remember the names right right now :(
And that's it! For the mooties… hmmm no pressure of course.. I'll tag @moochii-daisies and @ all my moots who see this (lol jk)
14 notes
·
View notes
Text
Python Libraries to Learn Before Tackling Data Analysis
To tackle data analysis effectively in Python, it's crucial to become familiar with several libraries that streamline the process of data manipulation, exploration, and visualization. Here's a breakdown of the essential libraries:
1. NumPy
- Purpose: Numerical computing.
- Why Learn It: NumPy provides support for large multi-dimensional arrays and matrices, along with a collection of mathematical functions to operate on these arrays efficiently.
- Key Features:
- Fast array processing.
- Mathematical operations on arrays (e.g., sum, mean, standard deviation).
- Linear algebra operations.
2. Pandas
- Purpose: Data manipulation and analysis.
- Why Learn It: Pandas offers data structures like DataFrames, making it easier to handle and analyze structured data.
- Key Features:
- Reading/writing data from CSV, Excel, SQL databases, and more.
- Handling missing data.
- Powerful group-by operations.
- Data filtering and transformation.
3. Matplotlib
- Purpose: Data visualization.
- Why Learn It: Matplotlib is one of the most widely used plotting libraries in Python, allowing for a wide range of static, animated, and interactive plots.
- Key Features:
- Line plots, bar charts, histograms, scatter plots.
- Customizable charts (labels, colors, legends).
- Integration with Pandas for quick plotting.
4. Seaborn
- Purpose: Statistical data visualization.
- Why Learn It: Built on top of Matplotlib, Seaborn simplifies the creation of attractive and informative statistical graphics.
- Key Features:
- High-level interface for drawing attractive statistical graphics.
- Easier to use for complex visualizations like heatmaps, pair plots, etc.
- Visualizations based on categorical data.
5. SciPy
- Purpose: Scientific and technical computing.
- Why Learn It: SciPy builds on NumPy and provides additional functionality for complex mathematical operations and scientific computing.
- Key Features:
- Optimized algorithms for numerical integration, optimization, and more.
- Statistics, signal processing, and linear algebra modules.
6. Scikit-learn
- Purpose: Machine learning and statistical modeling.
- Why Learn It: Scikit-learn provides simple and efficient tools for data mining, analysis, and machine learning.
- Key Features:
- Classification, regression, and clustering algorithms.
- Dimensionality reduction, model selection, and preprocessing utilities.
7. Statsmodels
- Purpose: Statistical analysis.
- Why Learn It: Statsmodels allows users to explore data, estimate statistical models, and perform tests.
- Key Features:
- Linear regression, logistic regression, time series analysis.
- Statistical tests and models for descriptive statistics.
8. Plotly
- Purpose: Interactive data visualization.
- Why Learn It: Plotly allows for the creation of interactive and web-based visualizations, making it ideal for dashboards and presentations.
- Key Features:
- Interactive plots like scatter, line, bar, and 3D plots.
- Easy integration with web frameworks.
- Dashboards and web applications with Dash.
9. TensorFlow/PyTorch (Optional)
- Purpose: Machine learning and deep learning.
- Why Learn It: If your data analysis involves machine learning, these libraries will help in building, training, and deploying deep learning models.
- Key Features:
- Tensor processing and automatic differentiation.
- Building neural networks.
10. Dask (Optional)
- Purpose: Parallel computing for data analysis.
- Why Learn It: Dask enables scalable data manipulation by parallelizing Pandas operations, making it ideal for big datasets.
- Key Features:
- Works with NumPy, Pandas, and Scikit-learn.
- Handles large data and parallel computations easily.
Focusing on NumPy, Pandas, Matplotlib, and Seaborn will set a strong foundation for basic data analysis.
8 notes
·
View notes
Text
Small Pets Catalogue:
(Current to 2/18/2024)
If there is no picture I plan to update with a picture. Pictures are of my actual pets and not representative.
-
REPTILES:
Smaug - Gargoyle Gecko - Rhacodactylus auriculatus - 3/2023 - Poss Female - F2.5 from F1 and F2 Parents - Future Breeding Prospect from Bowling Green State University reptile collection
Housing - Reptizoo 24x24x18in - Bioactive with “Temperate White Springtails” (unknown sp.), “Panda King“ Isopods (Cubaris sp.), Assorted Plants

Elton - Leopard Gecko - Eublepharis macularius - Birthdate Unknown, at least 7 years old - Female - Rescue, provenance unknown - Pet only
Housing - Exo Terra Large wide 36x18x-18in - Bioactive with Porcellionides pruinosus “Party Mix” isopods, Unknown sp. of Arid wild springtails that colonized and outcompeted the springtails I had introduced, and assorted plants.

EVA - Children’s Python - Antaresia childreni - 5/2023 - Female - From E2Exotics on MorphMarket with untraced lineage - Pet only
Housing - S.E.S Series 4 PVC Enclosure 4x2x2ft Semi Bioactive With “Temperate White” (Unknown sp.) Springtails, currently cycling so I have not chosen the isopods yet.
Temporarily in grow out 20 gallon long tank on paper towel until she is large enough that she cannot escape through the gap in the door of the large enclosure.

FISH
Sasuke - Betta Splendens - Young - Female - From Pet Supplies Plus - Pet only
Housing - Aqueon 5.5 gallon Rimless Fish Tank - Assorted Plants, Mystery Snail (Pomacea bridgesii), Pink Ramshorn Snails (Planorbella sp.)
INVERTS LISTED ON MY BUG BLOG
8 notes
·
View notes
Text
How much Python should one learn before beginning machine learning?
Before diving into machine learning, a solid understanding of Python is essential. :

Basic Python Knowledge:
Syntax and Data Types:
Understand Python syntax, basic data types (strings, integers, floats), and operations.
Control Structures:
Learn how to use conditionals (if statements), loops (for and while), and list comprehensions.
Data Handling Libraries:
Pandas:
Familiarize yourself with Pandas for data manipulation and analysis. Learn how to handle DataFrames, series, and perform data cleaning and transformations.
NumPy:
Understand NumPy for numerical operations, working with arrays, and performing mathematical computations.
Data Visualization:
Matplotlib and Seaborn:
Learn basic plotting with Matplotlib and Seaborn for visualizing data and understanding trends and distributions.
Basic Programming Concepts:
Functions:
Know how to define and use functions to create reusable code.
File Handling:
Learn how to read from and write to files, which is important for handling datasets.
Basic Statistics:
Descriptive Statistics:
Understand mean, median, mode, standard deviation, and other basic statistical concepts.
Probability:
Basic knowledge of probability is useful for understanding concepts like distributions and statistical tests.
Libraries for Machine Learning:
Scikit-learn:
Get familiar with Scikit-learn for basic machine learning tasks like classification, regression, and clustering. Understand how to use it for training models, evaluating performance, and making predictions.
Hands-on Practice:
Projects:
Work on small projects or Kaggle competitions to apply your Python skills in practical scenarios. This helps in understanding how to preprocess data, train models, and interpret results.
In summary, a good grasp of Python basics, data handling, and basic statistics will prepare you well for starting with machine learning. Hands-on practice with machine learning libraries and projects will further solidify your skills.
To learn more drop the message…!
2 notes
·
View notes
Text
How you can use python for data wrangling and analysis
Python is a powerful and versatile programming language that can be used for various purposes, such as web development, data science, machine learning, automation, and more. One of the most popular applications of Python is data analysis, which involves processing, cleaning, manipulating, and visualizing data to gain insights and make decisions.
In this article, we will introduce some of the basic concepts and techniques of data analysis using Python, focusing on the data wrangling and analysis process. Data wrangling is the process of transforming raw data into a more suitable format for analysis, while data analysis is the process of applying statistical methods and tools to explore, summarize, and interpret data.
To perform data wrangling and analysis with Python, we will use two of the most widely used libraries: Pandas and NumPy. Pandas is a library that provides high-performance data structures and operations for manipulating tabular data, such as Series and DataFrame. NumPy is a library that provides fast and efficient numerical computations on multidimensional arrays, such as ndarray.
We will also use some other libraries that are useful for data analysis, such as Matplotlib and Seaborn for data visualization, SciPy for scientific computing, and Scikit-learn for machine learning.
To follow along with this article, you will need to have Python 3.6 or higher installed on your computer, as well as the libraries mentioned above. You can install them using pip or conda commands. You will also need a code editor or an interactive environment, such as Jupyter Notebook or Google Colab.
Let’s get started with some examples of data wrangling and analysis with Python.
Example 1: Analyzing COVID-19 Data
In this example, we will use Python to analyze the COVID-19 data from the World Health Organization (WHO). The data contains the daily situation reports of confirmed cases and deaths by country from January 21, 2020 to October 23, 2023. You can download the data from here.
First, we need to import the libraries that we will use:import pandas as pd import numpy as np import matplotlib.pyplot as plt import seaborn as sns
Next, we need to load the data into a Pandas DataFrame:df = pd.read_csv('WHO-COVID-19-global-data.csv')
We can use the head() method to see the first five rows of the DataFrame:df.head()
Date_reportedCountry_codeCountryWHO_regionNew_casesCumulative_casesNew_deathsCumulative_deaths2020–01–21AFAfghanistanEMRO00002020–01–22AFAfghanistanEMRO00002020–01–23AFAfghanistanEMRO00002020–01–24AFAfghanistanEMRO00002020–01–25AFAfghanistanEMRO0000
We can use the info() method to see some basic information about the DataFrame, such as the number of rows and columns, the data types of each column, and the memory usage:df.info()
Output:
RangeIndex: 163800 entries, 0 to 163799 Data columns (total 8 columns): # Column Non-Null Count Dtype — — — — — — — — — — — — — — — 0 Date_reported 163800 non-null object 1 Country_code 162900 non-null object 2 Country 163800 non-null object 3 WHO_region 163800 non-null object 4 New_cases 163800 non-null int64 5 Cumulative_cases 163800 non-null int64 6 New_deaths 163800 non-null int64 7 Cumulative_deaths 163800 non-null int64 dtypes: int64(4), object(4) memory usage: 10.0+ MB “><class 'pandas.core.frame.DataFrame'> RangeIndex: 163800 entries, 0 to 163799 Data columns (total 8 columns): # Column Non-Null Count Dtype --- ------ -------------- ----- 0 Date_reported 163800 non-null object 1 Country_code 162900 non-null object 2 Country 163800 non-null object 3 WHO_region 163800 non-null object 4 New_cases 163800 non-null int64 5 Cumulative_cases 163800 non-null int64 6 New_deaths 163800 non-null int64 7 Cumulative_deaths 163800 non-null int64 dtypes: int64(4), object(4) memory usage: 10.0+ MB
We can see that there are some missing values in the Country_code column. We can use the isnull() method to check which rows have missing values:df[df.Country_code.isnull()]
Output:
Date_reportedCountry_codeCountryWHO_regionNew_casesCumulative_casesNew_deathsCumulative_deaths2020–01–21NaNInternational conveyance (Diamond Princess)WPRO00002020–01–22NaNInternational conveyance (Diamond Princess)WPRO0000……………………2023–10–22NaNInternational conveyance (Diamond Princess)WPRO07120132023–10–23NaNInternational conveyance (Diamond Princess)WPRO0712013
We can see that the missing values are from the rows that correspond to the International conveyance (Diamond Princess), which is a cruise ship that had a COVID-19 outbreak in early 2020. Since this is not a country, we can either drop these rows or assign them a unique code, such as ‘IC’. For simplicity, we will drop these rows using the dropna() method:df = df.dropna()
We can also check the data types of each column using the dtypes attribute:df.dtypes
Output:Date_reported object Country_code object Country object WHO_region object New_cases int64 Cumulative_cases int64 New_deaths int64 Cumulative_deaths int64 dtype: object
We can see that the Date_reported column is of type object, which means it is stored as a string. However, we want to work with dates as a datetime type, which allows us to perform date-related operations and calculations. We can use the to_datetime() function to convert the column to a datetime type:df.Date_reported = pd.to_datetime(df.Date_reported)
We can also use the describe() method to get some summary statistics of the numerical columns, such as the mean, standard deviation, minimum, maximum, and quartiles:df.describe()
Output:
New_casesCumulative_casesNew_deathsCumulative_deathscount162900.000000162900.000000162900.000000162900.000000mean1138.300062116955.14016023.4867892647.346237std6631.825489665728.383017137.25601215435.833525min-32952.000000–32952.000000–1918.000000–1918.00000025%-1.000000–1.000000–1.000000–1.00000050%-1.000000–1.000000–1.000000–1.00000075%-1.000000–1.000000–1.000000–1.000000max -1 -1 -1 -1
We can see that there are some negative values in the New_cases, Cumulative_cases, New_deaths, and Cumulative_deaths columns, which are likely due to data errors or corrections. We can use the replace() method to replace these values with zero:df = df.replace(-1,0)
Now that we have cleaned and prepared the data, we can start to analyze it and answer some questions, such as:
Which countries have the highest number of cumulative cases and deaths?
How has the pandemic evolved over time in different regions and countries?
What is the current situation of the pandemic in India?
To answer these questions, we will use some of the methods and attributes of Pandas DataFrame, such as:
groupby() : This method allows us to group the data by one or more columns and apply aggregation functions, such as sum, mean, count, etc., to each group.
sort_values() : This method allows us to sort the data by one or more
loc[] : This attribute allows us to select a subset of the data by labels or conditions.
plot() : This method allows us to create various types of plots from the data, such as line, bar, pie, scatter, etc.
If you want to learn Python from scratch must checkout e-Tuitions to learn Python online, They can teach you Python and other coding language also they have some of the best teachers for their students and most important thing you can also Book Free Demo for any class just goo and get your free demo.
#python#coding#programming#programming languages#python tips#python learning#python programming#python development
2 notes
·
View notes
Text
First steps: Frecquency analysis
On this following post, a python code is shown followed by come conclussions about the information gathered with it. The code used the imported module of pandas in order to conduct a frecquency analysis of the variables considered in the codebook made in the previous step of this research.
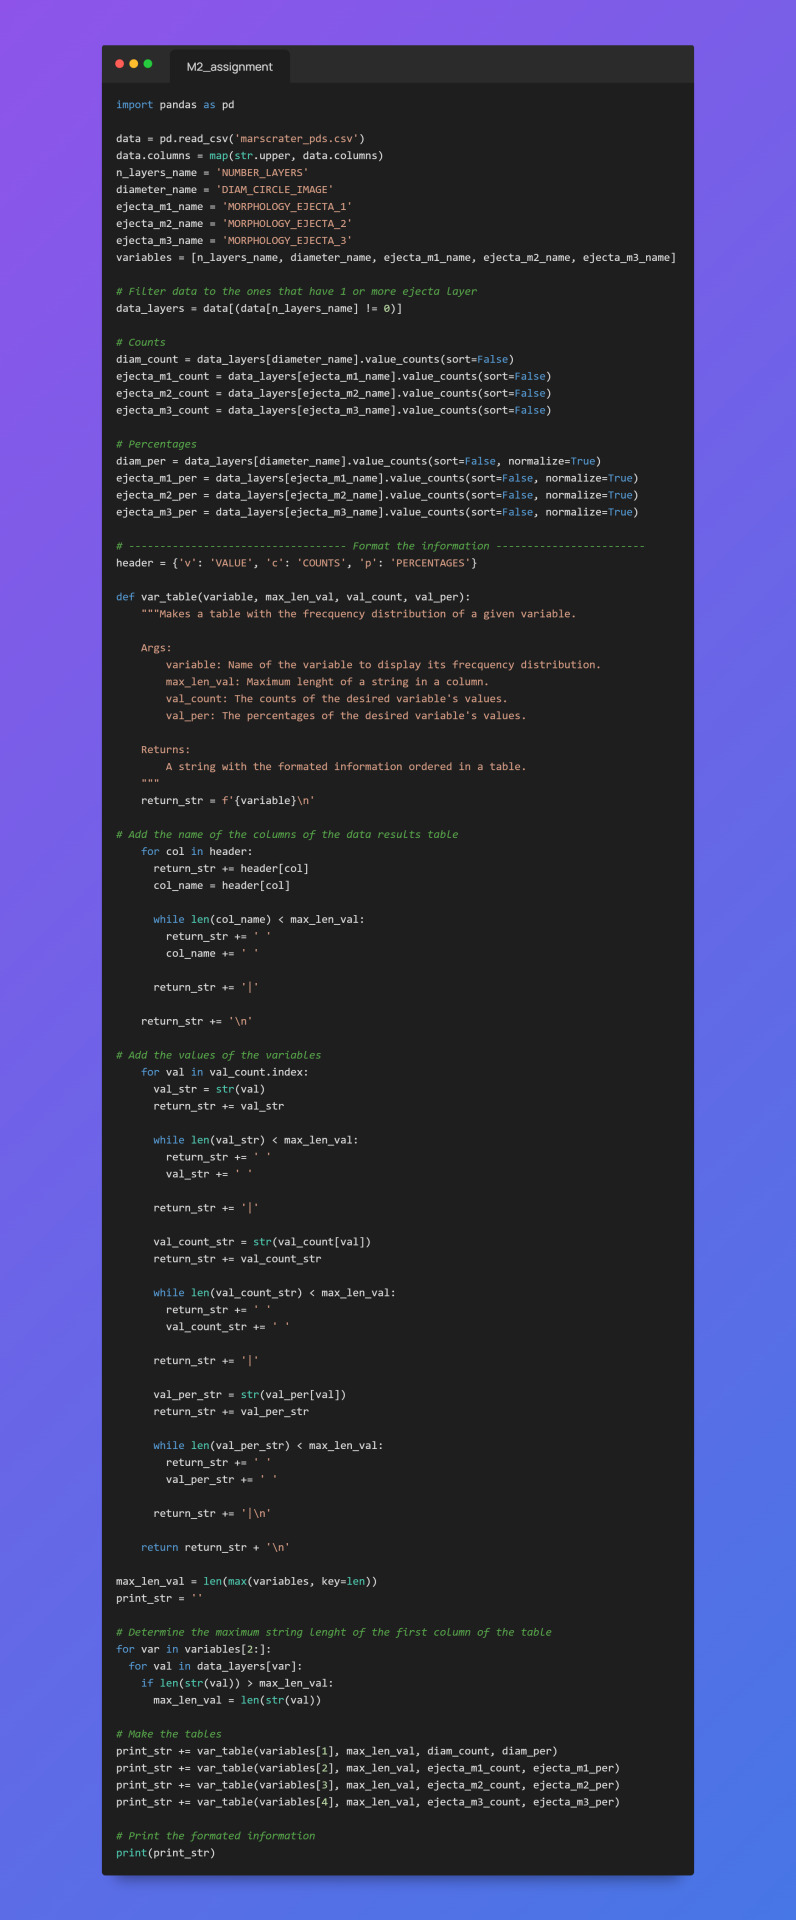
The code shown above takes the information from a csv file that contains the data base made by the scientist Stuart James Robbins.
The steps for the making of the frecquency analysis were the following:
Extract all the data of the csv file into a pandas DataFrame.
Filter the data using the variable NUMBER_LAYERS in order to create another DataFrame that contains only the information of the craters that contains 1 or more layers.
Use the built-in pandas function value_counts(sort=False) to get the counts of a variable´s values in the form of a pandas Series.
Use the built-in pandas function value_counts(sort=False, normalize=True) to get the percentages of a variable's values in the form of a pandas Series.
Store the given information in the previous pair of steps into separated python variables for variables, counts and percentages.
Format the given data into console printable tables for each variable, each table contains the name of the variable analized, the values, and its counts and percentages per value.
For this database and for our interest variables (crater diameter, and ejecta morphologies) the reuslt of the frecquency analysis is the following:


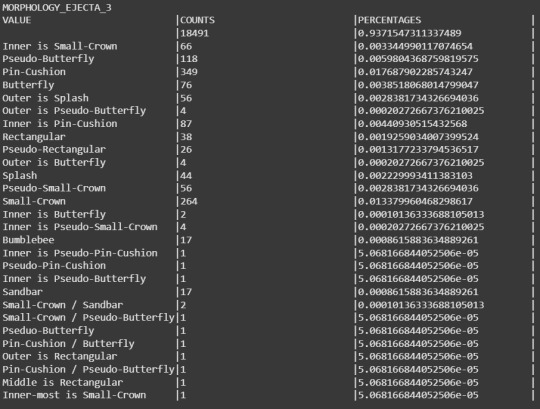
From the results we can start detecting some little things in the data.
For the variable DIAM_CIRCLE_IMAGE we can see that the best way to get some frequecy from it is by setting a range in where the craters diameters can be agrouped and then do a freqcuency analysis, because as it's shown in its results table, almost every crater varies in its exact diameter between each other, making this analysis practically unuseful.
In MORPHOLOGY_EJECTA_1 we can see some significant freqcuency distributions. At plain sight it can be proposed that most of the craters presents a single layer (this can be identified for the first letter of the values, S stands for single layer). Some of the values starting with a S reaches up to 20% in the frecquency analysis.
For MORPHOLOGY_EJECTA_2 we could propose that most of the ejecta blankets appears in THEMIS Daytime IR data as hummocky (first two letters of the value being 'Hu'). Also we can see that the type of ejecta blankets (debris distribution) we are interested the most in the research (Sp as the last two letters representing splash) are founded in a less frecquency conpared to other type of ejecta blankets.
In MORPHOLOGY_EJECTA_3 we can notice what type of variable it is, because this variable is used to describe only unique types of ejecta blankets that requires a separate clasification, thus why the majority of the values in this cariable is null. But one clasification we're fully interested in our research is the splash one, making this variable significant to this research.
Notes(Only MORPHOLOGY_EJECTA_3 is fully shown as the other 3 variables contains a lot of data and the post would be too large. The variable NUMBER_LAYERS is only used to filter data in the code, so no analysis for it is required).
0 notes
Text
How Python Can Be Used in Finance: Applications, Benefits & Real-World Examples

In the rapidly evolving world of finance, staying ahead of the curve is essential. One of the most powerful tools at the intersection of technology and finance today is Python. Known for its simplicity and versatility, Python has become a go-to programming language for financial professionals, data scientists, and fintech companies alike.
This blog explores how Python is used in finance, the benefits it offers, and real-world examples of its applications in the industry.
Why Python in Finance?
Python stands out in the finance world because of its:
Ease of use: Simple syntax makes it accessible to professionals from non-programming backgrounds.
Rich libraries: Packages like Pandas, NumPy, Matplotlib, Scikit-learn, and PyAlgoTrade support a wide array of financial tasks.
Community support: A vast, active user base means better resources, tutorials, and troubleshooting help.
Integration: Easily interfaces with databases, Excel, web APIs, and other tools used in finance.
Key Applications of Python in Finance
1. Data Analysis & Visualization
Financial analysis relies heavily on large datasets. Python’s libraries like Pandas and NumPy are ideal for:
Time-series analysis
Portfolio analysis
Risk assessment
Cleaning and processing financial data
Visualization tools like Matplotlib, Seaborn, and Plotly allow users to create interactive charts and dashboards.
2. Algorithmic Trading
Python is a favorite among algo traders due to its speed and ease of prototyping.
Backtesting strategies using libraries like Backtrader and Zipline
Live trading integration with brokers via APIs (e.g., Alpaca, Interactive Brokers)
Strategy optimization using historical data
3. Risk Management & Analytics
With Python, financial institutions can simulate market scenarios and model risk using:
Monte Carlo simulations
Value at Risk (VaR) models
Stress testing
These help firms manage exposure and regulatory compliance.
4. Financial Modeling & Forecasting
Python can be used to build predictive models for:
Stock price forecasting
Credit scoring
Loan default prediction
Scikit-learn, TensorFlow, and XGBoost are popular libraries for machine learning applications in finance.
5. Web Scraping & Sentiment Analysis
Real-time data from financial news, social media, and websites can be scraped using BeautifulSoup and Scrapy. Python’s NLP tools (like NLTK, spaCy, and TextBlob) can be used for sentiment analysis to gauge market sentiment and inform trading strategies.
Benefits of Using Python in Finance
✅ Fast Development
Python allows for quick development and iteration of ideas, which is crucial in a dynamic industry like finance.
✅ Cost-Effective
As an open-source language, Python reduces licensing and development costs.
✅ Customization
Python empowers teams to build tailored solutions that fit specific financial workflows or trading strategies.
✅ Scalability
From small analytics scripts to large-scale trading platforms, Python can handle applications of various complexities.
Real-World Examples
💡 JPMorgan Chase
Developed a proprietary Python-based platform called Athena to manage risk, pricing, and trading across its investment banking operations.
💡 Quantopian (acquired by Robinhood)
Used Python for developing and backtesting trading algorithms. Users could write Python code to create and test strategies on historical market data.
💡 BlackRock
Utilizes Python for data analytics and risk management to support investment decisions across its portfolio.
💡 Robinhood
Leverages Python for backend services, data pipelines, and fraud detection algorithms.
Getting Started with Python in Finance
Want to get your hands dirty? Here are a few resources:
Books:
Python for Finance by Yves Hilpisch
Machine Learning for Asset Managers by Marcos López de Prado
Online Courses:
Coursera: Python and Statistics for Financial Analysis
Udemy: Python for Financial Analysis and Algorithmic Trading
Practice Platforms:
QuantConnect
Alpaca
Interactive Brokers API
Final Thoughts
Python is transforming the financial industry by providing powerful tools to analyze data, build models, and automate trading. Whether you're a finance student, a data analyst, or a hedge fund quant, learning Python opens up a world of possibilities.
As finance becomes increasingly data-driven, Python will continue to be a key differentiator in gaining insights and making informed decisions.
Do you work in finance or aspire to? Want help building your first Python financial model? Let me know, and I’d be happy to help!
#outfit#branding#financial services#investment#finance#financial advisor#financial planning#financial wellness#financial freedom#fintech
0 notes
Text
Skills You'll Gain from an Artificial Intelligence Course in Dubai
As artificial intelligence (AI) reshapes industries and transforms the future of work, professionals and students alike are looking to gain the skills needed to stay ahead. With its vision of becoming a global tech hub, Dubai is fast emerging as a center for AI education. Enrolling in an Artificial Intelligence Course in Dubai offers more than just theoretical knowledge — it equips you with practical, in-demand skills that employers value today.
Whether you're aiming for a career in machine learning, robotics, data science, or automation, this article explores the top skills you’ll gain by completing an AI course in Dubai — and why this city is the ideal place to begin your journey into intelligent technologies.
Why Study AI in Dubai?
Dubai is positioning itself as a global AI leader, with initiatives like the UAE National AI Strategy 2031 and institutions investing heavily in emerging technologies. By studying in Dubai, you’ll benefit from:
A future-ready education ecosystem
Proximity to multinational tech companies and AI startups
A diverse, international community of learners
Hands-on, project-based training aligned with global job market standards
But most importantly, a well-designed artificial intelligence course in Dubai delivers a structured roadmap to mastering the technical, analytical, and soft skills that make you job-ready in this fast-growing domain.
1. Programming and Data Handling Skills
Every AI system is built on a foundation of programming. One of the first things you’ll learn in an AI course in Dubai is how to code effectively, especially using Python, the most popular language for artificial intelligence development.
You’ll master:
Python programming basics – syntax, functions, control flow, etc.
Working with libraries like NumPy, Pandas, and Matplotlib
Data preprocessing – cleaning, transforming, and visualizing data
Data structures and algorithms for efficient computing
These skills are vital for building AI models and handling real-world datasets — and they’re transferable across many roles in tech and data science.
2. Machine Learning Algorithms
At the heart of any AI system is machine learning (ML) — the ability of systems to learn from data without being explicitly programmed. In your AI course, you’ll gain a solid grounding in how ML works and how to implement it.
Key skills include:
Understanding supervised, unsupervised, and reinforcement learning
Implementing algorithms like:
Linear & Logistic Regression
Decision Trees
Random Forest
Support Vector Machines (SVM)
K-Means Clustering
Model evaluation – accuracy, precision, recall, F1 score, ROC curve
Hyperparameter tuning using Grid Search or Random Search
These skills enable you to build predictive models that power everything from recommendation engines to fraud detection systems.
3. Deep Learning and Neural Networks
AI courses in Dubai, especially those offered by leading institutions like the Boston Institute of Analytics, cover deep learning, an advanced subset of machine learning that uses neural networks to mimic the human brain.
You’ll learn to:
Build Artificial Neural Networks (ANNs)
Design Convolutional Neural Networks (CNNs) for image recognition
Work with Recurrent Neural Networks (RNNs) for time-series and language modeling
Use deep learning frameworks like TensorFlow, Keras, and PyTorch
Deep learning skills are essential for cutting-edge applications like autonomous vehicles, facial recognition, and advanced robotics.
4. Natural Language Processing (NLP)
In an age of chatbots, voice assistants, and real-time translation tools, Natural Language Processing (NLP) is a critical AI skill you’ll develop in your course.
You’ll be trained in:
Text pre-processing: tokenization, stemming, lemmatization
Sentiment analysis and classification
Topic modeling using algorithms like LDA
Building chatbots using Dialogflow or Python-based tools
Working with transformer models (e.g., BERT, GPT)
With businesses increasingly automating communication, NLP is becoming one of the most valuable AI specializations in the job market.
5. Computer Vision
If you’ve ever used facial recognition, scanned documents, or tried augmented reality apps — you’ve used Computer Vision (CV). This powerful field allows machines to “see” and interpret images or videos.
Skills you’ll gain:
Image classification and object detection
Face and emotion recognition systems
Real-time video analytics
Working with tools like OpenCV and YOLO (You Only Look Once)
In Dubai, CV has high demand in security, retail analytics, smart city planning, and autonomous systems — making it a must-have skill for aspiring AI professionals.
6. Data Science & Analytical Thinking
A strong AI course also develops your data science foundation — teaching you to gather insights from data and make data-driven decisions.
You’ll gain:
Strong understanding of statistics and probability
Ability to draw inferences using data visualization
Experience with EDA (Exploratory Data Analysis)
Use of tools like Power BI, Tableau, or Jupyter Notebooks
These analytical skills will help you understand business problems better and design AI systems that solve them effectively.
7. Model Deployment and Cloud Integration
Knowing how to build a machine learning model is just the beginning — deploying it in a real-world environment is what makes you a complete AI professional.
You’ll learn to:
Deploy models using Flask, FastAPI, or Streamlit
Use Docker for containerization
Integrate AI solutions with cloud platforms like AWS, Google Cloud, or Azure
Monitor model performance post-deployment
Cloud deployment and scalability are critical skills that companies look for when hiring AI engineers.
8. Ethics, Privacy & Responsible AI
As AI becomes more powerful, concerns around bias, privacy, and transparency grow. A responsible Artificial Intelligence Course in Dubai emphasizes the ethical dimensions of AI.
Skills you’ll develop:
Understanding bias in training data and algorithms
Ensuring fairness and accountability in AI systems
GDPR compliance and data privacy frameworks
Building interpretable and explainable AI models
These soft skills make you not just a capable engineer, but a responsible innovator trusted by employers and regulators.
Final Thoughts
Dubai’s AI vision, coupled with its rapidly evolving tech ecosystem, makes it a top destination for anyone looking to upskill in artificial intelligence. A structured Artificial Intelligence Course in Dubai doesn’t just teach you how AI works — it transforms you into a job-ready, future-proof professional.
By the end of your course, you’ll be equipped with:
Hands-on coding and modeling experience
Deep understanding of ML and deep learning
Cloud deployment and data handling skills
Ethical AI awareness and practical project expertise
Whether you aim to become a machine learning engineer, data scientist, NLP developer, or AI strategist, the skills you gain in Dubai will open doors to a world of high-paying, impactful roles.
#Best Data Science Courses in Dubai#Artificial Intelligence Course in Dubai#Data Scientist Course in Dubai#Machine Learning Course in Dubai
0 notes
Text
Top 5 Alternative Data Career Paths and How to Learn Them

The world of data is no longer confined to neat rows and columns in traditional databases. We're living in an era where insights are being unearthed from unconventional, often real-time, sources – everything from satellite imagery tracking retail traffic to social media sentiment predicting stock movements. This is the realm of alternative data, and it's rapidly creating some of the most exciting and in-demand career paths in the data landscape.
Alternative data refers to non-traditional information sources that provide unique, often forward-looking, perspectives that conventional financial reports, market research, or internal operational data simply cannot. Think of it as peering through a new lens to understand market dynamics, consumer behavior, or global trends with unprecedented clarity.
Why is Alternative Data So Critical Now?
Real-time Insights: Track trends as they happen, not just after quarterly reports or surveys.
Predictive Power: Uncover leading indicators that can forecast market shifts, consumer preferences, or supply chain disruptions.
Competitive Edge: Gain unique perspectives that your competitors might miss, leading to smarter strategic decisions.
Deeper Context: Analyze factors previously invisible, from manufacturing output detected by sensors to customer foot traffic derived from geolocation data.
This rich, often unstructured, data demands specialized skills and a keen understanding of its nuances. If you're looking to carve out a niche in the dynamic world of data, here are five compelling alternative data career paths and how you can equip yourself for them.
1. Alternative Data Scientist / Quant Researcher
This is often the dream role for data enthusiasts, sitting at the cutting edge of identifying, acquiring, cleaning, and analyzing alternative datasets to generate actionable insights, particularly prevalent in finance (for investment strategies) or detailed market intelligence.
What they do: They actively explore new, unconventional data sources, rigorously validate their reliability and predictive power, develop sophisticated statistical models and machine learning algorithms (especially for unstructured data like text or images) to extract hidden signals, and present their compelling findings to stakeholders. In quantitative finance, this involves building systematic trading strategies based on these unique data signals.
Why it's growing: The competitive advantage gleaned from unique insights derived from alternative data is immense, particularly in high-stakes sectors like finance where even marginal improvements in prediction can yield substantial returns.
Key Skills:
Strong Statistical & Econometric Modeling: Expertise in time series analysis, causality inference, regression, hypothesis testing, and advanced statistical methods.
Machine Learning: Profound understanding and application of supervised, unsupervised, and deep learning techniques, especially for handling unstructured data (e.g., Natural Language Processing for text, Computer Vision for images).
Programming Prowess: Master Python (with libraries like Pandas, NumPy, Scikit-learn, PyTorch/TensorFlow) and potentially R.
Data Engineering Fundamentals: A solid grasp of data pipelines, ETL (Extract, Transform, Load) processes, and managing large, often messy, datasets.
Domain Knowledge: Critical for contextualizing and interpreting the data, understanding potential biases, and identifying genuinely valuable signals (e.g., financial markets, retail operations, logistics).
Critical Thinking & Creativity: The ability to spot unconventional data opportunities and formulate innovative hypotheses.
How to Learn:
Online Specializations: Look for courses on "Alternative Data for Investing," "Quantitative Finance with Python," or advanced Machine Learning/NLP. Platforms like Coursera, edX, and DataCamp offer relevant programs, often from top universities or financial institutions.
Hands-on Projects: Actively work with publicly available alternative datasets (e.g., from Kaggle, satellite imagery providers like NASA, open-source web scraped data) to build and validate predictive models.
Academic Immersion: Follow leading research papers and attend relevant conferences in quantitative finance and data science.
Networking: Connect actively with professionals in quantitative finance or specialized data science roles that focus on alternative data.
2. Alternative Data Engineer
While the Alternative Data Scientist unearths the insights, the Alternative Data Engineer is the architect and builder of the robust infrastructure essential for managing these unique and often challenging datasets.
What they do: They meticulously design and implement scalable data pipelines to ingest both streaming and batch alternative data, orchestrate complex data cleaning and transformation processes at scale, manage cloud infrastructure, and ensure high data quality, accessibility, and reliability for analysts and scientists.
Why it's growing: Alternative data is inherently diverse, high-volume, and often unstructured or semi-structured. Without specialized engineering expertise and infrastructure, its potential value remains locked away.
Key Skills:
Cloud Platform Expertise: Deep knowledge of major cloud providers like AWS, Azure, or GCP, specifically for scalable data storage (e.g., S3, ADLS, GCS), compute (e.g., EC2, Azure VMs, GCE), and modern data warehousing (e.g., Snowflake, BigQuery, Redshift).
Big Data Technologies: Proficiency in distributed processing frameworks like Apache Spark, streaming platforms like Apache Kafka, and data lake solutions.
Programming: Strong skills in Python (for scripting, API integration, and pipeline orchestration), and potentially Java or Scala for large-scale data processing.
Database Management: Experience with both relational (e.g., PostgreSQL, MySQL) and NoSQL databases (e.g., MongoDB, Cassandra) for flexible data storage needs.
ETL Tools & Orchestration: Mastery of tools like dbt, Airflow, Prefect, or Azure Data Factory for building, managing, and monitoring complex data workflows.
API Integration & Web Scraping: Practical experience in fetching data from various web sources, public APIs, and sophisticated web scraping techniques.
How to Learn:
Cloud Certifications: Pursue certifications like AWS Certified Data Analytics, Google Cloud Professional Data Engineer, or Azure Data Engineer Associate.
Online Courses: Focus on "Big Data Engineering," "Data Pipeline Development," and specific cloud services tailored for data workloads.
Practical Experience: Build ambitious personal projects involving data ingestion from diverse APIs (e.g., social media APIs, financial market APIs), advanced web scraping, and processing with big data frameworks.
Open-Source Engagement: Contribute to or actively engage with open-source projects related to data engineering tools and technologies.
3. Data Product Manager (Alternative Data Focus)
This strategic role acts as the crucial bridge between intricate business challenges, the unique capabilities of alternative data, and the technical execution required to deliver impactful data products.
What they do: They meticulously identify market opportunities for new alternative data products or enhancements, define a clear product strategy, meticulously gather and prioritize requirements from various stakeholders, manage the end-to-end product roadmap, and collaborate closely with data scientists, data engineers, and sales teams to ensure the successful development, launch, and adoption of innovative data-driven solutions. They possess a keen understanding of both the data's raw potential and the specific business problem it is designed to solve.
Why it's growing: As alternative data moves from niche to mainstream, companies desperately need strategists who can translate its complex technical potential into tangible, commercially viable products and actionable business insights.
Key Skills:
Product Management Fundamentals: Strong grasp of agile methodologies, product roadmap planning, user story creation, and sophisticated stakeholder management.
Business Acumen: A deep, nuanced understanding of the specific industry where the alternative data is being applied (e.g., quantitative finance, retail strategy, real estate analytics).
Data Literacy: The ability to understand the technical capabilities, inherent limitations, potential biases, and ethical considerations associated with diverse alternative datasets.
Exceptional Communication: Outstanding skills in articulating product vision, requirements, and value propositions to both highly technical teams and non-technical business leaders.
Market Research: Proficiency in identifying unmet market needs, analyzing competitive landscapes, and defining unique value propositions for data products.
Basic SQL/Data Analysis: Sufficient technical understanding to engage meaningfully with data teams and comprehend data capabilities and constraints.
How to Learn:
Product Management Courses: General PM courses provide an excellent foundation (e.g., from Product School, or online specializations on platforms like Coursera/edX).
Develop Deep Domain Expertise: Immerse yourself in industry news, read analyst reports, attend conferences, and thoroughly understand the core problems of your target industry.
Foundational Data Analytics/Science: Take introductory courses in Python/R, SQL, and data visualization to understand the technical underpinnings.
Networking: Actively engage with existing data product managers and leading alternative data providers.
4. Data Ethicist / AI Policy Analyst (Alternative Data Specialization)
The innovative application of alternative data, particularly when combined with AI, frequently raises significant ethical, privacy, and regulatory concerns. This crucial role ensures that data acquisition and usage are not only compliant but also responsible and fair.
What they do: They meticulously develop and implement robust ethical guidelines for the collection, processing, and use of alternative data. They assess potential biases inherent in alternative datasets and their potential for unfair outcomes, ensure strict compliance with evolving data privacy regulations (like GDPR, CCPA, and similar data protection acts), conduct comprehensive data protection and impact assessments, and advise senior leadership on broader AI policy implications related to data governance.
Why it's growing: With escalating public scrutiny, rapidly evolving global regulations, and high-profile incidents of data misuse, ethical and compliant data practices are no longer merely optional; they are absolutely critical for maintaining an organization's reputation, avoiding severe legal penalties, and fostering public trust.
Key Skills:
Legal & Regulatory Knowledge: A strong understanding of global and regional data privacy laws (e.g., GDPR, CCPA, etc.), emerging AI ethics frameworks, and industry-specific regulations that govern data use.
Risk Assessment & Mitigation: Expertise in identifying, analyzing, and developing strategies to mitigate ethical, privacy, and algorithmic bias risks associated with complex data sources.
Critical Thinking & Bias Detection: The ability to critically analyze datasets and algorithmic outcomes for inherent biases, fairness issues, and potential for discriminatory impacts.
Communication & Policy Writing: Exceptional skills in translating complex ethical and legal concepts into clear, actionable policies, guidelines, and advisory reports for diverse audiences.
Stakeholder Engagement: Proficiency in collaborating effectively with legal teams, compliance officers, data scientists, engineers, and business leaders.
Basic Data Literacy: Sufficient understanding of how data is collected, stored, processed, and used by AI systems to engage meaningfully with technical teams.
How to Learn:
Specialized Courses & Programs: Look for postgraduate programs or dedicated courses in Data Ethics, AI Governance, Technology Law, or Digital Policy, often offered by law schools, public policy institutes, or specialized AI ethics organizations.
Industry & Academic Research: Stay current by reading reports and white papers from leading organizations (e.g., World Economic Forum), academic research institutions, and major tech companies' internal ethics guidelines.
Legal Background (Optional but Highly Recommended): A formal background in law or public policy can provide a significant advantage.
Engage in Professional Forums: Actively participate in discussions and communities focused on data ethics, AI policy, and responsible AI.
5. Data Journalist / Research Analyst (Alternative Data Focused)
This captivating role harnesses the power of alternative data to uncover compelling narratives, verify claims, and provide unique, data-driven insights for public consumption or critical internal strategic decision-making in sectors like media, consulting, or advocacy.
What they do: They meticulously scour publicly available alternative datasets (e.g., analyzing satellite imagery for environmental impact assessments, tracking social media trends for shifts in public opinion, dissecting open government data for policy analysis, or using web-scraped data for market intelligence). They then expertly clean, analyze, and, most importantly, effectively visualize and communicate their findings through engaging stories, in-depth reports, and interactive dashboards.
Why it's growing: The ability to tell powerful, evidence-based stories from unconventional data sources is invaluable for modern journalism, influential think tanks, specialized consulting firms, and even for robust internal corporate communications.
Key Skills:
Data Cleaning & Wrangling: Expertise in preparing messy, real-world data for analysis, typically using tools like Python (with Pandas), R (with Tidyverse), or advanced Excel functions.
Data Visualization: Proficiency with powerful visualization tools such as Tableau Public, Datawrapper, Flourish, or programming libraries like Matplotlib, Seaborn, and Plotly for creating clear, impactful, and engaging visual narratives.
Storytelling & Communication: Exceptional ability to translate complex data insights into clear, concise, and compelling narratives that resonate with both expert and general audiences.
Research & Investigative Skills: A deep sense of curiosity, persistence in finding and validating diverse data sources, and the analytical acumen to uncover hidden patterns and connections.
Domain Knowledge: A strong understanding of the subject matter being investigated (e.g., politics, environmental science, consumer trends, public health).
Basic Statistics: Sufficient statistical knowledge to understand trends, interpret correlations, and draw sound, defensible conclusions from data.
How to Learn:
Data Journalism Programs: Some universities offer specialized master's or certificate programs in data journalism.
Online Courses: Focus on courses in data visualization, storytelling with data, and introductory data analysis on platforms like Coursera, Udemy, or specific tool tutorials.
Practical Experience: Actively engage with open data portals (e.g., data.gov, WHO, World Bank), and practice analyzing, visualizing, and writing about these datasets.
Build a Portfolio: Create a strong portfolio of compelling data stories and visualizations based on alternative data projects, demonstrating your ability to communicate insights effectively.
The landscape of data is evolving at an unprecedented pace, and alternative data is at the heart of this transformation. These career paths offer incredibly exciting opportunities for those willing to learn the specialized skills required to navigate and extract profound value from this rich, unconventional frontier. Whether your passion lies in deep technical analysis, strategic product development, ethical governance, or impactful storytelling, alternative data provides a fertile ground for a rewarding and future-proof career.
0 notes
Text
Python for Data Science: Libraries You Must Know
Python has become the go-to programming language for data science professionals due to its readability, extensive community support, and a rich ecosystem of libraries. Whether you're analyzing data, building machine learning models, or creating stunning visualizations, Python has the right tools to get the job done. If you're looking to start a career in this field, enrolling in the best Python training in Hyderabad can give you a competitive edge and help you master these crucial libraries.
1. NumPy – The Foundation of Numerical Computing
NumPy is the backbone of scientific computing with Python. It offers efficient storage and manipulation of large numerical arrays, which makes it indispensable for high-performance data analysis. NumPy arrays are faster and more compact than traditional Python lists and serve as the foundation for other data science libraries.
2. Pandas – Data Wrangling Made Simple
Pandas is essential for handling structured data. Data structures such as Series and DataFrame make it easy to clean, transform, and explore data. With Pandas, tasks like filtering rows, merging datasets, and grouping values become effortless, saving time and effort in data preprocessing.
3. Matplotlib and Seaborn – Data Visualization Powerhouses
Matplotlib is the standard library for creating basic to advanced data visualizations. From bar graphs to histograms and line charts, Matplotlib covers it all. For more visually appealing and statistically rich plots, Seaborn is an excellent choice. It simplifies the process of creating complex plots and provides a more aesthetically pleasing design.
4. Scikit-learn – Machine Learning Made Easy
In Python, Scikit-learn is one of the most widely used libraries for implementing machine learning algorithms. It provides easy-to-use functions for classification, regression, clustering, and model evaluation, making it ideal for both beginners and experts.
5. TensorFlow and PyTorch – Deep Learning Frameworks
For those diving into artificial intelligence and deep learning, TensorFlow and PyTorch are essential. These frameworks allow developers to create, train, and deploy neural networks for applications such as image recognition, speech processing, and natural language understanding.
Begin Your Data Science Journey with Expert Training
Mastering these libraries opens the door to countless opportunities in the data science field. To gain hands-on experience and real-world skills, enroll in SSSIT Computer Education, where our expert trainers provide industry-relevant, practical Python training tailored for aspiring data scientists in Hyderabad.
#best python training in hyderabad#best python training in kukatpally#best python training in KPHB#Kukatpally & KPHB
0 notes
Text
How To Use Pandas For Analysis?
Pandas is a powerful Python library used for data manipulation and analysis. It provides two primary data structures: Series (one-dimensional) and DataFrame (two-dimensional), which are essential for handling structured data. To start using Pandas, first import it using import pandas as pd. You can then load data from various sources such as CSV, Excel, or SQL databases using functions like pd.read_csv() or pd.read_excel().
Once your data is loaded into a DataFrame, you can explore it with methods like .head(), .info(), and .describe() to get a quick summary. Cleaning data involves handling missing values (.dropna(), .fillna()), renaming columns, or changing data types. For analysis, you can use filtering (df[df['column'] > value]), grouping (.groupby()), and aggregation functions (.mean(), .sum(), .count()). Visualization libraries like Matplotlib or Seaborn can be used alongside Pandas to plot the data for deeper insights.
Pandas is essential for data analysts, making it easier to understand patterns and trends in datasets. If you're new to this, consider starting with a Python course for beginners to build a solid foundation.
1 note
·
View note
Text
Master Data Science & AI in 2025: Your Complete Journey from Python to Gen AI

Data is no longer just a byproduct of digital interaction — it’s the currency of the modern world. Whether you're scrolling through social media, ordering food online, or streaming your favorite series, data is constantly being generated, processed, and analyzed. But what if you could be the person behind the curtain — the one turning data into powerful insights and driving real-world impact?
That’s exactly what data scientists and AI engineers do.
If you’re aiming to break into the world of Data Science and Artificial Intelligence in 2025, now is the time to equip yourself with a roadmap that takes you from foundational tools like Python all the way to the cutting edge of Generative AI.
Enter the Data Science & AI Masters 2025 - From Python To Gen AI — a transformative program that doesn’t just teach you the skills, but prepares you for real-world success in this fast-paced domain.
Let’s break down why this is the perfect launchpad for your data science journey in 2025 and beyond.
Why Data Science & AI Is the Career of the Future
It’s no secret that Data Science and AI are among the fastest-growing and highest-paying fields today.
Here’s why:
Global Demand: Every industry is looking for data professionals — from healthcare and finance to retail and entertainment.
Lucrative Salaries: According to Glassdoor, data scientists earn upwards of $120,000/year, with AI specialists making even more.
Versatile Career Paths: You can become a Data Analyst, Machine Learning Engineer, Business Intelligence Expert, or AI Researcher.
Future-Proof Skills: Automation, big data, and AI are not fads — they are shaping the economy of tomorrow.
If you're serious about mastering these skills in a way that aligns with 2025's technological trends, you need a program that evolves with the times. That’s exactly what the Data Science & AI Masters 2025 - From Python To Gen AI offers.
What Makes This Masterclass Stand Out?
There are hundreds of courses out there, so why choose this one?
Because it offers something most others don’t: a complete journey. This isn’t just a crash course in coding. It’s a curated, project-based experience that covers everything from Python programming basics to building real-world Generative AI models.
Here’s what makes it unique:
✅ Start from Absolute Zero
No tech background? No problem.
The course begins with Python — the most beginner-friendly yet powerful language used in data science. You'll understand syntax, logic building, loops, data structures, and more.
By the end of the Python section, you won’t just know how to code — you’ll be thinking like a programmer.
✅ Dive Into Data Analytics & Visualization
You'll learn how to analyze real data using Pandas, NumPy, and Matplotlib, gaining insights through charts, dashboards, and statistics.
This part transforms raw data into stories and strategies — something every business needs today.
✅ Learn Machine Learning, The Easy Way
AI sounds complicated? This course makes it accessible.
You'll learn:
Supervised & Unsupervised Learning
Regression & Classification
Clustering & Dimensionality Reduction
Model Optimization & Cross-validation
Even better, you’ll build models step-by-step, watching them evolve from data input to meaningful prediction.
✅ Explore Real AI Applications
Understand how recommendation engines work, how companies detect fraud, or how chatbots understand your voice. This is where the course gets real.
✅ Step Into the World of Gen AI
Here’s where things get exciting.
2025 is set to be the year Generative AI goes mainstream. You’ll explore tools like:
GPT-based AI systems
AI-generated content creation
NLP (Natural Language Processing)
Prompt engineering
Image & video generation with AI
No fluff. You’ll work on mini-projects that show how AI can create, not just analyze. This is the future — and you’ll be ahead of it.
Who Is This Course For?
This program was built with real people in mind. You don’t need a Ph.D. in math or a Silicon Valley job offer to start. You need curiosity and commitment.
Perfect for:
Students exploring career options in tech
Professionals switching careers into AI or data roles
Entrepreneurs wanting to use data to grow their business
Freelancers offering data services
Anyone looking to understand and apply AI practically
Tools & Technologies You’ll Master
Here’s a peek into the toolkit you'll be working with:
Python – Foundation of all things data.
Pandas & NumPy – Data handling and math magic.
Matplotlib & Seaborn – For visual storytelling with data.
Scikit-learn – ML models made easy.
TensorFlow & Keras – For serious AI modeling.
ChatGPT & OpenAI APIs – Dive deep into Gen AI.
You’ll go from installing Python to building AI-powered applications — all in one journey.
Real Projects, Real Portfolio
It’s not just what you learn, it’s what you create.
Some exciting projects you’ll build:
A Netflix-style movie recommender
A house price predictor using real datasets
A chatbot that understands and responds to user queries
AI that writes social media content using Gen AI tools
By the end, you’ll have hands-on proof of your skills — perfect for resumes, job interviews, or freelancing gigs.
What Do Learners Say?
Here’s what real students love about the program:
“I had zero programming experience, but by the end of the course, I was building my own AI tools. The step-by-step approach was incredible!” – Riya M., Student
“I took other data courses before but always felt lost when it came to real projects. This one clicked. It made me feel like an actual data scientist.” – Jason L., Marketing Analyst
“The Gen AI section is 🔥 — I used it to create content for my business and got more engagement than ever.” – Priya K., Entrepreneur
Certification & Career Boost
Completing this course not only gives you skills but also a recognized certificate that boosts your portfolio. Many learners have gone on to:
Land data analyst roles
Get hired at startups and tech companies
Start freelancing as data consultants
Build their own AI-powered applications
And the best part? It costs a fraction of what you'd pay for a bootcamp or university degree.
Learning Made Flexible and Fun
The course is hosted on Udemy, meaning:
Lifetime access – Learn at your own pace.
Mobile friendly – Watch on the go.
Quizzes & assignments – Test your knowledge.
Updated content – Always aligned with tech trends.
Whether you’re learning during lunch breaks or binge-learning on weekends, it adapts to you.
The Path Ahead in 2025
Generative AI, prompt engineering, no-code ML tools, and real-time data pipelines are all rising. Companies want individuals who can blend data science with modern AI. This course helps you future-proof your career by teaching you exactly that.
You’re not just learning what worked in 2020 — you're mastering what the world will demand in 2025 and beyond.
Final Thoughts: Your Data Science Journey Starts Now
The digital world is exploding with opportunities. But those who act fast, learn smart, and build real projects will be the ones to benefit most.
If you’ve been waiting for a complete, practical, beginner-friendly course, this is your sign.
👉 Start your transformation with the Data Science & AI Masters 2025 - From Python To Gen AI — and step confidently into the future of tech.
This is your moment to evolve from learner to leader in Data Science and AI. Let’s get started.
0 notes
Text
Project Title: Temporal Pattern Miner.
🧠 Reference: cddml-TemporalPatternMiner File Name: temporal_pattern_miner.py 🔍 Description An advanced project utilizing pandas, scikit-learn, statsmodels, and matplotlib to perform sophisticated time series analysis, including anomaly detection, forecasting, and pattern recognition on the Air Quality dataset. 💻 Python Code import pandas as pd import numpy as np import matplotlib.pyplot as…

View On WordPress
0 notes