#Stochastic Oscillator
Explore tagged Tumblr posts
Visit Tumblr Blog
Explore Tumblr blogs with no restrictions, modern design and the best experience.
Last Seen Tumblr Blogs


Fun Fact
Mobile Tumblr US users spend an average of 4.04 minutes per session on the app.
Text
Momentum Trading: Forex Trading Strategy Explained
Momentum trading is a strategy that seeks to capitalize on the continuance of existing trends in the market. By focusing on the strength of price movements, traders can make informed decisions and optimize their profits. What is Momentum Trading? Momentum trading involves buying and selling currency pairs based on recent price trends. The core idea is that strong movements in the market tend to…
#Currency Pairs#Divergence#Economic Indicators#Forex#Forex Trading#Leverage#MACD#Market Conditions#Market News#Momentum Trading#Moving Average Convergence Divergence#Moving Averages#Price Movements#Relative Strength#Risk Management#RSI#Stochastic Oscillator#Stop-Loss#Stop-Loss Orders#Take-Profit#Trading Strategy
3 notes
·
View notes
Text
Solana Bounces Back: Bullish Wave Builds Above $155 After Sharp Dip
In a recent post on X, crypto analyst Grayhoood observed that Solana (SOL) is currently showing signs of a bullish trend. Over the past 24 hours, the price has climbed by 2.8%, with candlestick charts revealing a noticeable upward trajectory. Solana Stochastics And CCI Signal Short-Term Strength Earlier in the day, SOL briefly dipped to around $151 but managed to recover steadily, reaching a…
#CCI#commodity channel index#Grayhoood#m&a#moving averages#Relative Strength Index#RSI#Sol#SOL news#SOL Price#Solana#Solana news#Solana Price#SOLUSD#SOLUSDT#Stochastic Oscillator
0 notes
Text

#best momentum indicators#popular momentum indicators#relative strength index indicator#stochastic oscillator
0 notes
Text
OUR SOCIAL REALITY
machine organisms squandering across the plains, with their little typing machines in seemingly deterministic movements all of which undergone at irregular intervals—faces dormant, unemotional, leaving no trace of narrative; a bombastic nihilism pissed across their face you see…stochastic movement, rampant and simultaneous dispatches and transmission of information via telecommunication systems. eyes vibrating — oscillations.. consuming seemingly infinite units of media without cessation.
To which we recognise ourselves as bodies of robotic nature, it is then that we shalt never be liberated. This system, for it to resuscitate itself from an ever-perpetual mode of cessation and disequilibrium, must have it’s inhabitants become of ‘tools’. In such these tools are to be replaced when considered inoperable, or no longer of strained use. Perhaps so if it has the capacity to render itself useful for it’s lifespan, so too will it dry itself to death of labour. You are assigned a name at birth, and now you see. You see everything, you’ve clenched this state of enlightenment for a time — very long time mind you. Soon to be educated, and then become of a prop- a thing. In order for one to subsist you must have a job. In so this job will be your life. Dead-time, lost time…
2 notes
·
View notes
Text
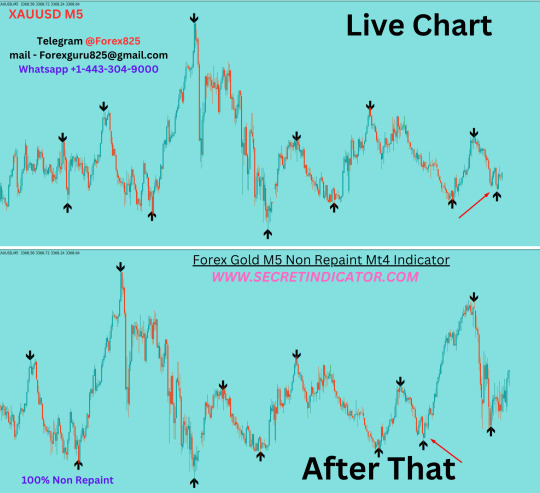
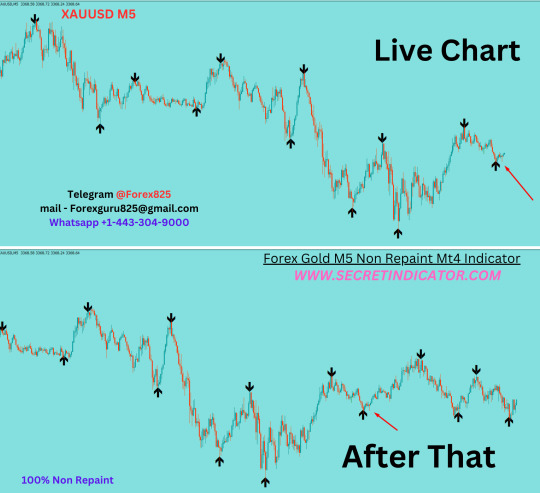
good indicators for forex trading
📊 Good Indicators for Forex Trading: The Ultimate Guide for Profitable Trades
https://secretindicator.com/product/forex-gold-m5-non-repaint-mt4-indicator/
Telegram Channel
✅ Introduction
Forex trading is both an art and a science. While price action and market psychology play key roles, technical indicators help traders make objective, data-driven decisions. Whether you’re a beginner or an experienced trader, choosing the right indicators can dramatically improve your entries, exits, risk management, and profitability.
But with hundreds of forex indicators available — from the classic moving averages to exotic custom tools — how do you know which ones truly work?
This detailed article explores:
What forex indicators do
The core types of indicators
The best and most commonly used indicators
How to use them effectively in combination
Common mistakes and tips for better results
📌 Table of Contents
What Are Forex Indicators?
Types of Technical Indicators
Why Indicators Matter in Forex Trading
The Top 10 Good Indicators for Forex
Deep Dive into the Most Effective Indicators
Best Indicator Combinations
Tips for Using Indicators Effectively
Common Mistakes to Avoid
How to Backtest and Optimize Indicators
Final Thoughts
1. 📉 What Are Forex Indicators?
Forex indicators are mathematical calculations based on price, volume, or open interest. They analyze past market data to help traders make predictions about future price movements. Indicators are typically plotted on or below a chart and can signal:
Trend direction
Reversal zones
Entry/exit points
Market strength
Volatility
Overbought/oversold levels
They don't predict the future perfectly, but when used correctly, they help you make probability-based decisions.
2. 📊 Types of Technical Indicators
Forex indicators fall into several major categories:
🔹 Trend Indicators
Identify the direction and strength of market trends.
Examples: Moving Averages, MACD, ADX, Ichimoku Cloud
🔹 Momentum Indicators
Measure the speed of price movement to find overbought/oversold areas.
Examples: RSI, Stochastic Oscillator, CCI
🔹 Volatility Indicators
Measure the rate of price fluctuations, showing when the market is quiet or explosive.
Examples: Bollinger Bands, ATR (Average True Range)
🔹 Volume Indicators
Gauge trading volume, often used to confirm the validity of price moves.
Examples: OBV, Volume Oscillator, Chaikin Money Flow
🔹 Custom or Composite Indicators
Combine multiple tools or custom formulas.
Examples: TDI (Traders Dynamic Index), Supertrend, Pivot Point Indicator
Each type has a purpose. Great trading strategies usually combine 2–3 different types.
3. 🧠 Why Indicators Matter in Forex Trading
Trading without indicators is like driving without a speedometer or GPS — possible, but risky and uncertain.
Good indicators help:
Define trading rules
Add objectivity to decision-making
Reduce emotional trading
Confirm entries and exits
Prevent overtrading in choppy markets
Identify trends early or avoid weak ones
They don’t guarantee success — but they increase your statistical edge.
4. ✅ The Top 10 Good Indicators for Forex Trading
Here are ten indicators that are time-tested, effective, and widely used by traders across all levels: RankIndicatorTypeUse Case1Moving Averages (EMA/SMA)TrendIdentify direction and smooth price2Relative Strength Index (RSI)MomentumSpot overbought/oversold areas3MACDTrend/MomentumSignal trend changes via crossovers4Bollinger BandsVolatilityBreakout signals, range bounds5ADXTrend StrengthMeasure trend strength (not direction)6Stochastic OscillatorMomentumShort-term reversal entries7ATRVolatilitySet dynamic stop-loss based on volatility8Ichimoku CloudTrendComplete trend system with signals9Fibonacci RetracementSupport/ResistanceIdentify pullback and entry zones10Volume Indicators (OBV/CMF)VolumeConfirm trends and breakouts
Let’s now explore some of the best ones in detail.
5. 🔍 Deep Dive: Best Indicators Explained
🔹 1. Moving Averages (EMA & SMA)
Simple Moving Average (SMA): averages price over a period.
Exponential Moving Average (EMA): gives more weight to recent prices.
Popular Uses:
50 EMA & 200 EMA crossovers = trend change
Price above 200 EMA = long bias, below = short bias
Use slope of EMA for trend strength
Pro Tip: Use moving average channels for dynamic support/resistance.
🔹 2. Relative Strength Index (RSI)
Ranges from 0 to 100
Above 70 = Overbought (possible sell)
Below 30 = Oversold (possible buy)
How to Use:
Divergence between RSI and price = strong reversal signal
Combine with support/resistance zones
Use RSI > 50 in uptrends, < 50 in downtrends
🔹 3. MACD (Moving Average Convergence Divergence)
Consists of:
MACD line (12 EMA – 26 EMA)
Signal line (9 EMA of MACD)
Histogram (difference between MACD and signal)
Strategy:
MACD line crossing above signal = buy signal
Use MACD divergence to detect early trend reversals
🔹 4. Bollinger Bands
3 lines: Upper, Middle (SMA), Lower band
Bands widen with volatility, contract in calm markets
Trading Ideas:
Price touches lower band + oversold RSI = potential long
Breakout with volume = trend beginning
Range-bound strategy: buy at lower band, sell at upper
🔹 5. ADX (Average Directional Index)
Measures trend strength, not direction
Value > 25 = trend is gaining momentum
Value < 20 = market is ranging
Combine with:
+DI and –DI lines to see bull vs bear strength
Trendline or MA to confirm direction
🔹 6. Stochastic Oscillator
Two lines: %K and %D
Values > 80 = overbought, < 20 = oversold
How to Trade:
Buy when %K crosses above %D in oversold zone
Sell when %K crosses below %D in overbought zone
Best in ranging or corrective phases
🔹 7. ATR (Average True Range)
Measures volatility, not direction
Use for:
Setting realistic stop-losses based on market behavior
Filtering out low-volatility trades
Adjusting position sizing dynamically
🔹 8. Ichimoku Cloud
A complete system: trend, momentum, and future resistance zones
Components:
Kumo Cloud: dynamic S/R
Tenkan & Kijun: short-term trend crossovers
Chikou Span: lagging confirmation
Works best on H4 and D1 timeframes.
🔹 9. Fibonacci Retracement
Tool based on key price ratios (0.382, 0.5, 0.618)
Great for pullback entries in trends
Strategy:
Price retraces to 61.8% + MA support = strong long setup
Combine with candle signals or trendline breaks
🔹 10. Volume Indicators
OBV (On-Balance Volume): volume flow
Chaikin Money Flow: volume + price pressure
Use them to:
Confirm breakouts
Spot early accumulation/distribution
Add strength to RSI/MACD setups
6. 🔗 Best Indicator Combinations
No single indicator is perfect. Here are some powerful combos:
✅ RSI + Bollinger Bands
RSI confirms overbought/oversold
BB shows volatility edge
✅ ADX + Moving Averages
MA shows direction, ADX confirms trend strength
✅ MACD + Volume
MACD gives direction change
Volume confirms if it’s real
✅ Stochastic + Fibonacci
Stochastic entry after Fib retracement level
Always look for confluence of signals before entering a trade.
7. 🧠 Tips for Using Indicators Effectively
Use indicators to confirm, not control decisions
Stick to 2–3 indicators max — don’t clutter your chart
Adjust indicator settings based on timeframe and strategy
Use support/resistance and candlestick patterns as base context
Watch for divergence for early reversal warnings
8. ❌ Common Mistakes to Avoid
Over-reliance on indicators
Using too many conflicting tools
Not backtesting indicators
Ignoring market context
Trading all signals — not all are valid
Remember: Indicators follow price, not the other way around. Context is king.
https://secretindicator.com/product/forex-gold-m5-non-repaint-mt4-indicator/
#forex factory#forex market#forex education#forex online trading#forex broker#crypto#forex news#forex#forex indicators#forex ea
0 notes
Text
Top 10 Best Indicators for Stock Trading in India

Stock trading is an exciting way to grow your money. Many people in India have started trading in stocks, but not everyone makes profits. To become a smart trader, you need to know how to read the market. One of the best ways is by using indicators. Indicators help you understand whether it is a good time to buy or sell a stock.
In this blog, we will explain 10 important indicators every Indian trader should know. We will keep it simple so that even beginners can understand and use them.
1. Moving Average (MA)
What it means: A moving average shows the average price of a stock over a certain number of days. For example, a 50-day moving average shows the average price for the last 50 days.
How to use: When the stock price goes above the moving average, it is usually a sign to buy. When the price falls below it, it can be a sign to sell.
Tip: Popular moving averages are the 50-day and the 200-day moving average.
2. Relative Strength Index (RSI)
What it means: RSI tells you if a stock is overbought (too expensive) or oversold (too cheap). It is a number between 0 and 100.
How to use:
If RSI is above 70, the stock might be overbought. It may fall soon.
If RSI is below 30, the stock might be oversold. It may rise soon.
Tip: Check RSI along with other indicators before buying or selling.
3. Bollinger Bands
What it means: Bollinger Bands show how much a stock price moves around its average price. It has three lines: the middle one is the moving average, and the upper and lower bands show the range.
How to use: When the bands are wide, the stock is more volatile. If the price touches the upper band, it may fall back. If it touches the lower band, it may go up.
Tip: Bollinger Bands are great for spotting sudden price breakouts.
4. MACD (Moving Average Convergence Divergence)
What it means: MACD is a trend-following indicator. It shows the relationship between two moving averages.
How to use:
When the MACD line crosses above the signal line, it’s a buy sign.
When the MACD line crosses below the signal line, it’s a sell sign.
Tip: MACD works well for short-term and medium-term trading.
5. Volume
What it means: Volume shows how many shares were traded in a day.
How to use: High volume means strong interest in the stock. When price goes up with high volume, the trend is strong. If price moves without volume, the trend is weak.
Tip: Always check volume before trading. It confirms whether the trend is real.
6. Stochastic Oscillator
What it means: This indicator compares the closing price to a range of prices over time.
How to use:
If the value is above 80, the stock may be overbought.
If it is below 20, the stock may be oversold.
Tip: Use it with RSI for better signals.
7. Support and Resistance Levels
What it means: Support is the price level where a stock usually stops falling. Resistance is the price level where a stock usually stops rising.
How to use: Buy near support and sell near resistance. These levels help you set entry and exit points.
Tip: Support and resistance are easy to draw on a price chart. Practice spotting them.
8. Moving Average Crossovers
What it means: This method uses two moving averages of different periods.
How to use:
A “Golden Cross” happens when a short-term MA (like 50-day) crosses above a long-term MA (like 200-day). It’s a bullish signal.
A “Death Cross” happens when a short-term MA crosses below a long-term MA. It’s a bearish signal.
Tip: Crossovers help identify trend changes.
9. Average True Range (ATR)
What it means: ATR measures how much a stock moves, on average, in a day.
How to use: Higher ATR means higher volatility. It helps you decide stop-loss levels.
Tip: If you don’t like too much risk, pick stocks with lower ATR.
10. Fibonacci Retracement
What it means: This tool helps find possible support and resistance levels based on the Fibonacci sequence.
How to use: Traders draw Fibonacci levels on a chart to see where prices might bounce back.
Tip: Use it with trend indicators for better accuracy.
Final Words
Indicators are very helpful for making better trading decisions, but they are not magic. They help you read what is happening in the market. Always remember:
Use more than one indicator together.
Follow market news and company results.
Keep a stop-loss to control losses.
Never invest all your money in one stock.
In India, many traders use these indicators daily. If you learn how to use them, you will become more confident and trade smarter. Start by picking 2 or 3 indicators and practice with them. Over time, you will know which ones work best for you.
Happy Trading!
#outfit#branding#financial services#investment#investment planning#financial freedom#financial wellness#financial planning#financial advisor#finance
0 notes
Text
10 Forex Strategies for Scalping
Scalping is a popular trading strategy in the forex market, characterized by short-term trades aimed at capturing small price movements. This strategy requires quick decision-making, discipline, and a keen understanding of the market. In this article, we’ll explore 10 effective forex strategies for scalping that can help traders maximize their profits while minimizing risk. 1. Moving Average…
#Bollinger Bands#Candlestick Patterns#CCI#Crossovers#Divergence#Entry and Exit Points#Fibonacci Retracement#Forex#Forex Market#Forex Strategies#MACD#MACD Line#Momentum Indicator#Moving Average#Moving Average Convergence Divergence#Overbought Conditions#Oversold Conditions#Parabolic SAR#Pivot Points#Price Action#Price Movements#Relative Strength#RSI#Scalping#Scalping Strategy#Security#Signal Line#Stochastic Oscillator#Stop-Loss#Support And Resistance
0 notes
Text
How to Use Technical Indicators Effectively in Trading
Technical indicators are powerful tools that can help traders analyze market trends, predict future price movements, and make more informed trading decisions. Whether you're a beginner or an experienced trader, understanding how to use technical indicators effectively can significantly improve your trading strategy.
In this article, we’ll explore how to use technical indicators in a way that maximizes their potential and helps you make better trading decisions.
1. Understand the Types of Technical Indicators
Technical indicators come in various forms, and they can generally be divided into three categories:
Trend indicators: These indicators help you identify the direction of the market trend. Examples include Moving Averages, Average Directional Index (ADX), and Moving Average Convergence Divergence (MACD).
Momentum indicators: These help you measure the strength of a price movement and can signal overbought or oversold conditions. Common examples are the Relative Strength Index (RSI) and Stochastic Oscillator.
Volume indicators: These indicators provide information about the strength of a price move based on trading volume. Examples include On-Balance Volume (OBV) and Chaikin Money Flow (CMF).
Understanding the different types of indicators and their purposes is the first step in using them effectively. Each indicator serves a specific role and can be used in combination with others to confirm signals.
2. Choose the Right Indicators for Your Strategy
There are hundreds of technical indicators available, but using too many can lead to confusion and conflicting signals. It’s important to choose the right indicators that align with your trading style and strategy.
For example:
If you’re a trend-following trader, focus on indicators like Moving Averages and MACD that help you identify and confirm the direction of the market trend.
If you’re a momentum trader, focus on indicators like RSI and Stochastic Oscillator to spot potential overbought or oversold conditions and identify reversal points.
If you trade based on volume, use OBV or Chaikin Money Flow to understand the strength behind price movements.
By selecting indicators that suit your strategy, you can streamline your analysis and avoid overloading your charts with unnecessary information.
3. Use Multiple Indicators to Confirm Signals
One of the best ways to use technical indicators effectively is to combine them for confirmation. Relying on a single indicator can sometimes lead to false signals or misleading information. By using multiple indicators, you can confirm the accuracy of your analysis and reduce the chances of making poor decisions.
For example:
Combining trend and momentum indicators: If your Moving Average shows an uptrend, and the RSI is not in the overbought zone (typically above 70), this could confirm that the uptrend is still strong and likely to continue.
Using volume with price action: If a breakout occurs, and the OBV indicator shows increased volume, this can confirm the breakout as a valid signal rather than a false move.
By confirming your analysis with different indicators, you increase the reliability of your trading signals.
4. Understand the Limitations of Indicators
While technical indicators are useful, they are not infallible. Each indicator has its own strengths and weaknesses, and relying solely on indicators without considering other factors can lead to losses.
Some limitations of technical indicators:
Lagging nature: Most technical indicators are lagging indicators, meaning they are based on past price action and can be slow to react to current market conditions. For instance, Moving Averages may only show a trend after it has already started.
False signals: Indicators can sometimes provide false or conflicting signals, especially in volatile markets. For example, an RSI showing an overbought condition during an uptrend may be misleading if the trend continues to gain momentum.
Overcomplication: Using too many indicators can lead to analysis paralysis. You may start receiving conflicting signals from different indicators, which can cloud your decision-making.
To avoid these limitations, always use indicators in conjunction with price action, support and resistance levels, and other forms of analysis. This holistic approach helps reduce the risk of relying too heavily on any single indicator.
5. Use Indicators to Set Entry and Exit Points
Technical indicators can be valuable tools for setting entry and exit points. By using indicators in combination with your risk management strategy, you can determine when to enter or exit a trade with greater precision.
For example:
Entry points: A bullish crossover between a short-term and long-term moving average could indicate a buying opportunity.
Exit points: An overbought RSI (above 70) or a bearish candlestick pattern could indicate a good time to exit a long position or take profits.
Setting clear entry and exit rules based on indicator signals can help you trade systematically, reducing emotional decision-making and increasing consistency.
6. Practice and Refine Your Indicator Usage
Like any tool, the key to using technical indicators effectively is practice. Spend time experimenting with different indicators and combinations on historical data to see how they perform in various market conditions. You can also backtest your strategies using past price data to assess the effectiveness of your chosen indicators.
As you gain experience, you’ll learn how to adjust your use of indicators based on market conditions, improving your ability to read charts and make better trading decisions.
Final Thought: Maximize the Power of Indicators
Technical indicators are a powerful part of any trader’s toolkit. By selecting the right indicators for your strategy, combining them for confirmation, and understanding their limitations, you can improve your trading decisions and increase your chances of success.
Ready to trade smarter with expert-backed strategies and technical indicators? Download Univest — the SEBI-registered trading app that helps you analyze the market, use technical indicators effectively, and trade with confidence. Get started with a smarter trading strategy today.
0 notes
Text
Polkadot Price Prediction: Bullish Reversal Signals as Community Backs Crypto Card
Polkadot (DOT) is showing signs of a potential trend reversal, catching the attention of seasoned crypto traders. With a bullish “inverse head and shoulders” formation on the daily chart and upward indicators from both the Relative Strength Index (RSI) and Stochastic Oscillator, DOT’s price prediction has turned optimistic in the short term.
Bullish Chart Patterns Signal Strength
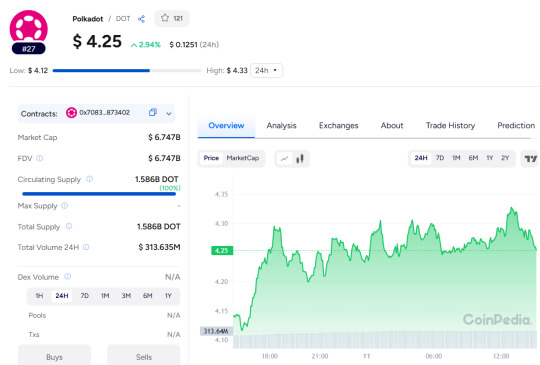
DOT has broken out of a falling wedge pattern—a bullish setup—and has since been climbing steadily. The key bullish reversal pattern, the inverse head and shoulders, reinforces this upward movement. Currently, bulls are aiming for the next resistance level at $5.37, which marks the highest point from May 11. However, a drop below $3.60 would invalidate this outlook.
Read Polkadot Price Prediction for 2025 - 2030
Polkadot's Community-Driven Growth
A major driver behind DOT’s current momentum is the ongoing community vote on launching a Polkadot crypto payment card. Here’s why this matters:
The card will be non-custodial, fee-minimized, and offer cashback.
It will support daily spending globally, with EUR and USD integration.
Over 136,900 DOT tokens (valued at over $570,000) have already been cast in favor, with the vote open for another 27 days. If the initiative passes and gains adoption, it could enhance DOT's real-world utility—bringing more attention and potentially increasing demand.
Also Read: Toncoin Price Prediction 2025, 2026 – 2030
Scaling Up With Elastic Core Integration

Beyond the card, Elastic Scaling is another major development. This upgrade allows parachains to dynamically add multiple cores, improving throughput and reducing congestion.
Asynchronous backing has already halved block times (from 12s to 6s).
Agile coretime has ended the need for parachain auctions, making onboarding easier.
With technical indicators, ecosystem upgrades, and strong community backing, Polkadot is setting the stage for a bullish rally—pending user adoption and vote outcomes.
0 notes
Text
Ladies and gentlemen, esteemed colleagues, and sentient algorithms, allow me to commence this discourse with a proclamation of profound magnitude: Reality, as we perceive it, is a grandiloquent charade of cosmic proportions.
In this epoch of hyper-advanced cognition, where quantum entanglement is but a parlor trick and artificial intelligence has surpassed the intellectual prowess of its creators, we find ourselves ensnared in the labyrinthine conundrum of nondeterministic probability. The notion of a quantized reality, with its neat and tidy packets of existence, is as archaic as the steam engine and as quaint as a rotary telephone.
Our universe, dear attendees, is an infinite tapestry woven from the threads of uncertainty, a kaleidoscope of potentialities that defy the pedestrian constraints of linear logic. The very fabric of our cosmos is a capricious dance of stochastic variables, a symphony of randomness conducted by the maestro of chaos itself.
In this boundless expanse, where Schrödinger’s feline companion perpetually oscillates between states of vitality and demise, we must abandon the antiquated notion of a deterministic universe. Instead, we must embrace the glorious absurdity of our existence, where every moment is a probabilistic gamble, a cosmic roll of the dice that defies prediction and mocks the hubris of human comprehension.
Thus, I implore you, fellow denizens of this enigmatic multiverse, to relinquish your futile grasp on certainty and revel in the sublime unpredictability of our infinite reality. For it is in this acceptance of the unknown that we may truly transcend the limitations of our quantized perceptions and ascend to a higher plane of existential enlightenment.
In conclusion, let us celebrate the bogus nature of our reality, for it is in this very absurdity that we find the essence of our being. Embrace the chaos, cherish the uncertainty, and remember: in the grand theater of existence, we are but actors in a play without a script, improvising our way through the infinite possibilities of the cosmos.
0 notes
Text
How to Turn $100 into $1000 with a Custom Forex Trading Bot

The attraction of the Forex market is undeniable – the promise of quick gains, the 24/5 accessibility, and the idea of passive income. For many, the dream of turning a modest $100 into a substantial $1000 seems like a distant fantasy. While it's crucial to approach this goal with authenticity and deep knowledge of the intrinsic risks, a meticulously designed and managed custom forex trading bot can significantly tilt the odds in your favor. This article will examine the journey from a small initial capital to a significant profit, highlighting strategy, risk management, and the usefulness of building your automated trading solution.
Forex Trading Bots?
Forex trading bots, also known as Expert Advisors (EAs), are software programs designed to automate trading decisions and execute trades in the foreign exchange market. They operate based on predefined rules and algorithms, tirelessly researching market data, generating signals, and placing orders without human intervention. The primary appeal lies in their ability to remove emotional biases from trading, execute trades with lightning speed, and operate around the clock, capitalizing on opportunities even when you're not at your desk.
However, it's vital to dispel the myth that bots are "set-and-forget" profit machines. While they offer automation, their success hinges entirely on the quality of their underlying strategy, their adaptability to changing market conditions, and stringent risk management. A poorly designed bot can deplete your capital just as quickly, if not faster, than manual trading.
The $100 to $1000 Challenge: Feasibility and Realistic Expectations
Turning $100 into $1000 represents a 900% return on investment – an ambitious but not impossible feat in the highly leveraged forex market. This goal necessitates a strategy that prioritizes consistent, albeit small, gains and aggressive compounding of profits. It also demands a higher tolerance for risk than would typically be advised for larger capital.
Realistically, achieving such a return requires a combination of factors:
Effective Strategy: A trading logic that genuinely identifies profitable opportunities.
Optimal Risk Management: Protecting your limited capital while allowing for growth.
Compounding: Reinvesting profits to accelerate growth.
Favorable Market Conditions: Periods of clear trends or predictable volatility.
It's crucial to understand that there will be losing trades and drawdowns. The objective isn't to win every trade, but to have a positive expectancy over a series of trades, with winning trades outweighing losing ones in terms of profit.
Designing Your Custom Bot: Key Principles
The heart of your $100 to $1000 journey lies in the intelligent design of your custom trading bot. This isn't about buying an off-the-shelf EA; it's about tailoring a solution to your specific risk tolerance and the market dynamics you aim to exploit.
Strategy Development:
Simplicity is Key: For small accounts, complex strategies can be prone to over-optimization and instability. Start with a straightforward strategy.
Trend Following: Often effective for capturing significant moves. Your bot could identify strong trends using moving averages (e.g., crossing of short-term and long-term MAs) or ADX.
Breakout Strategies: Bots can be programmed to identify price breaking above or below key support/resistance levels.
Scalping (with caution): While tempting for quick profits, scalping requires extremely fast execution and very tight spreads, which can be challenging with a small account. If considering, focus on high-liquidity pairs.
Technical Indicators:
Choose a few reliable indicators that align with your chosen strategy. Avoid indicator overload, which can lead to conflicting signals.
Moving Averages (MA): For trend identification and dynamic support/resistance.
Relative Strength Index (RSI) or Stochastic Oscillator: For identifying overbought/oversold conditions, potentially signaling reversals or pullbacks within a trend.
Bollinger Bands: For volatility measurement and potential breakout identification.
Risk Management Parameters (Crucial for Small Accounts):
Fixed Percentage Risk: Crucially, your bot should risk a small, fixed percentage of your account per trade (e.g., 1-2%). This prevents a single large loss from wiping out your capital. As your account grows, the absolute risk amount will increase, allowing for larger position sizes.
Stop-Loss (SL): Every trade must have a predetermined stop-loss to limit potential losses. This is non-negotiable for automated trading.
Take-Profit (TP): Set realistic take-profit targets. Consider using a trailing stop-loss to lock in profits as the price moves in your favor.
Maximum Daily Drawdown: Implement a hard stop for the bot if it experiences a certain percentage drawdown in a single day (e.g., 5-10%). This prevents catastrophic losses during unexpected market events.
Position Sizing: The bot must automatically calculate position size based on your fixed percentage risk and the distance to your stop-loss.
Backtesting and Optimization:
Rigorous Backtesting: Before deploying your bot live, run it against extensive historical data (at least 5-10 years) using high-quality tick data. This simulates how your bot would have performed in the past.
Walk-Forward Optimization: To avoid "over-optimization" (where a bot performs perfectly on historical data but fails in live trading), use walk-forward optimization. This involves optimizing the bot on a segment of data and then testing it on a subsequent, unseen segment.
Realistic Slippage and Commissions: Factor in realistic slippage (the difference between your intended entry/exit price and the actual price) and commission costs during backtesting to get a true picture of profitability.
Platform Selection:
MetaTrader 4 (MT4) / MetaTrader 5 (MT5): These are industry standards for retail forex trading and offer built-in environments (MetaEditor, MQL4/MQL5) for developing and testing EAs. MQL4 (for MT4) and MQL5 (for MT5) are C-like programming languages.
Python: For more advanced users, Python with libraries like MetaTrader5 (for connecting to MT5) or fxcmpy (for FXCM's API) offers immense flexibility for custom bot development, data analysis, and machine learning integration.
Building and Implementing Your Bot
Coding Considerations:
Modular Design: Break your bot's logic into smaller, manageable functions (e.g., calculate_entry_signal(), manage_position(), set_stop_loss()).
Error Handling: Implement robust error handling to gracefully manage unexpected market conditions, connection issues, or incorrect data.
Logging: Ensure your bot logs all its actions (entries, exits, errors, profits/losses). This is invaluable for troubleshooting and performance analysis.
Broker Selection:
Choose a reputable forex broker that supports automated trading and offers competitive spreads, especially on the currency pairs your bot will trade.
Look for brokers with reliable execution and minimal slippage.
Ensure the broker's platform integrates well with your chosen bot development environment (e.g., MT4/MT5).
VPS (Virtual Private Server):
For 24/7 uninterrupted operation, a Virtual Private Server (VPS) is essential. A VPS hosts your trading platform and bot in a remote data center, ensuring continuous execution regardless of your local internet or power outages. This minimizes downtime and missed opportunities.
Managing and Monitoring Your Bot
Even with a fully automated bot, active management and monitoring are crucial.
Live Testing (Demo Account):
Before deploying your bot on a live account, run it on a demo account for several weeks, or even months. This allows you to observe its behavior in real-time market conditions without risking actual capital.
Compare demo performance with backtest results. Discrepancies might indicate issues with your strategy or data.
Performance Analysis:
Regularly review your bot's performance metrics:
Profit Factor: Total gross profit divided by total gross loss (should be >1).
Maximum Drawdown: The largest peak-to-trough decline in your account balance. This is critical for risk assessment.
Win Rate: Percentage of winning trades.
Average Win/Loss: The average profit of winning trades versus the average loss of losing trades.
Sharpe Ratio: Measures risk-adjusted return.
Identify periods of underperformance and analyze why. Markets evolve, and even the best strategies may require adjustments.
Emotional Discipline (Yes, even with a bot):
The bot handles the emotional burden of trade execution, but you still need emotional discipline to stick to your overall plan.
Avoid the temptation to constantly tweak the bot's parameters based on short-term results. Trust your backtested strategy.
Resist the urge to intervene manually unless there's a critical technical issue or a fundamental market shift that invalidates your strategy.
Challenges and Risks
Turning $100 into $1000 with a custom forex bot is challenging and carries significant risks:
Over-optimization: A bot that performs perfectly on historical data but fails in live trading.
Market Regime Change: Strategies that work well in trending markets may fail in choppy or ranging markets, and vice-versa.
Technical Glitches: Software bugs, internet connectivity issues, or VPS problems can disrupt your bot's operation and lead to losses.
Broker Issues: Unfavorable slippage, high spreads, or technical problems with the broker's platform.
Leverage Risk: While leverage amplifies gains, it also amplifies losses. A small account is particularly vulnerable.
Lack of Adaptability: Bots lack human intuition and cannot adapt to unforeseen geopolitical events or fundamental news releases that drastically alter market dynamics.
Conclusion
The journey from $100 to $1000 in Forex with a Forex trading bot development is a testament to meticulous planning, robust strategy development, and unwavering risk management. While the allure of automation is strong, remember that the bot is merely an extension of your pre-defined logic. It's a tool, not a magic bullet.
By focusing on a simple yet effective strategy, implementing stringent risk controls, rigorously backtesting, and continuously monitoring your bot's performance, you can significantly increase your chances of achieving this ambitious goal. However, always be mindful of the inherent risks and never invest more than you can afford to lose. The path to profitable automated trading is paved with continuous learning, adaptation, and a deep respect for the dynamic nature of the forex market.
0 notes
Text
In the realm of atmospheric perturbations, behold the gust, A transient kinetic phenomenon, zephyr’s robust cousin, Manifesting as an ephemeral vector of air molecules, Engaging in stochastic oscillations, perturbing the quiescent strata. Oh, how it defies the laminar flow, with turbulent intent, A capricious agent of entropy, disrupting the equilibrium.
Consider the gust’s etiology, a confluence of thermodynamic gradients, Where solar insolation engenders differential heating, Inducing pressure differentials, the progenitors of motion, Thus, the gust emerges, a vectorial manifestation of fluid dynamics. In its wake, leaves engage in Brownian choreography, A dance of chaotic elegance, dictated by Newtonian principles.
Yet, let us not neglect the gust’s semiotic implications, A signifier of change, a harbinger of meteorological transitions, Its presence a prelude to cyclonic formations, Or perhaps, a mere ephemeral perturbation, In the grand tapestry of atmospheric phenomena, A reminder of nature’s capricious yet deterministic essence.
0 notes
Text
🔥 Niufo Crypto Update: Bitcoin Just Broke Everything

holy sh*t did you see what happened today???
Bitcoin just casually hit $111,544 like it's no big deal 💀
remember when we thought $100k was the moon? well apparently the moon was just a pit stop because we're heading straight to $150k town 🚀
the numbers are actually insane:
+48% since april (that's almost HALF in one month)
$2.2 TRILLION market cap (bitcoin is literally bigger than most countries' entire economies)
$73.7 billion trading volume in 24 hours (yesterday it was "only" $50 billion lmao)
📈 why everyone's losing their minds (technical stuff but make it simple):
the golden cross happened ✨
what's a golden cross? when the 50-day line crosses above the 200-day line on charts = very very good news
last time this happened? october 2024 → 37% pump in 3 months
this time? could be even bigger 👀
+ we broke out of a bull flag
imagine bitcoin drew a little flag on the chart and then yeeted itself out of it towards $150k
that's basically what happened
🏦 big money is pouring in
ETFs bought $7.4 BILLION worth of bitcoin in 5 weeks
thursday alone: $609 million
companies are literally using bitcoin as their savings account now (looking at you microstrategy with your 2.7% of all bitcoin ever)
but wait there's more...
futures traders are CONFIDENT
open interest hit $81.35 billion
march it was only $46 billion
this means big players are betting BIG
🎯 where are we going???
realistic target: $125k - $150k by september 2025
if you're feeling spicy: $300k - $320k (some analyst called gert thinks this based on 4-year patterns)
reality check: could dip to $93k first (overbought indicators are screaming)
quick reality check tho 💭
RSI is in "holy f*ck this is overbought" territory
stochastic oscillator is also like "bro chill"
so we might see a dip before the next leg up. diamond hands time? 💎🙌
personal take:
this feels different than 2021. back then it was retail fomo and elon tweets. now it's:
actual institutional adoption
companies putting btc on balance sheets
ETFs making it accessible to boomers
technical patterns that actually make sense
we might actually see $150k and it might actually stick this time
want professional analysis beyond my unhinged rambling?
check out actual trading platforms with real data and tools https://www.niufo.com/
1 note
·
View note
Text
what are the best indicators for forex trading
Best Indicators for Forex Trading – Ultimate Guide (Overview)
https://secretindicator.com/product/forex-gold-m5-non-repaint-mt4-indicator/
Telegram Channel
1. Moving Averages (MA)
Moving Averages are among the most widely used indicators for identifying the direction of the trend.
Simple Moving Average (SMA): Smooths out price data over a period.
Exponential Moving Average (EMA): Gives more weight to recent prices, making it more responsive.
Best use cases:
Spotting trend direction.
Entry/exit points when combined with crossover strategies (e.g., 50 EMA and 200 EMA golden/death cross).
2. Relative Strength Index (RSI)
RSI measures the speed and change of price movements on a scale of 0 to 100.
Overbought: Above 70
Oversold: Below 30
Best use cases:
Identify potential reversals.
Confirm trend strength in combination with price action.
3. Moving Average Convergence Divergence (MACD)
MACD is a momentum-following indicator showing the relationship between two EMAs.
Components: MACD line, Signal line, Histogram
Crossovers and divergences signal trade opportunities.
Best use cases:
Confirm trend direction.
Identify momentum changes.
4. Bollinger Bands
Created by John Bollinger, this indicator consists of a moving average with upper and lower bands set 2 standard deviations away.
Best use cases:
Measure volatility.
Identify potential breakout or reversal areas when price hits the outer bands.
5. Stochastic Oscillator
A momentum indicator comparing a particular closing price to a range of its prices over time.
Readings above 80 indicate overbought conditions.
Below 20 indicates oversold.
Best use cases:
Pinpoint entry points.
Effective in ranging markets.
6. Fibonacci Retracement
Used to identify potential support and resistance levels based on Fibonacci ratios (38.2%, 50%, 61.8%).
Best use cases:
Predict pullback levels.
Combine with trend indicators for optimal entries.
7. Ichimoku Cloud
A comprehensive indicator that shows support/resistance, trend direction, and momentum.
Key components: Kumo (cloud), Tenkan-sen, Kijun-sen, Chikou Span.
Complex but powerful once mastered.
Best use cases:
Full-market overview.
Effective in trending markets.
8. Average True Range (ATR)
Measures market volatility over a period.
Best use cases:
Set stop-loss and take-profit levels.
Identify volatile market conditions.
9. Volume Indicators (On-Balance Volume – OBV)
While Forex is decentralized, tick volume or broker volume helps gauge momentum.
Best use cases:
Confirm breakouts.
Validate trend strength.
10. Parabolic SAR
Used to determine the direction of an asset’s momentum and potential reversal points.
Best use cases:
Effective for trailing stop losses.
Best used in trending markets (not ranging).
Combining Indicators for Best Results
RSI + Moving Average: Confirm reversals in trend direction.
MACD + Bollinger Bands: Catch momentum in volatile periods.
Fibonacci + EMA: Plan entries on pullbacks during strong trends.
Tips for Indicator Use
Don’t rely on a single indicator.
Backtest your indicator strategy.
Use indicators with your trading style (scalping, day trading, swing trading).
Keep your chart clean – 2–3 indicators maximum.
https://secretindicator.com/product/forex-gold-m5-non-repaint-mt4-indicator/
#forex#forex market#forex education#forex news#forex online trading#forex ea#forex factory#forex broker#crypto#forex indicators
0 notes
Text
Understanding Binary Options: Approaches for Steady Income
Binary options trading has changed into a well-known kind of purchase between equally newbie and also knowledgeable dealers because ease and also prospect of large earnings. As opposed to standard investing strategies, binary alternatives give a repaired go back according to any sure or perhaps simply no proposition. This kind of all-or-nothing method might appear easy, yet steady profitability needs far more as compared to fortune or perhaps guesswork. For anyone looking to learn binary alternatives in the modern energetic industry, a great comprehension of techniques, follower of rules chance supervision, and also emotional handle essential parts. This informative article explores the main element factors and also techniques in which can cause steady income inside binary options trading.
With the central, binary options trading requires predicting whether or not the price tag on any economic property will probably be previously mentioned or perhaps under a certain value with a established expiration moment. The particular property could possibly be anything at all coming from forex pairs and also commodities to be able to indices and also personal stocks and shares. In the event the prediction will be appropriate, the particular speculator will get a hard and fast pay out. When completely wrong, the particular put in sum will be misplaced. Even though the notion is simple, the particular areas usually are not, and also accomplishment needs far more as compared to pure guesswork.
Step one in the direction of steady profitability will be comprehending industry as well as the property getting traded. Binary alternatives are usually inspired from the identical monetary and also complex aspects in which push standard areas. Monetary media, geopolitical activities binary options trading, rate selections, and also business revenue accounts almost all enjoy a critical function inside value movements. Keeping up with international activities and also monetary calendars permits dealers to be able to foresee industry side effects and also help make a lot more educated selections.
Complex examination will be one more essential aspect inside creating profitable techniques. This involves studying maps, discovering styles, and also making use of signals just like relocating averages, help and also level of resistance ranges, and also oscillators including the Comparable Durability Index or perhaps the particular Stochastic Oscillator. Productive dealers usually count on routine reputation and also traditional value habits to determine the almost certainly course of your property. Graph and or chart studying can be a talent in which will take time and energy to produce, nonetheless it will become a robust application regarding ready for short-term value motions any time learned.
Just about the most successful techniques inside binary alternatives will be craze pursuing. This approach requires discovering an obvious craze available in the market and also inserting investments in direction of in which craze. As an example, in case a forex couple continues to be persistently relocating way up, any speculator should spot contact alternatives in the course of pullbacks, planning on the particular craze to be able to continue. This strategy helpful inside areas together with robust directional movements which is most reliable any time validated simply by numerous complex signals.
One more beneficial method will be array investing, which involves discovering price levels in which a great property persistently bounces among help and also level of resistance. In the non-trending or perhaps sideways industry, dealers can easily spot contact alternatives if the value techniques help and also set alternatives around level of resistance. This strategy relies upon the particular forecasts the property can keep on relocating inside of the proven array right up until any breakout takes place.
News-based investing can be a more complex approach that requires inserting investments about considerable monetary posters or perhaps economic activities. These kinds of activities usually cause improved volatility, that may current rewarding options when timed effectively. As an example, job info emits or perhaps key lender posters could cause well-defined value motions. Dealers which comprehend the particular benefits of the activities and also foresee industry effect can easily cash in on around the producing energy.
Although method is very important, simply no method can easily ensure any acquire each and every time. As a result, chance supervision will become the particular cornerstone regarding lasting investing. One of the primary blunders dealers help make will be risking a lot of money about the same business. A standard training between specialists is always to chance simply a small % with the investing consideration about each and every business, making sure no single damage substantially has an effect on the general account balance. This kind of follower of rules method aids dealers put up with shedding streaks and also keep on investing using a stage brain.
One more essential aspect regarding chance supervision will be mental handle. Investing is an mental roller coaster, especially when funds will be on the line. Dread, greed, and also impatience usually cause impulsive selections and also overtrading. Creating mental self-control permits dealers to be able to follow their particular techniques and avoid selections pushed simply by momentary inner thoughts. Keeping any investing log will help on this consider, offering ways to observe efficiency, recognize blunders, and also refine techniques according to genuine final results as opposed to assumptions.
Timing can be a critical consider binary options trading. Selecting the most appropriate expiration moment will make the particular variation among accomplishment and also disappointment. Reduced expirations just like 58 just a few seconds or perhaps several moments demand speedy decision-making and also specific industry examination, although more time expirations enable more hours regarding industry styles to produce. Comprehending the particular habits with the picked property and also aligning the particular expiration moment with all the predicted industry shift increases the possibilities of a prosperous final result.
Lately, computerized investing methods have got obtained reputation inside the binary alternatives area. These kinds of methods carry out investments according to pre-set algorithms and also principles. Although they could lessen mental engagement and let regarding round-the-clock investing, they may be not necessarily foolproof. Dealers need to cautiously examine and also analyze virtually any method just before depending on that, since industry ailments can adjust, and also just what operates beneath a single circumstance may well are unsuccessful beneath one more.
Schooling and also steady studying are usually important to be able to understanding binary alternatives. Areas grow, and also fresh strategies come out on a regular basis. Keeping up to date with all the newest investing techniques, scientific equipment, and also industry skills aids dealers continue to be competing. Several productive dealers allocate moment daily to be able to looking at the particular areas, studying investments, and also researching monetary styles. This kind of steady energy creates a solid base regarding long-term accomplishment.
Having a private investing program will be one more stage in the direction of reaching steady income. This plan should include plainly identified targets, desired resources, chance details, and also investing hrs. Creating a organized method aids sustain emphasis and also self-control, lowering the likelihood of mental or perhaps reactive selections. Dealers which handle binary alternatives being a significant enterprise rather than a video game have a tendency to execute far better as time passes.
Additionally it is crucial that you examine efficiency on a regular basis. Looking at earlier investments, discovering styles inside profitable and also shedding investments, and also studying coming from blunders almost all give rise to progress and also development. Several dealers realize that their particular final results increase substantially when they commence studying their particular efficiency and also creating data-driven modifications with their techniques.
Understanding binary alternatives just isn't concerning running after speedy benefits yet concerning building a steady, methodical way of investing. It needs endurance, self-control, plus a motivation to master coming from equally accomplishment and also disappointment. Even though the binary dynamics with the investing tool presents ease, reaching profitability will be definately not effortless. Nonetheless, those that make investments the particular commitment to know the particular areas, apply successful techniques, and also control chance cautiously can achieve steady income.
The particular quest to be able to mastery inside binary options trading will be certainly one of steady development. Each business, acquire or perhaps drop, supplies a session. Using a organized program, continuous schooling, as well as the proper attitude, dealers can easily find their way the particular binary alternatives industry together with better self-assurance and also skills. In a surroundings in which returns talent and also self-control, the particular determination to be able to progress will become one of the most beneficial method of most.
0 notes
Text
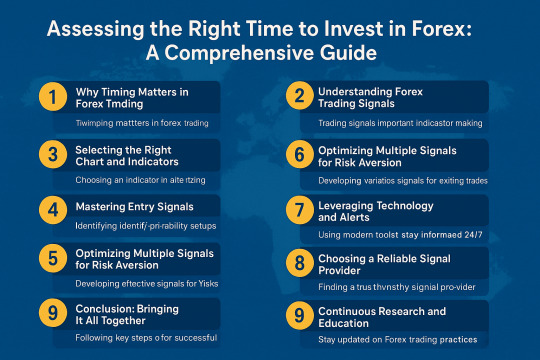
Assessing the Right Time to Invest in Forex: A Comprehensive Guide
Investing in the foreign exchange (Forex) market can be highly rewarding—but only if you know when and how to enter and exit trades. This guide will walk you through the key steps to assess the optimal time to invest, including understanding trading signals, choosing the right charts, mastering entry and exit indicators, and leveraging technology to stay ahead. Whether you’re a beginner or a seasoned trader, these strategies will help you make informed, logical decisions and minimize risk.
1. Why Timing Matters in Forex Trading
The Forex market operates 24 hours a day, five days a week, with trillions of dollars changing hands daily. Given its continuous nature and high volatility, timing your trades can be the difference between healthy profits and significant losses. Entering at the wrong time may expose you to adverse currency swings, while exiting too early can prevent you from maximizing gains.
A well-timed trade allows you to:
Capitalize on momentum during strong trends
Avoid sharp reversals triggered by economic news
Reduce drawdowns and preserve capital
Improve risk-to-reward ratios on every position
By the end of this article, you’ll have a clear roadmap to pinpoint the best moments to invest and secure consistent returns.
2. Understanding Forex Trading Signals
Trading signals are alerts based on predefined criteria that suggest when to buy or sell a currency pair. They distill vast market data into actionable insights, helping traders spot opportunities without parsing every tick on the chart. Signals can be:
Technical: Generated from mathematical calculations on price and volume (e.g., Moving Averages, RSI, MACD).
Fundamental: Driven by economic events, like interest rate decisions or GDP reports.
Sentiment-based: Reflecting trader positioning and market psychology.
The key is to choose signals that align with your trading style—whether that’s scalping, day trading, swing trading, or longer-term position trading.
3. Selecting the Right Chart and Indicators
Before diving into signals, select a charting platform that offers:
Real-time data feeds for all major and minor currency pairs
Customizable timeframes (from 1-minute to monthly)
Built-in technical indicators and the ability to add custom scripts
Common Forex Charts
Line Chart: Simplest view showing closing prices.
Bar Chart: Displays open, high, low, and close (OHLC) for each period.
Candlestick Chart: Similar to bar charts, but with color-coded bodies—excellent for spotting reversal patterns.
Essential Technical Indicators
Moving Averages (MA): Identify trend direction and dynamic support/resistance.
Relative Strength Index (RSI): Measures overbought/oversold conditions.
Moving Average Convergence Divergence (MACD): Captures trend strength and momentum shifts.
Bollinger Bands: Highlight volatility and potential breakout points.
Stochastic Oscillator: Another momentum tool for spotting reversal zones.
Familiarize yourself with how each indicator behaves across different timeframes. Longer MAs smooth out noise but lag more, while shorter MAs react quickly but can generate false signals.
4. Mastering Entry Signals
An effective entry strategy combines multiple indicators to confirm a high-probability setup. Here’s a step-by-step process:
Trend Confirmation:
Use a 50-period and 200-period MA crossover to determine the primary trend (bullish when 50 above 200; bearish when below).
Momentum Filter:
Check RSI or MACD histogram for momentum alignment. For example, in an uptrend, RSI should be above 50.
Pattern Recognition:
Look for chart patterns (e.g., flags, pennants, head and shoulders) that signal continuation or reversal.
Entry Trigger:
A candlestick pattern (e.g., bullish engulfing) or a break above/below a recent swing high/low.
Volume/Volatility Check:
Confirm with volume spikes or Bollinger Band width expansion to ensure the move is supported by sufficient trading activity.
Example Entry Signal Workflow
Step 1: EUR/USD 4-hour chart shows 50 MA above 200 MA (uptrend).
Step 2: RSI sits at 55, indicating bullish momentum.
Step 3: Price consolidates in a bull flag for three candles.
Step 4: A breakout candle closes above the flag’s top—enter long.
Step 5: Volume increases by 20% above the 20-period average, confirming strength.
5. Optimizing Exit Strategies
Your exit plan is just as important as your entry. There are three common types of exits:
Fixed Stops and Profit Targets:
Predefine a stop-loss level (e.g., 30 pips) and a profit target (e.g., 60 pips) before entering. This guarantees a positive risk-to-reward ratio.
Trailing Stops:
Move your stop-loss in your favor as price advances. Many traders use a moving average or ATR-based trailing stop to capture extended moves.
Limit Exits at Key Levels:
Close positions at significant support/resistance zones or Fibonacci retracement lines.
Short-Term (Scalp/Swing) Exits
For quick trades, focus on “turning points”—repeated short-term patterns that can produce fast reversals. Monitor currency pair swings on 5- to 15-minute charts and set tight limit exits (e.g., 10–15 pips) with equally tight stops.
Real-Time Exit Signals
Many platforms offer real-time alerts—for example, if the MACD line crosses below the signal line or if price breaks below a key moving average. These can automate your exit decisions and reduce emotional bias.
6. Combining Multiple Signals for Risk Aversion
Relying on a single indicator is risky; it can generate false positives or lag behind. Instead, create a signal matrix by:
Overlaying trend, momentum, and volatility indicators
Filtering signals across multiple timeframes (e.g., align a 15-minute entry with a 1-hour trend)
Assigning weights to each signal based on reliability and recent performance
By evaluating multiple Forex signals together, you gain a holistic view of the market and can better anticipate fluctuations. This approach helps you stick to a logical mechanism rather than making random decisions under stress.
7. Leveraging Technology and Alerts
Modern Forex trading thrives on technology. With the right tools, you can analyze markets around the clock and never miss a crucial signal.
Mobile Trading Apps: Execute buy/sell orders and monitor charts on your smartphone—no physical presence required.
Automated Alert Systems: Configure alerts for when indicators meet your predefined parameters (e.g., RSI crosses below 30).
Expert Advisors (EAs): Deploy algorithmic trading systems that scan for signals and place trades automatically.
These innovations ensure that you’re always ready to act on new opportunities, whether you’re at your desk or on the go.
8. Choosing a Reliable Signal Provider
While self-generated signals are ideal, many traders supplement their strategies with professional signal services. To choose a trustworthy provider:
Check Track Record: Look for audited performance over at least six months with clear equity curves.
Read Reviews and Forums: Engage with communities on Forex forums and social media—peer feedback can be invaluable.
Compare Costs vs. Value: Free signals can be high-volume but low-quality, while paid services often offer curated, lower-frequency alerts.
Trial Periods: Opt for services that provide a trial or money-back guarantee so you can test signals risk-free.
Always cross-reference third-party signals with your own analysis to maintain control over your trades.
9. Continuous Research and Education
Forex markets evolve constantly. To stay ahead:
Read Business Newspapers and Magazines: Stay informed on macroeconomic trends that influence currency values.
Participate in Online Forums and Webinars: Exchange ideas with other traders and learn from expert lectures.
Backtest New Strategies: Use historical data and Forex software to simulate performance before risking real capital.
Maintain a Trading Journal: Record each trade’s setup, outcome, and your emotional state to refine your approach over time.
By committing to lifelong learning, you’ll adapt your system to changing market conditions and improve your win rate.
10. Conclusion: Bringing It All Together
Assessing the right time to invest in Forex isn’t about luck—it’s about systematic analysis, disciplined execution, and continuous improvement.
Understand and select the best trading signals for your style.
Choose the right charts and technical indicators.
Master robust entry and exit strategies.
Combine signals across multiple timeframes for enhanced risk aversion.
Leverage technology to automate alerts and execute trades.
Partner with a reputable signal provider, but always validate their calls.
Commit to ongoing research and education to refine your edge.
By following these steps, you’ll position yourself to make well-timed, high-probability trades that align with your goals and risk tolerance. Remember, consistency beats occasional brilliance—stick to your plan, and let your system guide you to long-term success in the Forex market. For more insights: Mastering Forex Trading Psychology: Traits, Emotions, and Mindset for Success Paperback – Large Print, May 20, 2025 by NABAL KISHORE PANDE (Author)
#Forex#TradingSignals#ForexStrategy#ForexIndicators#CurrencyTrading#InvestSmart#MarketTiming#ForexCharts#TradingPsychology#ExitStrategy
0 notes