#Moving Average Convergence Divergence
Explore tagged Tumblr posts
Visit Tumblr Blog
Explore Tumblr blogs with no restrictions, modern design and the best experience.
Last Seen Tumblr Blogs


Fun Fact
The KCSC sent more than 20K requests to delete posts related to prostitution and porn to Tumblr from January to June 2017.
Text
Trend Following: Forex Trading Strategy Explained
Trend following is a trading strategy that aims to capitalize on the upward or downward trends in the market. By identifying and following these trends, traders can potentially increase their profits while minimizing risks. This strategy is grounded in the belief that prices move in trends and that these trends persist over time. Understanding the Basics What is Trend Following? It is a strategy…
#ADX#Average Directional Index#DeFi#Divergence#Downtrend#Entry and Exit Points#Exponential Moving Average#Forex#Forex Traders#Forex Trading#MACD#Market Trends#Moving Average#Moving Average Convergence Divergence#Position Sizing#Price Movements#Risk Management#Security#Stop-Loss#Trading Strategy#Trend Direction#Trend Following#Trend Identification#Trend Lines
6 notes
·
View notes
Text
Chainlink In Rally Mode: Rising Channel Formation Signals Continued Climb
Chainlink (LINK) is showing renewed strength as its price moves higher within a well-defined rising channel pattern. After a period of consolidation, LINK has entered a rally mode, forming the channel, a classic signal of sustained upward movement. This technical setup suggests that the bulls are firmly in control, and unless a major shift in sentiment occurs, the uptrend could continue in the…
#chainlink#Chainlink price#Descending Channel Pattern#Link#link price#LINKUSD#linkusdt#MACD#Moving average convergence divergence#Relative Strength Index#Rising Channel Pattern#RSI#Thomas Anderson#Whales_Crypto_Trading
0 notes
Text
XRP's Monthly Chart Paints Bullish Picture: Analyst Flags Promising Trend
XRP is teetering on the edge of a significant price movement, according to insights shared by market expert Egrag Crypto. The monthly chart reveals a robust upward trend, generating anticipation for a substantial price surge. However, Egrag Crypto advocates for caution, hinting at the possibility of a brief downward correction that could unsettle less experienced investors.
The spotlight in this analysis falls on the Multi-Year Ascending Trend Line, a critical level that, if breached, could set the stage for XRP's ascent towards the $2.0 mark. Yet, investors are forewarned about the potential breakdown scenario, with XRP retracing back to $0.2.
To gauge the potential upward momentum, Egrag Crypto emphasizes the importance of closely monitoring the Moving Average Convergence Divergence (MACD) indicator. The bullish signals from the MACD, including a positive histogram and the MACD line crossing above the signal line, inject optimism into the market sentiment.
Despite the promising monthly outlook, recent developments on the 4-hour chart reveal a bearish trend as XRP dips towards the $0.53 level. The descent is marked by a descending channel, encompassing a drop from $0.58 to $0.52 in the past week. At the time of reporting, XRP is valued at $0.5265, reflecting a 4.79% decline in the ongoing session.
Technical indicators on the 4-hour chart further reinforce the prevailing bearish trend, with sell signals as the price plunges below Exponential Moving Averages (EMAs). XRP has breached the 50 and 100-day EMAs, signifying a robust bearish momentum. However, there is a potential for a rebound towards the $0.5500 level, supported by the 10-day Simple Moving Average.
In conclusion, XRP presents a promising monthly outlook, anchored by the Multi-Year Ascending Trend Line, but traders are urged to tread carefully. The MACD's positive signals add a layer of confidence, yet the concurrent bearish trends on the 4-hour chart emphasize the need for preparedness for both potential scenarios.
0 notes
Text
Types of Technical Indicators in Trading
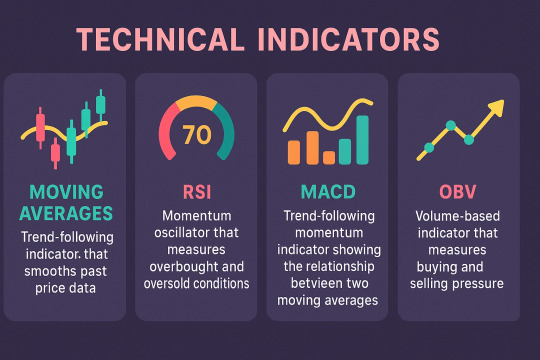
Technical indicators are essential tools used by traders to analyze market trends and make informed decisions. Among the many available, some of the most widely used types include Moving Averages, Relative Strength Index (RSI), MACD, and On-Balance Volume (OBV).
Moving Averages smooth out price data to identify trend direction over a specific period. Common types include the Simple Moving Average (SMA) and Exponential Moving Average (EMA), which help traders determine support and resistance levels and potential entry or exit points.
The Relative Strength Index (RSI) is a momentum oscillator that measures the speed and change of price movements. RSI values range from 0 to 100 and are typically used to identify overbought (above 70) or oversold (below 30) conditions, signaling potential reversals.
MACD (Moving Average Convergence Divergence) is a trend-following momentum indicator that shows the relationship between two EMAs. It helps traders identify changes in trend strength, direction, and momentum.
On-Balance Volume (OBV) uses volume flow to predict price movements. A rising OBV indicates accumulation, while a falling OBV suggests distribution, providing insights into the strength of a trend.
Using these indicators together can improve trading accuracy and help develop a solid, data-driven strategy.
Explore, all the Technical Indicators in Trading.
#Types of Technical Indicators in Trading#Technical Indicators in Trading#Indicators in Trading#trading indicators#indicators in trading
2 notes
·
View notes
Text
Mastering forex signals for trend following: a comprehensive guide
The foreign exchange market, or Forex, is a dynamic and ever-changing arena where traders seek to capitalize on currency price movements. One popular trading strategy is trend following, which involves identifying and following the prevailing market direction. Forex signals play a crucial role in assisting traders to navigate the complexities of trend following. In this comprehensive guide, we will explore the intricacies of Forex signals for trend following, helping you understand how to leverage them effectively for successful trading.

Understanding Trend Following
Trend following is a strategy that seeks to capitalize on the directionality of market prices. The basic premise is simple: identify the prevailing trend and place trades in the same direction. Trends can be upward (bullish), downward (bearish), or sideways (range-bound). Successful trend following involves entering a trade at the beginning of a trend and exiting when the trend shows signs of reversal.
The Role of Forex Signals
Forex signals serve as triggers for traders, indicating opportune moments to enter or exit a trade. These signals are generated through a thorough analysis of market data, including technical indicators, fundamental factors, and sometimes a combination of both. For trend following, signals become particularly crucial as they guide traders on when to jump on a trend and when to step aside.
Key Components of Forex Signals for Trend Following
1. Technical Indicators:
Moving Averages: These are fundamental tools in trend following. A moving average smoothens price data to create a single flowing line. Traders often look for crossovers, where short-term moving averages cross above long-term ones, as a signal to enter a trade.
Relative Strength Index (RSI): RSI measures the speed and change of price movements. A high RSI may indicate overbought conditions, suggesting a potential reversal, while a low RSI may indicate oversold conditions, signaling a potential buying opportunity.
Moving Average Convergence Divergence (MACD): MACD is a trend-following momentum indicator that shows the relationship between two moving averages of a security’s price.
2. Fundamental Analysis:
While trend following is predominantly a technical strategy, incorporating fundamental analysis can enhance the accuracy of signals. Economic indicators, interest rates, and geopolitical events can significantly impact currency trends.
3. Price Action:
Pure price action analysis involves studying the historical price movements of a currency pair. Identifying patterns, such as higher highs and higher lows in an uptrend, can provide strong signals for trend following.
Choosing a Reliable Signal Provider
With the plethora of signal providers available, it's essential to choose a reliable one. Consider the following factors:
Track Record: A provider's historical performance is a crucial indicator of their reliability. Look for providers with a consistent track record of accurate signals.
Transparency: Transparent signal providers disclose their methods, including the criteria for generating signals and their risk management strategies.
Risk-Reward Ratio: A good signal provider should have a clear risk-reward ratio for each signal, helping you manage your trades effectively.
Implementing Forex Signals for Trend Following
Once you've selected a signal provider or developed a reliable system, the implementation phase is critical. Here are some tips:
Risk Management: Set clear risk parameters for each trade. This includes defining the percentage of your trading capital you're willing to risk on a single trade.
Position Sizing: Adjust the size of your positions based on the strength of the signal and the volatility of the market.
Stay Informed: While signals provide valuable insights, staying informed about broader market trends and events is crucial. Unexpected news can impact the Forex market.
Continuous Evaluation: Regularly assess the performance of your chosen signals and be prepared to adjust your strategy if market conditions change.
Conclusion
Forex signals for trend following can be powerful tools in a trader's arsenal, helping to identify and capitalize on market trends. However, success in Forex trading requires a comprehensive understanding of both the strategy and the market itself. By combining technical indicators, fundamental analysis, and a disciplined approach to risk management, traders can use Forex signals to navigate the complex world of trend following with confidence. Remember, no strategy guarantees success, and ongoing learning and adaptation are essential for long-term success in the Forex market.
Source:
#TradeSignals#FinancialFreedom#StockMarketAlerts#InvestingWisdom#ProfitableTrades#MarketAnalysis#TradingSignals#DayTrading#ForexProfit#CryptoSignals#MarketTrends#InvestmentTips#SmartTrading#TradeSmart#TechnicalAnalysis#RiskManagement#ProfitPotential#TradingStrategies#StockPicks#EconomicIndicators#TradingEducation#MarketInsights#OptionsTrading#MarketWatch#TradeStrategy#FinancialMarkets#ForexTrading#CryptoInvesting#AlgorithmicTrading#StockMarketNews
28 notes
·
View notes
Text
Pi Network (PI) Holds Key Support - Is a Rebound Possible Ahead

Pi Network's native cryptocurrency, Pi (PI), has recently experienced significant volatility, with its price fluctuating between $1.30 and $2.00. As of March 12, 2025, PI is trading at approximately $1.67, reflecting an 18.52% increase over the past 24 hours. citeturn0search8
A key factor influencing PI's price dynamics is the upcoming Pi Day on March 14, marking the sixth anniversary of the project's launch. This date is also the deadline for users to complete their Know Your Customer (KYC) verification and migrate their mined PI from the testnet to the mainnet. Failure to do so may result in forfeiture of balances, adding pressure on users to finalize the migration. citeturn0search5
The anticipation surrounding a potential Binance listing has further fueled speculation. A recent community vote revealed that 86% of participants support PI's listing on Binance. While Binance has yet to make an official announcement, the community remains optimistic that such a listing could enhance liquidity and drive PI's price upward. citeturn0search7
Technical analysis indicates that PI is holding above the $1.40 support level. The Moving Average Convergence Divergence (MACD) shows a mild bullish crossover, suggesting potential upward momentum. However, the Relative Strength Index (RSI) stands at 35, indicating that the asset is approaching oversold territory. Key resistance levels are identified at $1.50 and $2.00. citeturn0search0
In summary, PI is currently maintaining key support levels amid market volatility. The upcoming Pi Day announcements and the potential Binance listing are pivotal events that could influence PI's price trajectory. Investors are advised to monitor these developments closely, as they may present opportunities for a rebound or signal further consolidation.
more in farmation click here
#PiNetwork#PiCoin#Crypto#Blockchain#Cryptocurrency#DigitalCurrency#PiDay#CryptoTrading#CryptoInvesting#CryptoNews#PiNetworkCommunity#FutureOfFinance#PiToTheMoon#Decentralized#Web3
2 notes
·
View notes
Text
Chart Chaser: A Trader’s Obsession with Technical Analysis on MintCFD

In the realm of online trading, a “Chart Chaser” is a trader who relies heavily on technical analysis. These traders obsessively study charts, patterns, and indicators to identify the optimal entry and exit points for their trades. While some traders focus on market news or economic fundamentals, Chart Chasers believe that the key insights lie within the patterns and trends shown in the data itself. For users on MintCFD, adopting the Chart Chaser approach can be rewarding, especially given the wide range of tools and various trading chart patterns available on the platform.
The Allure of Following Trends in Charts
Chart Chasers are drawn to technical analysis because it offers a visual and data-driven way to understand market behavior. By studying price movements, volume, and indicators, they look for recurring patterns, such as Double Bottoms, Head and Shoulders, and Moving Averages, which they believe can predict future price action. With the MintCFD trading app, traders have access to advanced charting tools that make it easy to become a Chart Chaser, allowing for in-depth analysis and strategy development.
Key Tools on the MintCFD Platform for Chart Chasers
MintCFD’s platform is rich with tools tailored for those who take a technical approach. Here are some essentials for the dedicated Chart Chaser:
Real-Time Charting Tools: MintCFD offers detailed, real-time charts that provide instant insights into price movements. For a Chart Chaser, these charts are invaluable as they capture every shift and trend in the market, allowing them to act quickly based on the latest data.
Diverse Chart Patterns: From Candlestick charts to Line charts, MintCFD provides several options, enabling traders to switch between patterns based on their trading style. For instance, Candlestick patterns are often favored by Chart Chasers because they reveal price action in detail, helping traders identify trends and reversals.
Technical Indicators: Popular indicators, such as the RSI (Relative Strength Index), MACD (Moving Average Convergence Divergence), and Bollinger Bands, are available on MintCFD to help Chart Chasers confirm their hypotheses. These indicators can signal overbought or oversold conditions, momentum changes, and potential trend reversals.
Custom Alerts: MintCFD’s alert system lets Chart Chasers set notifications based on specific price movements, helping them act on technical signals even if they’re not actively monitoring their screens. This way, they never miss a crucial trade opportunity based on their analysis.
Benefits and Pitfalls of Being a Chart Chaser
For those who love data, becoming a Chart Chaser offers unique advantages, but it also comes with some potential pitfalls. Here’s how to manage both on the MintCFD Platform:
Benefits: Technical analysis is highly data-driven, meaning decisions are based on objective data rather than emotional responses. By relying on chart patterns and indicators, Chart Chasers can create highly structured strategies with specific entry and exit points. With MintCFD’s intuitive tools, they can continuously refine their methods and explore different indicators.
Pitfalls: Focusing solely on technical analysis can lead to “analysis paralysis,” where a trader over-analyzes and hesitates to act. Additionally, ignoring market news and economic factors may leave a Chart Chaser blind to important influences. MintCFD offers market news and insights alongside technical tools, helping Chart Chasers balance their analysis with a broader context.
Master the Market on MintCFD Trading App: Stop Over-Analyzing and Start Thriving as a Chart Chaser
To succeed as a Chart Chaser without getting caught in a loop of over-analysis, it’s essential to have a plan and set clear criteria for entering and exiting trades. MintCFD’s watchlists and alert systems can help keep track of multiple assets without overwhelming yourself with constant analysis. Having a set of “go-to” indicators and patterns also helps prevent information overload.
Final Thoughts
For traders who thrive on technical data, becoming a Chart Chaser can be an exciting and rewarding journey. MintCFD is an ideal platform for these traders, with its robust charting tools, real-time indicators, and customizable alerts. While it’s easy to get caught up in the details, the best Chart Chasers know when to step back and trust their analysis. By balancing data with a disciplined approach, MintCFD users can make the most of their technical strategies and succeed in the dynamic world of trading.
Take control of your trading journey with the MintCFD Trading App
#mintcfd#cfdtrading#cryptotrading#onlinetrading#tradingstrategy#tradingsignals#forextrading#forexstrategies#cryptoinvesting#stockmarket
2 notes
·
View notes
Text
Buy In October! Best Six Months Starts Now!

My retort to Sell in May… is “Buy in October and get your portfolio sober!”
Our Best Months Switching Strategy has been around since 1986 when Yale Hirsch first published it in the 1987 Stock Trader’s Almanac. Fast forward 38 years to 2024 and the six consecutive month span, November through April, is still the best for S&P 500 and DJIA since 1950. S&P 500 averages 7.1% and has advanced 77.0% of the time. DJIA has been even stronger, gaining 7.4%, up 78.4% of the time.


Over the years the strategy has been refined. Using the MACD (Moving Average Convergence Divergence) indicator to better time the entries and exits. DJIA’ average gain increases to 8.9% (up 85.1% of the time) while S&P 500 average increases to 8.5% (up 79.7% of the time). In some years MACD can delay the start of the Best Months, and in others like this year, the buy signal can arrive in October. We issued our Seasonal MACD Buy signal on the close on October 11, 2024.
For Almanac readers following our Best 6 + 4-Year Cycle strategy, the recent buy signal would not have mattered as they have been long since the market bottomed in mid-term year 2022. We first introduced this refinement to Yale’s original Best Months strategy to Almanac Investor members in the October 2006 issue. With only four trades in four years, since 1949, this strategy lifts DJIA average gain to 9.7% (up 86.8% of the holding periods).
All three approaches to trading the “Best Months” are covered in the 58th annual edition of the Stock Trader’s Almanac for 2025 as well as trading NASDAQ’s Best Eight Months.
4 notes
·
View notes
Text
Advanced Tips and Tricks for Global Market Trading

Trading in the global market can be both exciting and profitable if you employ the right strategies. Whether you're dealing with Forex, commodities, or other investments, these advanced tips will set you up for success.
Master Technical Analysis: Technical analysis is crucial for predicting market movements. Learn to read charts and use indicators like the Relative Strength Index (RSI) and Moving Average Convergence Divergence (MACD). These tools help you identify trends and make informed trading decisions.
Choose the Best Trading Platform: Selecting the right trading platform is essential. Look for platforms that offer real-time data, analytical tools, and a user-friendly interface. Good platforms also provide educational resources and excellent customer support.
Diversify Your Investments: Diversification reduces risk. Spread your investments across different asset classes like Forex, commodities, and stocks. This approach ensures that your portfolio is protected from market volatility.
Stay Updated with Market News: Keeping up with global news, economic events, and market trends is vital. Regularly read financial news and reports. Use economic calendars to track important events that might impact your trades.
Implement Risk Management Strategies: Effective risk management is key to long-term success. Use stop-loss orders to limit potential losses and ensure no single trade can hurt your portfolio too much. This way, you can trade with confidence.
Follow Expert Insights: Industry experts and analysts provide valuable insights. Platforms like TradingView and social media channels can offer advanced strategies and techniques. Learning from these experts can enhance your trading approach.
Use Automated Trading Systems: Automated trading systems can execute trades based on pre-set criteria, helping you take advantage of market opportunities without constant monitoring. Understand the algorithms and monitor their performance regularly.
Focus on Continuous Learning: The trading world is always changing. Participate in webinars, attend workshops, and take online courses to stay updated with the latest strategies and trends. Continuous learning helps you stay ahead.
Monitor Your Performance: Regularly review your trades and performance. Keep a trading journal to track your decisions, outcomes, and lessons learned. This practice helps you improve your strategies and avoid repeating mistakes.
Partner with Reliable Brokers: Choosing a reliable broker is crucial. Look for brokers with competitive spreads, low fees, and robust security measures. A good broker provides the tools and support you need for successful trading.
Trust APM for more expert insights and trading solutions.
5 notes
·
View notes
Text
The cryptocurrency market entered the second week of July on a bearish trajectory. Solana (SOL) has experienced notable fluctuations amid rising volatility. Analyst Jelle highlighted SOL's potential to reach $600 despite setbacks, indicating long-term bullish prospects.
In the past 24 hours, Solana moved up 2.08% with trading volume at $3,041,397,181, suggesting a bullish reversal at $141.05. The Moving Average Convergence Divergence (MACD) indicates weak pressure, while the 50-day EMA is resistance and the 200-day EMA is support, showing a tug-of-war between bullish and bearish forces.
Analyst TheoTrader is confident in a bullish turnaround for Injective (INJ). INJ is trading at $20.36, up 6.68% in 24 hours but down 11.98% over the week, with a trading volume of $122,930,406. With a market cap of $1,902,309,767, INJ shows significant market interest. SOL and INJ's performances underscore the unpredictable nature of the cryptocurrency market.
2 notes
·
View notes
Text
Fibonacci Trading: Forex Trading Strategy Explained
Fibonacci trading is a popular forex trading strategy that utilizes the Fibonacci sequence and its ratios to predict potential price movements and retracement levels. This method helps traders identify entry and exit points, making it an essential tool in forex trading. Understanding Fibonacci Sequence The Fibonacci sequence is a series of numbers where each number is the sum of the two preceding…
#CCI#DeFi#Divergence#Downtrend#Entry and Exit Points#Fibonacci Levels#Fibonacci Retracement#Forex#Forex Trading#MACD#Market Conditions#Market Volatility#Moving Average#Moving Average Convergence Divergence#Predictability#Price Action#Price Charts#Price Movement#Price Movements#Relative Strength#Risk Management#RSI#Stop-Loss#Support And Resistance#Trading Decisions#Trading Strategy#Volatility
3 notes
·
View notes
Text
Aptos price analysis indicates a strong bullish sentiment as the coin surged from $7.9 to $19.8 within a week, driven by substantial buying volume from miners and institutional investors. Since the start of 2023, Aptos has gained popularity among investors and traders, leading to increased demand and mining activity contributing to its price growth.
Currently, Aptos trades at $19.8, significantly higher than its seven-day low of $7.9, marking a remarkable price increase. The APT/USD pair has gained over 150% in the past week, with investors optimistic about its future potential. The pair aims for resistance levels at $25.5 and $30, achievable if the bullish trend continues.
Analysts suggest further price increases if Aptos' market capitalization exceeds $2 billion. Trading volume has steadily risen, currently at $1.8 billion, indicating strong institutional investor presence. Both long-term and short-term traders should monitor Aptos' price and leverage the bullish sentiment to maximize profits, while remaining cautious of potential market corrections.
Technical indicators support continued bullish performance. The Relative Strength Index (RSI) at 77.2 indicates an overbought status and an uptrend, while the Moving Average Convergence Divergence (MACD) trends positively. The MACD line above the signal line suggests more upside potential. Additionally, both the 50-day and 200-day moving averages are trending upwards, reinforcing the bullish outlook.
In summary, Aptos prices are expected to maintain their positive trajectory with strong investor interest and rising institutional activity, potentially reaching $25.5 and $30 in the near future.
3 notes
·
View notes
Text
Ethereum Classic Experiences Market Rally Amidst Growing Buzz over Ethereum ETF
Ethereum Classic (ETC) is undergoing a significant transformation in response to widespread speculation surrounding the potential launch of an Ethereum ETF. The surge in investor optimism has propelled ETC to surpass the 0.5 Fibonacci retracement level, signifying a pivotal moment in its market trajectory. This development places Ethereum Classic at a crossroads, perched on the brink of a major support-resistance flip.
Renowned crypto analyst CryptoBusy has shared insights on X, shedding light on Ethereum Classic's notable market shift. The ongoing discourse about an Ethereum ETF has infused the market with bullish sentiment, and ETC has demonstrated remarkable resilience and growth, particularly with its breakthrough above the 0.5 Fibonacci level. This breakthrough signals a robust market response to unfolding events and lays the groundwork for potential future developments.
Currently, Ethereum Classic finds itself at a crucial juncture, with its price hovering around a significant key level that serves as both support and resistance. This juncture holds paramount importance for traders and investors, serving as an indicator of a potential market reaction. Analysts are closely monitoring this level to gain insights into the cryptocurrency's future movements.
Despite the recent bullish trend, ETC is currently trading on a bearish note following a broader market dip. Over the past week, ETC has been on a downtrend since failing to sustain levels above $27. The cryptocurrency has now dropped below the $25 mark, establishing a new support at $23.40. As of the latest data, ETC is priced at $23.72, reflecting a decrease of over 3% in the past 24 hours.
0 notes
Text
"Mastering Technical Analysis: A Comprehensive Guide to Analyzing Price Charts, Indicators, and Patterns for Informed Trading"
Mastering technical analysis is a crucial skill for anyone looking to navigate the financial markets. Technical analysis involves studying historical price data and trading volumes to forecast future price movements. While it doesn’t predict future events or fundamental changes in a company, it provides valuable insights into market sentiment and potential price trends. Here’s a detailed guide…
View On WordPress
#Backtesting#bollinger bands#candlestick patterns#Chart Patterns#Continuous Learning#Discipline#Double Bottoms#Double Tops#Fibonacci Retracements#Flags and Pennants#Head and Shoulders#Moving Average Convergence Divergence (MACD)#moving averages#Price Charts#Psychology#Relative Strength Index (RSI)#Risk Management#Risk-Reward Ratio#Stop-Loss Orders#Support and Resistance#technical analysis#Timeframes#Trading Strategies#Trends#triangles
0 notes
Link
Mastering MACD Analysis Using TA-Lib
The article provides a comprehensive guide to performing MACD (Moving Average Convergence Divergence) analysis using the TA-Lib library. By explaining the default MACD formula and its components, it demonstrates how to calculate the MACD Line, Signal Line, and Histogram using stock data. The guide also shows how to customize moving average periods for different analyses, allowing traders to adapt to varying market conditions.
Moreover, the article delves into practical MACD analysis techniques. It explains how to identify trend-following opportunities by detecting Golden Cross (uptrend) and Dead Cross (downtrend) points. The text also illustrates how to analyze market trends using the size of the Histogram, offering insights into strong trends and weakening trends. The article covers overbought and oversold conditions by showcasing divergence calculation and zero line crossing strategies. Overall, this guide equips traders with the knowledge and tools to make informed investment decisions using MACD analysis.
#MACD analysis#Trend following#Golden Cross#Dead Cross#Histogram analysis#Overbought#Oversold#Divergence#Zero Line Crossing
3 notes
·
View notes
Text
Master Market Momentum with MACD
Venturing into the world of trading and investing often feels like navigating a labyrinth of indicators and strategies. For many, the Moving Average Convergence Divergence (MACD) stands out as a beacon—a tool that simplifies complexity and offers clarity. Imagine a seasoned investor, Maria, who once hesitated to dive into stock markets, overwhelmed by the noise of charts and numbers. One day, she…
0 notes