#Types of Pennant Patterns
Explore tagged Tumblr posts
Visit Tumblr Blog
Explore Tumblr blogs with no restrictions, modern design and the best experience.
Last Seen Tumblr Blogs


Fun Fact
Tumblr Inc. is funded by 13 investors.
Text
#Pennant Pattern in Technical Analysis#Bullish and Bearish Pennant Pattern#Types of Pennant Patterns#How to Trade with Pennant Chart Pattern#How to Trade Bullish Pennant Pattern
0 notes
Text
3-5 things associated with your muse.
emotions / feelings:
01. bitterness
02. fear
03. anger
greetings:
01. "hey."
02. "what's up?"
03. "how's my favorite ___?" the noun can be anything.
colors:
01. a rusty, orange red
02. blue. it brings out his eyes.
03. yellow. also, not a color, but patterns. he likes patterns.
scents:
01. hotel lotion. kind of cheap. has that off-brand, almost medicinal quality to it, or like it's sat in the medicine cabinet a couple years too long.
02. terre d'hermès (orange and grapefruit, woody, flint. typically associated with older men and can be thought of as old-fashioned or dated).
03. drugstore shampoo
clothing:
01. suit ensamble (jacket, matching pants, tie, cufflinks)
02. button-ups with (maybe) rolled-up sleeves. slacks and loose tie or tie-less.
03. pullover and shorts/jeans but pretty much only when alone
objects:
01. business card. it has 'CROKER INSURANCE AGENCY' printed on it and the name samuel croker. unless you are his "client" or someone he wants to see, the number provided on the card more often than not leads to "this number does not exist."
02. phone
03. matchbook. this also has 'CROKER INSURANCE AGENCY' on it, kind of like how old bars and gentlemen's clubs used to have their own matchbooks. the words 'match made in heaven' are written in red ballpoint ink on the inside of the flap.
vices / bad habits:
01. i don't want to say hedonistic, but it doesn't take a lot of convincing to make him do something he shouldn't if it's something he wants, regardless if it's morally gray or outright wrong. sam more or less acts on his own wants and desires - even at the cost of someone else's happiness or safety.
02. as i touched on earlier: no introspection. he does not want it; he does not do it. i think there's a degree of discomfort that comes with self-reflection, and the notion of "facing the music" or taking a good, hard look at yourself in the mirror and admitting why you are where you are, or why things happened the way they happened, would force him to see his own inadequacies and flaws. this also means he has a habit of doing the same unwanted things over and over and over again, and that he doesn't show or acknowledge the actual emotions he's keeping buried. what you see is a cultivated image and what sam wants you to see.
03. never being entirely transparent. this means lying by omission. if you ask sam, however, he does not consider this lying, and he's more likely to blame you for making assumptions.
body language:
01. lots and lots of gesticulating. he talks with his face, hands, and body to an almost absurd degree.
02. he skews and twists his mouth frequently when he's upset or is otherwise stewing in his own thoughts, though not necessarily negative.
03. this doesn't counts as body language, but he can be volatile and destructive when overwhelmed. the i-wreck-the-closest-thing-in-my-vicinity type.
aesthetics:
01. car salesman? i'm not sure if this is considered an aesthetic, but i think it conjures an image pretty much instantly. the done-up hair, the loud, bright suit, the larger-than-life, can't-shut-up, maybe obnoxious personality. there's probably the reflective pennant banners flapping in the background with big, bold advertisements.
02. bloodbo-rne. the entire world and the atmosphere is very ilhayl'ir and the spires. if you're unfamiliar with it, it's very gothic/victorian-esque, but as in shambles and ravaged by a beast "plague".
03. cityscapes. towering skyscrapers. the gray slab of a concrete jungle. very new york, always awake and bustling. sam is a man who belongs in the city.
songs (in no order):
01. "graceless" by the national (i'm trying, but i'm graceless / don't have the sunny side to face this / i am invisible and weightless / you can't imagine how i hate this / graceless)
02. "i know it's over" by the smiths (i can feel the soil falling over my head / see, the sea wants to take me / the knife wants to slit me / do you think you can help me?)
03. "sweet and tender hooligan" by the smiths (he was a sweet and tender hooligan, hooligan / he said that he'd never, never do it again / and of course he won't, oh / not until the next time)
tagged by: @miidnighters ty! tagging: @lcvnderhazed (manny), @abysswarden, @prvtocol, @bellecosebabe, @ghoulishundertakings, @escapedartgeek, @starlyht (any!)
4 notes
·
View notes
Text
How to Read Stock Charts for Beginners?

If you’re new to investing, learning how to read stock charts for beginners can feel like deciphering a foreign language. But don’t worry—it’s easier than it looks. Stock charts are powerful tools that help you understand market trends, spot opportunities, and make smarter investment decisions. Whether you're a casual trader or planning long-term investments, mastering the basics of stock charts is the first step toward building confidence and growing your portfolio.
How to Read Stock Charts for Beginners – Understanding the Basics
Stock charts visually show a stock's price over time. They allow investors to track price movements, trading volume, and patterns that can help predict future performance.
The most common types of stock charts include:
Line charts – Simple and clean, showing the closing prices over a set period.
Bar charts – Display opening, closing, high, and low prices for each time unit.
Candlestick charts – Popular among traders, offering visual cues with color-coded bars.
Key Components of a Stock Chart
1. Price and Time Axes
Stock charts usually have time on the horizontal (X) axis and price on the vertical (Y) axis. This setup shows how the stock's price changes over days, weeks, or months.
2. Volume Bars
Volume bars appear at the bottom of most charts. They show how many shares were traded during a specific period. High volume often means strong interest or big news.
3. Moving Averages
Moving averages smooth out price data over a certain period, helping you spot trends.
Simple Moving Average (SMA): The average price over a defined time (e.g., 50-day SMA).
Exponential Moving Average (EMA): Gives more weight to recent prices.
Reading Candlestick Charts
Candlestick charts are ideal for beginners who want more detail in a visual format. Each candlestick represents one period (like a day) and shows:
Open and Close: The “body” of the candle.
High and Low: The “wicks” or “shadows” above and below the body.
Color: Green means the stock closed higher than it opened; red means it closed lower.
Recognizing common candlestick patterns—like dojis, hammers, and engulfing candles—can help forecast market behavior.
Identifying Trends and Patterns
Understanding trends can help you determine when to buy or sell.
Types of Market Trends
Uptrend: A series of higher highs and higher lows.
Downtrend: A series of lower highs and lower lows.
Sideways/Flat: Little movement in either direction.
Common Chart Patterns
Head and Shoulders: Indicates potential trend reversal.
Double Top/Bottom: Suggests strong support or resistance.
Flags and Pennants: Short-term continuation patterns.
Practical Tips for Beginners
Keep It Simple
Start with line or candlestick charts and focus on one stock at a time.
Combine Charts with Research
Charts are helpful, but always consider news, earnings reports, and broader market conditions.
Use Reliable Tools
Many platforms offer beginner-friendly charting tools. For a helpful resource on getting started, check out this complete beginner’s guide on how to read stock charts.
📊 Final Thoughts + CTA
Learning how to read stock charts for beginners doesn’t have to be overwhelming. By focusing on basic chart types, understanding key components, and recognizing simple patterns, you’ll gain the confidence to analyze stocks like a pro.
1 note
·
View note
Text
Triangle Pattern in Trading | Simple Guide for Everyone

Triangle Pattern in Trading: Master the Market Moves
Trading the financial markets may seem like rocket science, but what if I told you it’s more like spotting shapes in clouds? Yes, seriously. One of the most powerful chart patterns traders rely on is the triangle pattern, and understanding it could be your edge in the market—especially the symmetrical triangle pattern.
This article breaks it all down for you in the simplest way possible—no complicated terms, no financial degree required. Plus, we’ll show how tools like the best algo trading software in India and online trading software can help make the process smoother.
Learn the symmetrical triangle pattern in trading. Discover how it works using the best algo trading software in India & top online trading software.
What is a Triangle Pattern in Trading?
Imagine squeezing a spring between your fingers. It tightens and builds up pressure. Then one day—snap! It shoots out. That’s exactly what a triangle pattern does on a stock chart. It shows a market that’s consolidating, building pressure before breaking out in one direction.
A triangle pattern forms when the price of a stock, crypto, or any tradable asset moves within converging trendlines, forming a shape that literally looks like a triangle.
Types of Triangle Patterns
There are three main types of triangle patterns, and each tells a different story:
Symmetrical Triangle – The sides converge equally. It’s a sign of uncertainty.
Ascending Triangle – Flat top, rising bottom. Often a bullish sign.
Descending Triangle – Flat bottom, falling top. Usually a bearish signal.
In this guide, we’ll focus mostly on the symmetrical triangle pattern, but it’s useful to know the others too.
What is the Symmetrical Triangle Pattern?
Think of the symmetrical triangle as a tug of war between buyers and sellers. Both sides are strong, but neither can overpower the other—yet. So the price bounces between narrowing support and resistance levels.
Here’s the key part: this pattern doesn’t tell you the direction of the breakout, but it strongly suggests a breakout is coming soon. It’s like a pressure cooker ready to explode—up or down.
Why Triangle Patterns Matter
You don’t need to predict the market perfectly to succeed—you just need to be ready for when it moves. Triangle patterns help with that.
Key Benefits:
Anticipate breakouts
Identify entry and exit points
Avoid trading during uncertain periods
Spotting these patterns can give you an edge over traders who are just guessing.
How to Spot a Symmetrical Triangle
Here’s how to identify it like a pro:
Look for lower highs and higher lows
Draw two trendlines—one sloping down from above, one sloping up from below
The lines converge toward each other like scissors
Once these lines start coming together, traders watch closely for the breakout.
Breakouts: The Big Reveal
Breakouts are when the price bursts out of the triangle formation.
Breakout Direction Tips:
Volume spike? Expect a strong move.
Break above the upper line? Likely bullish.
Break below the lower line? Likely bearish.
No pattern is 100% accurate, but triangle breakouts often lead to explosive price action.
Volume and the Triangle Pattern
Volume is like the “voice” of the market. During a symmetrical triangle formation, volume tends to drop, showing less activity. But right before a breakout, volume usually spikes, confirming that the market is about to move big.
This is where having powerful online trading software helps—these platforms can alert you to changes in volume instantly.
Triangle Patterns vs. Other Patterns
How does the triangle compare to other chart patterns?
Pattern
Key Signal
Symmetrical Triangle
Uncertainty followed by breakout
Head and Shoulders
Trend reversal
Flags & Pennants
Continuation of trend
Double Top/Bottom
Major reversal points
The symmetrical triangle pattern is one of the few that doesn’t try to predict direction—it helps you prepare for it instead.
Common Mistakes to Avoid
Even the best tools can't fix poor trading habits. Avoid these rookie mistakes:
Entering before the breakout – Wait for confirmation.
Ignoring volume – It’s your early warning system.
Misidentifying the pattern – Practice drawing trendlines correctly.
Overtrading – Not every triangle leads to a big move.
Take your time. It’s not about catching every move—it’s about catching the right one.
How Algo Trading Makes It Easier
Can software help you catch these patterns faster? Absolutely.
With the best algo trading software in India, you can automate:
Pattern recognition
Volume analysis
Trade execution on breakouts
This means no more staring at charts all day. The software does the scanning and alerts you when it’s go-time.
Top Online Trading Software in India
Here are some of the best platforms where you can trade triangle breakouts:
Quanttrix – Known for its high-speed algorithms and pattern recognition.
Zerodha Kite – Popular for its easy interface and charting tools.
Upstox Pro – Combines speed with smart analytics.
Angel One – AI-driven alerts and customizable charts.
These online trading software platforms make it easier for Indian traders to take advantage of technical patterns like triangles.
Backtesting the Triangle Pattern
Before you risk real money, test it out.
Backtesting means applying the triangle pattern to past market data to see how well it worked.
Many platforms (like Quanttrix or TradingView) allow backtesting. Use this feature to:
Learn how often triangle breakouts succeed
Understand what conditions increase success
Improve your strategy over time
Real-Life Examples of Triangle Trading
Let’s say a stock like Reliance Industries starts forming a symmetrical triangle. You draw your trendlines and notice a breakout with strong volume on the upside.
If you had set an automated trade using algo software, you could’ve caught the breakout without lifting a finger.
Triangle patterns show up across stocks, crypto, commodities—you name it. They’re universal.
Tips for Beginners
Starting out? Here are a few things to keep in mind:
Use demo accounts – Practice without risk
Stick to one pattern – Master triangles first
Set alerts on your online trading software
Keep a trading journal – Log your triangle trades
Master one pattern and let it become your bread and butter before branching out.
Conclusion: Turning Shapes into Profits
Triangle patterns aren’t just pretty shapes—they’re predictive tools used by savvy traders around the world. The symmetrical triangle pattern in particular is a reliable signal of upcoming volatility.
With the help of the best algo trading software in India and reliable online trading software, you can turn this pattern into profit—without having to watch charts 24/7.
Trading doesn't have to be overwhelming. Sometimes, all you need is the ability to recognize a triangle.
FAQs
What does a symmetrical triangle pattern indicate? It shows price consolidation and signals an upcoming breakout, though it doesn’t predict the direction.
Can beginners use triangle patterns effectively? Yes! With some practice and the right tools, even beginners can spot and trade triangle patterns.
How does algo trading help with triangle patterns? Algo trading can automatically detect triangle formations and execute trades once a breakout is confirmed.
What is the best online trading software in India for chart patterns? Quanttrix, Zerodha Kite, and Upstox Pro are popular choices that support detailed charting and pattern detection.
Should I trade every triangle pattern I see? No. Only trade confirmed breakouts, ideally supported by volume and market conditions.
0 notes
Text
Conquer the Day: A Beginner's Guide to Intraday Trading

The world of Online intraday trading is booming. Did you know that intraday trading volumes have surged by over 30% in recent years? This growth highlights how more individuals are drawn to the fast-paced nature of trading stocks within a single day. Simply put, intraday trading involves buying and selling financial instruments like stocks or commodities on the same day, aiming to take advantage of short-term price movements. This guide will help beginners grasp the essentials of intraday trading and consider stepping into this dynamic arena.
Understanding the Mechanics of Intraday Trading
Order Types
To engage in intraday trading, you need to understand different order types:
Market Orders: These are orders to buy or sell at the current market price. For example, if a stock is trading at $50, you might place a market order to buy it. This order completes instantly at that price.
Limit Orders: A limit order allows you to specify the price at which you're willing to buy or sell. If you only want to buy a stock at $48, you would set a limit order. It won’t execute until that stock reaches your desired price.
Stop-Loss Orders: This order helps minimize losses. If you own a stock at $50 and want to limit losses to 10%, you set a stop-loss order at $45. If the stock price drops to this point, your shares will automatically sell.
Trading Platforms
Choosing the right trading platform is vital. Some popular options include:
Robinhood: Known for its user-friendly interface. Great for beginners and offers commission-free trading.
TD Ameritrade: Offers advanced tools and excellent research resources, which can be beneficial for rookies.
E*TRADE: Provides a robust mobile app along with a web platform that’s easy to navigate.
(Screenshots would enhance understanding but are not included here.)
Leverage and Margin
Leverage allows traders to control larger amounts of money with a smaller investment. It means you borrow money from your broker to increase your buying power, potentially amplifying profits. However, this comes with risks. A statistic shows that around 70% of intraday traders use leverage. If the market moves against you, losses can exceed your initial investment.
Key Indicators and Chart Patterns for Intraday Traders
Technical Analysis Basics
Understanding technical analysis can boost your trading success. Here are a few key concepts:
Support and Resistance Levels: Support is where a stock tends to stop falling and bounce back up, while resistance is where it often stops rising. These levels can inform your buy or sell decisions.
Moving Averages: This tool smooths price data over a specific period, making trends clearer. For instance, a 50-day moving average might help identify whether a stock is in an uptrend or downtrend.
Relative Strength Index (RSI): A momentum oscillator that indicates whether a stock is overbought (above 70) or oversold (below 30).
Chart Patterns
Recognizing chart patterns can provide valuable insights:
Head and Shoulders: This pattern indicates a trend reversal. The “head” is a peak between two smaller “shoulders.”
Double Tops/Bottoms: A double top signals a potential price decline, while a double bottom suggests a price increase.
Flags/Pennants: These patterns represent brief price consolidations before a continuation of the trend.
Interpreting Market Sentiment
Market sentiment can sway price movements significantly. To gauge sentiment, traders often review news articles, social media, and reports from reliable financial news sources like CNBC or Bloomberg.
Risk Management Strategies in Intraday Trading
Position Sizing
Position sizing helps manage risk effectively. For instance, if you have a $1,000 account and are willing to risk 2% per trade, you would only risk $20. Therefore, if you buy a stock at $50, you should only purchase 0.4 shares to limit your risk.
Stop-Loss Orders
Setting stop-loss orders is vital for protecting your capital. For example, if a trader buys shares at $100 but sets a stop-loss at $95, they limit potential loss to 5%.
Emotional Discipline
Emotional control is crucial. Many traders face challenges with impulsive decisions. Trading expert Van Tharp states, “Your trading plan has to be solid, but your mind must also be calm to execute it.”
Choosing the Right Assets for Intraday Trading
Stocks vs. Futures vs. Forex
Each asset class has unique features.
Stocks are popular for intraday trading due to their volatility.
Futures offer high leverage but can be risky for beginners.
Forex trading provides high liquidity with low capital needed to start.
Liquidity and Volatility
Liquid assets have high trading volumes, making it easier to enter and exit trades. Volatile assets experience frequent price changes, providing more opportunities. Some highly liquid stocks include Apple, Amazon, and Tesla.
Diversification
Diversifying your portfolio helps mitigate risk. Trading across sectors or asset classes reduces the impact of a poor-performing asset.
Developing an Intraday Trading Plan
Defining Trading Goals
Setting clear and realistic trading goals is crucial. Goals could include achieving a specific profit amount each month or steadily growing your trading account.
Backtesting Strategies
Before entering live trades, backtesting strategies can show how they would have performed in the past. This helps in understanding potential profitability. Websites like TradingView offer backtesting features.
Journaling Trades
Tracking trades improves decision-making. Recording details, like entry and exit points, helps identify what works and what doesn’t. Over time, this practice can enhance your trading effectiveness.
Conclusion: Mastering the Art of Intraday Trading
Understanding intraday trading involves grasping various key components: order types, charts, and effective risk management. Prioritizing risk management and adopting a continuous learning mindset will enhance trading skills. With determination and the right resources, you can navigate the exciting world of intraday trading successfully. Start small, stay informed, and let your journey unfold.
#intaday tading#intraday trading in India#Intraday trading Platform#stock trading platform in india#forex trading in india
0 notes
Text
Indian Stock Market Trading | Investing: Technical Analysis
Technical analysis is a popular approach in the Indian stock market for both trading and investing. By using patterns, trends, and other market data, technical analysis aims to forecast stock price movements and identify profitable opportunities. Here’s a comprehensive look at how technical analysis works and how it can be applied to the Indian stock market.
1. What is Technical Analysis?
Technical analysis is the study of past market data, primarily price and volume, to predict future price movements. Unlike fundamental analysis, which looks at a company's financial health and growth potential, technical analysis focuses on stock price movements and investor sentiment.
Key Components of Technical Analysis
Price: The most important element in technical analysis. Every stock’s price reflects all available information.
Volume: Shows the level of trading activity and can confirm price trends.
Timeframe: Different trends appear over short, medium, or long periods, affecting decisions for day traders, swing traders, and long-term investors.
2. Basic Principles of Technical Analysis
Technical analysis is based on a few core principles:
Market Discounts Everything: All information is already priced into the stock.
Price Moves in Trends: Prices often move in recognizable trends rather than random patterns.
History Tends to Repeat Itself: Market behavior repeats over time, often due to investor psychology.
3. Tools and Indicators in Technical Analysis
Simple Moving Average (SMA): The average price over a specific period, like 50-day or 200-day, to identify trends.
Exponential Moving Average (EMA): Gives more weight to recent prices, making it sensitive to new information.
Relative Strength Index (RSI)
A momentum indicator that ranges from 0 to 100, indicating overbought (above 70) or oversold (below 30) conditions.
Bollinger Bands
Consist of a moving average with two bands that adjust to volatility, useful for identifying overbought and oversold conditions.
MACD (Moving Average Convergence Divergence)
Combines moving averages to show momentum, often used to spot trend changes.
Support and Resistance Levels
Price levels where a stock historically stops rising or falling, signaling potential entry or exit points.
4. Chart Patterns in Technical Analysis
Indian traders often rely on chart patterns that help predict future price movements.
Head and Shoulders
A reversal pattern that suggests the end of an uptrend.
Double Top and Double Bottom
These patterns indicate potential reversals, with double tops suggesting a bearish reversal and double bottoms signaling a bullish reversal.
Triangles (Ascending, Descending, and Symmetrical)
These patterns indicate periods of consolidation, where the stock is likely to break out in the direction of the broader trend.
Flags and Pennants
Short-term continuation patterns that signal brief pauses in ongoing trends, often indicating that the price will resume its previous direction.
5. Types of Trends in Technical Analysis
Trends are categorized based on the timeframe, providing different insights for traders and investors.
Uptrend
Characterized by higher highs and higher lows, indicating a bullish market.
Downtrend
Marked by lower highs and lower lows, indicating a bearish market.
Sideways/Horizontal Trend
Occurs when prices move within a narrow range, signaling indecision among investors.
6. Timeframes in Technical Analysis
Choosing a timeframe is essential, as it impacts the analysis and strategy.
Intraday: For traders looking to profit from daily price fluctuations.
Swing Trading: Involves holding stocks for days or weeks to capture short- to medium-term trends.
Long-Term: Investors hold positions for months or years, focusing on longer-term trends.
7. Using Technical Analysis for Trading
Traders can use technical analysis to make quick buy or sell decisions based on signals and patterns.
Identifying Entry and Exit Points
Use indicators like RSI, MACD, and support/resistance levels to determine optimal buy and sell points.
Risk Management
Incorporate stop-loss orders to limit losses and protect profits, especially in volatile stocks.
Backtesting
Testing strategies on historical data to gauge effectiveness before applying them in live trading.
8. Using Technical Analysis for Investing
For long-term investors, technical analysis can help optimize the timing of buying or selling, even if they rely more heavily on fundamentals.
Using Moving Averages for Timing
Long-term investors can use moving averages to confirm uptrends before making investments or to decide when to exit.
Support Levels as Buying Opportunities
In bull markets, support levels offer a chance to buy stocks at a relative discount.
Avoiding Overbought Conditions
Long-term investors may avoid stocks with high RSI values (over 70), as they may be due for a correction.
9. Limitations of Technical Analysis
Technical analysis, while powerful, does have its limitations:
Does Not Consider Fundamentals: It ignores a company’s financial health.
Subjective Interpretation: Patterns and indicators can be interpreted differently.
Prone to False Signals: Indicators can sometimes give incorrect buy or sell signals, especially during volatile markets.
10. Practical Tips for Using Technical Analysis in the Indian Market
Focus on High-Volume Stocks: High-volume stocks offer clearer technical signals and less price manipulation.
Combine with Fundamentals: For investment, combine technical analysis with fundamental analysis to make well-rounded decisions.
Stay Updated with News: The Indian stock market can react to political, economic, and regulatory news, impacting technical patterns.
Practice Patience: Technical analysis requires patience and consistency to understand market trends and patterns.
Conclusion
Technical analysis can be a valuable tool for both traders and investors in the Indian stock market. By learning to read indicators, identify patterns, and understand trends, you can make more informed decisions. Whether you're trading daily or investing for the long term, technical analysis provides actionable insights to help navigate the dynamic and often unpredictable nature of the stock market.
0 notes
Text
Using Trading Patterns in Forex Trading

Knowing and using different types of patterns is the basis for successful trading, as every market situation requires choosing the most optimal and, consequently, profitable course of action. Therefore, it is worth taking a closer look at different Forex trade patterns. Understanding Trading Patterns It is the result of studying historical data on the behavior of financial markets over decades. This makes it possible to identify repeated formations, which form chart patterns. With a high probability, they are the ones that predict future price changes, which is why, along with a Forex expert advisor, they are among the main tools for a trader. It is important to understand that chart patterns are divided into two main categories: Reversal Continuation Each of them includes different types of charts that characterize the market and provide information about further trend changes, which is especially important for successful trading. Common Reversal Patterns These patterns in Forex trading indicate trend reversals. It can be a change of direction from a falling market to a rising one or vice versa. They usually take the form of head and shoulders, as well as double or triple tops and bottoms. Reversal patterns indicate a fairly high potential risk-reward ratio. The following chart patterns in Forex are the most popular among traders. Head and Shoulders. This chart has three price peaks. The one in the middle is higher, and the two on the sides are at about the same level. A double-top pattern. It usually occurs after an uptrend. The chart has two peaks at almost identical heights. This pattern indicates that buyers are running out of steam. The last bottom between the two peaks is called the trigger line. Double bottom. This chart is the exact opposite of the previous one. It is helpful to use it after a significant price drop. The Quasimodo pattern. It is one of the most reliable patterns for determining the reversal strength. This pattern can be especially useful after a significant downtrend or uptrend. Candlestick pattern. The chart resembles a candle, which is why it has such a name. If this pattern appears after a significant downtrend, it may indicate that new opportunities for price growth may appear soon. Continuation Patterns Typically, continuation patterns include descending and ascending triangles, rectangles, pennants, and bull and bear flags. This indicates that after a period of consolidation, the prevailing trend will continue. Elongation patterns usually appear in the middle of a trend. In general, they are a pause in price action and can have different durations. Therefore, it is worth paying special attention to different models of continuation patterns. Triangle. This chart shows the convergence of a price range with higher lows and lower highs. There is a descending, ascending, and heptagonal triangle. Pennants. This pattern is similar to the previous one but smaller because it is created by only a few bars. The chart appears when prices are converging and cover a small price range of the average trend. Flags. Flags indicate a pause in the trend that occurs when the price is limited to a small range. This pattern usually does not last long. Rectangles. This chart indicates a pause in the trend. Price action moves between parallel support and resistance lines. Japanese Candlestick Patterns Such charts are also called spinning tops. They indicate a certain confrontation between buyers and sellers. Prices can go up and down quite sharply, but as a result, no dramatic changes occur. If a spinning top is formed during an uptrend, you should expect its direction to reverse, as there are few buyers left. If a rotating top is formed during a downtrend, it also indicates a trend reversal, but the reason is a small number of sellers. Also, special attention should be paid to the Marubozu model. There are Black and White versions of this chart. An extension is likely when the White Marubozu is formed at the end of an uptrend. If this chart is created at the end of a downtrend, a reversal is likely. The situation is the opposite with the Black Marubozu. Another variant of the Japanese candlestick pattern is the Doji. They indicate the same opening and closing price, which is caused by the struggle or indecision between buyers and sellers. Trading Strategies Based on Patterns Recognizing different trading patterns is a particularly important skill for investors. It involves identifying patterns in the behavior of assets on the market, which makes it possible to create more accurate forecasts of market trends and, accordingly, choose the best strategies. Among them, the most popular are the following: Moving average strategy; 50 pips per day; Breakout/breakdown strategy; Trading by graphic patterns; Trend following strategy; Scalping. Summary Trading models provide valuable information about the dynamics of supply and demand, as well as market psychology. With this information, an analyst can assess possible future trend changes and choose the most successful trading strategies based on it, maximizing the profit. Read the full article
0 notes
Text

Columbus Day Cross Stitch Pattern | Happy Columbus Day
⛵ Specification of this cross stitch pattern for different types of fabric ✔ Colors: 12. ✔ Palette: DMC. ✔ Size: 100×100 stitches.
⛵ Finished size will vary depending on the count fabric/canvas you choose. ✔ 14 count ⇒ Size: 7.14×7.14 inches | 18.14×18.14 cm ✔ 16 count ⇒ Size: 6.25×6.25 inches | 15.88×15.88 cm ✔ 18 count ⇒ Size: 5.56×5.56 inches | 14.12×14.12 cm
⛵ Celebrate Columbus Day with my “Columbus Day Cross Stitch Pattern | Happy Columbus Day.” This delightful free pattern captures the spirit of exploration with a nostalgic, minimalist folk art design. Featuring a ship adorned with colorful pennants and cresting waves, the scene is complete with the words “Columbus Day,” evoking a sense of adventure and discovery. With a stitch size of 100×100, this pattern translates to 6.25×6.25 inches on 16-count fabric, making it a perfect project for both beginners and seasoned stitchers. The pattern uses a vibrant palette of 12 DMC colors, ensuring a visually stunning and engaging final piece. Whether you’re looking to create a commemorative decoration or a thoughtful gift, this cross stitch pattern offers a fulfilling and enjoyable stitching experience. Download this free pattern today and immerse yourself in the art of cross stitching while honoring the legacy of Christopher Columbus. Happy stitching!
⚓️ Source: Columbus Day Cross Stitch Pattern | Happy Columbus Day
#cross stitch pattern#cross stitch#xstitch#holiday cross stitch#embroidery#columbus day#free pattern
0 notes
Text
BOTT Price Action Guide: Binary Options Turbo Trading, Forex, FX Options, Digital Options BOTT Price Action Guide: Binary Options Turbo Trading, Forex, FX Options, Digital OptionsThe ultimative Price Action guide (7 edition) for any kind of financial instrument (Binary Options, Forex, FX Options, Digital Options) any kind of time frame from 1 min over 5 min up to 15 min, 30 min and above and any kind of broker. This ebook is all you need, especially as a binary option turbo trader or Forex day trader to get profit out of the market, to get out of debt, make yourself a living or help your friends and family and to archieve financial freedom. Don't miss the opportunity to get this ultimative Price Action guide (7 edition)File Size: 12597 KBPrint Length: 118 pagesPublisher: BO Turbo Trader; 7 edition (October 24, 2018)Publication Date: October 24, 2018Content:Mindset for consistent profits- Practice- Win Rate- Discipline- Money Management- Emotions Candlestick Patterns- Hammer, Inverted Hammer, Takuri Line, Shooting Star and Hanging man- Dragonfly Doji, Gravestone Doji- spinning top - long-legged doji, high wave and rickshaw man- Pinbar - Pin Bar - Pinocchio bar or Kangaroo Tail - Tweezer Top and Tweezer Bottom- bearish harami, bullish harami and bullish harami cross and bearish harami cross- three inside down, three inside up- descending hawk and homing pigeon- bearish meeting line - counterattack line and bullish meeting line- bearish belt hold - black opening shaven head - black opening marubozu- bullish belt hold - white opening shaven bottom - white opening marubozu- bearish kicker signal - bullish kicker signal- matching high and matching low- bearish stick sandwich and bullish stick sandwich - bearish breakaway and bullish breakaway- ladder top and ladder bottom - tower top and tower bottom- three stars in the north and three stars in the south- bearish sash pattern and bullish sash pattern- engulfing candlestick pattern or the big shadow pattern- (bearish) dark cloud cover and (bullish) piercing line- Breakaway gap, exhaustion gab, continuation gap and common gaps- rising window and falling window- marubozu and big belt- inside bar and mother bar- evening star, morning star and evening doji star and morning doji star- three white soldiers and three black crowsChart Patterns- Double Top - M Formation - Mammies and Double Bottom - W Formation - Wollahs- J-Hook pattern and inverted J-Hook candlestick pattern- bearish last kiss - bearish pullback and bullish last kiss and bullish breakout- Head and Shoulders and inverted Head and Shoulders Pattern- Trend Channel - uptrend and downtrend- symmetrical triangle- ascending triangle and descending triangle- bullish flag and bearish flag - bullish pennant and bearish pennant - rising wedge and falling wedge- Broadening Bottoms and Broadening Tops- Rectangle Bottoms and Rectangle TopsConcepts- Candlestick Mathematics- Rejection - market move - weak snr and strong snr- trending and ranging market- minor and major trend- adapting forex strategies to binary options turbo trading- proper rejection - invalid rejection- false breakouts - channel breakouts- reversal and retracements- highest probability trading setups- high probability techniques- market pressures and types of market pressures- upper shadow and lower wick or tail- advanced candlestick charting techniques- overbought and oversold - oscilator - RSI CCI Stochastic Oscilator- different market conditions and market conditions examples- cycle of market emotions, psychology and dynamics- trading setups without rejections as confirmation - multiple time frame trading concept, system, methology and strategy- candlestick momenting- direction of candlestick momentum- inside swing and outside swing- support and resistance - minor snr and major snr and much more concepts ... Also by the same author: BOTT Mentorship Self-Study Video Pack 1-4 BOTT Price Action Indicator BOTT Price Action Bible by BO Turbo Trader
0 notes
Text
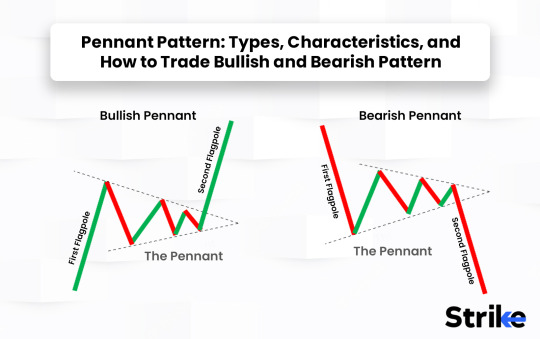
📌 Complete Guide to Pennant Pattern: How to Spot, Trade & Win With It
The Pennant Pattern is one of the most reliable continuation patterns used in technical analysis. Whether you're into stock trading, forex, or cryptocurrencies, mastering the pennant can help you catch explosive breakouts with confidence.
Let’s break down what makes the pennant pattern powerful, how to trade it smartly, and why Indian traders should care.

🔍 What Is a Pennant Pattern and Why It Matters in Trading
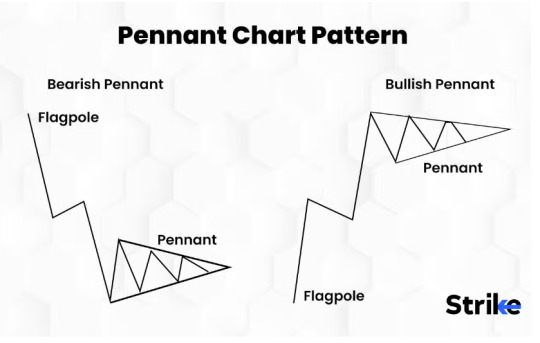
A pennant pattern forms after a strong price movement, followed by a period of consolidation, and then a breakout in the same direction. It looks like a tiny symmetrical triangle but has a distinctive flagpole and shorter duration.
This pattern suggests the market is pausing before continuing its prior trend.
Real-life Market Psychology Behind It:
Buyers/sellers take a breather after a strong move.
Short-term indecision tightens the price range.
A breakout signals that the dominant side is back in control.
🚩 Bullish vs Bearish Pennants: Learn to Recognize the Two Key Setups
Both types of pennants look visually similar—but context is everything.
Bullish Pennant: Forms after an upward price spike. Consolidation follows, then a breakout upward.
Bearish Pennant: Forms after a steep price drop. Consolidation narrows, then the price breaks down further.
Example from Indian stock market: On Tata Motors (NSE: TATAMOTORS), a bullish pennant formed in August 2023 after a 12% rally. The breakout continued the uptrend, adding another 8% in just a few sessions.
🧠 How to Identify a Pennant Pattern Like a Smart Trader

You don’t need to be a CMT to identify a pennant. Just follow these key features:
Flagpole – A sharp move on high volume
Converging trendlines – Short consolidation forming a tiny triangle
Volume drops – Price quiets down before a breakout
Breakout in same direction – Confirmed with increasing volume
🔥 Pro Tip: Use Strike Money, a smart charting tool, to draw trendlines, analyze volume, and set alerts for breakouts.
📈 Real Chart Examples from Indian Stocks That Show Pennant Patterns in Action
Let’s look at real-time charts to spot this pattern:
Infosys (NSE: INFY) – In June 2023, formed a bearish pennant post-earnings. Price dropped further by 5% after breakdown.
Adani Enterprises (NSE: ADANIENT) – In March 2023, a bullish pennant on the daily chart led to a 10% rally within a week.
Nifty Bank Index – During October 2022, showed a clear bullish pennant during the Diwali rally.
You can use Strike Money to access these patterns, zoom in on lower timeframes, and validate the structure.
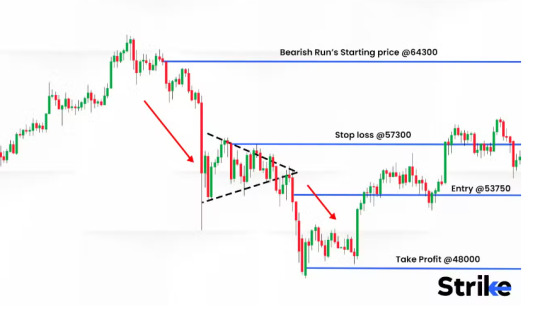
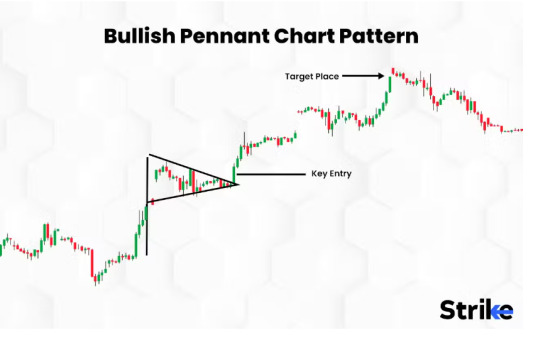
🛠️ Proven Trading Strategy for Pennant Pattern That Actually Works
Here’s a simple, effective strategy that both new and experienced traders can use:
Wait for the flagpole
Draw converging trendlines using Strike Money
Look for volume drop during consolidation
Enter on breakout with volume confirmation
Set stop-loss just below the lower trendline (bullish) or above the upper trendline (bearish)
Target = height of the flagpole added from breakout point
💡 Risk-to-reward ratio: Stick to at least 1:2.
🧪 Confirming Pennant Breakouts with Indicators (Don’t Skip This Step)
To avoid false breakouts, use technical indicators alongside the pattern.
Volume: Low during consolidation, high on breakout
RSI: Should support momentum direction (above 50 for bullish)
MACD: Bullish crossover for upward breakouts
Moving Averages: Breakout above 20-EMA adds strength
🔍 Bonus: On HDFC Bank (NSE: HDFCBANK), a bullish pennant with rising MACD in December 2023 predicted a strong move.
You can apply all these indicators visually on Strike Money charts—no code needed.
⚠️ Common Mistakes When Trading Pennants (Avoid These)
Even experienced traders mess up with pennants. Watch out for these:
❌ Entering before the breakout
❌ Ignoring volume confirmation
❌ Misidentifying a triangle as a pennant
❌ Trading during sideways markets
❌ Overtrading tiny timeframes with noise
Stay patient. A true pennant breakout often gives a clean signal.
🔍 Pennant vs Flag vs Triangle: Here's How to Not Get Confused
Many traders mix up chart patterns. Here's how a pennant stands out:
Pennant: Short symmetrical triangle after a steep move
Flag: Parallel channel, sloping against the trend
Triangle: Longer consolidation, not necessarily a continuation
If you ever feel stuck, fire up Strike Money, compare live patterns, and you'll see the difference clearly.
📊 What Research and Backtesting Say About Pennant Patterns
According to Thomas Bulkowski’s research in Encyclopedia of Chart Patterns, pennants have a success rate of 54–63%, depending on the market condition and timeframe.
Key takeaways:
Breakouts on higher volume perform better
Bullish pennants slightly outperform bearish ones
Shorter consolidation periods tend to produce faster moves
In Indian context, backtests on Nifty 50 stocks from 2021–2024 show:
Average gain after breakout: 6.8% within 5 trading days
Highest probability sectors: Banking, Auto, Energy
💬 FAQs About Pennant Patterns (Real Questions from Traders)
Q1. How long should a pennant pattern last? Usually 1 to 3 weeks on daily charts. On intraday, 15–30 minutes.
Q2. Can pennants fail? Yes. Look out for false breakouts or breakouts without volume.
Q3. Is the pennant pattern reliable in crypto or forex? Yes, especially on high-volume assets like BTC/USDT or USD/INR.
Q4. Is this pattern beginner-friendly? Definitely. With tools like Strike Money, even first-time traders can spot it.
🔮 Is the Pennant Pattern Still Relevant in 2025’s Market?
With AI tools, algorithmic trading, and fast-moving markets, some traders think classic patterns are outdated.
But patterns like pennants, when combined with data, volume, and confirmation indicators, are still incredibly effective.
Especially in volatile environments like 2024–2025’s post-recession recovery, pennants offer structure and confidence.
🧭 Final Thoughts: Should You Trade the Pennant Pattern?
✅ Yes, but trade it smartly. Don’t blindly enter every breakout—use confirmation. Combine pennant patterns with support/resistance, indicators, and a proper risk-reward system.
🧰 Tools like Strike Money let you chart, backtest, and simulate real trading setups with ease—giving you the edge over random pattern hunters.
If you’ve ever missed a big move because you weren’t sure whether a pattern was legit—the pennant pattern might be your new favorite tool.
Want help spotting pennants in real-time? Try Strike Money today.
1 note
·
View note
Text
How to Become a Great Trader: Mastering the Art of Trading

Introduction
Although it can be a thrilling and profitable endeavour, trading in the financial markets also calls for knowledge, discipline, and skill. We will examine the fundamental ideas and methods that can make you a profitable trader in this extensive tutorial. Gaining long-term success in the financial markets requires learning the art of trading, regardless of the expertise level of the investor.
Understanding the Basics of Trading
What is Trading?
Buying and selling financial instruments including stocks, bonds, currencies, and commodities with the intention of making money off of price changes is known as trading.
Types of Trading
Buying and selling assets during the same trading day in order to profit from momentary price changes is known as day trading.
Swing trading is the practice of holding positions for a few days or weeks in order to profit from medium-term market trends.
Long-term investing is the practice of holding investments for a considerable amount of time—often years—with the goal of generating large returns over time.
Developing a Trading Plan
Setting Clear Goals
Establish your trading time horizon, risk tolerance, and financial objectives. Set reasonable expectations regarding profits and losses.
Creating a Strategy
Select a trading approach that fits your personality and ambitions. Technical analysis, fundamental analysis, or a mix of the two may be used in this.
Risk Management
To guard against losses, use risk management strategies include portfolio diversification, stop-loss orders, and position sizing.
To Becoming A Great Trader JOIN NOW

Mastering Technical Analysis
Understanding Price Charts
To find possible trade chances, become knowledgeable about the interpretation of candlestick patterns, trendlines, support and resistance levels, and other technical indicators.
Using Technical Indicators
To analyse price trends and momentum, familiarise yourself with widely used technical indicators such as stochastic oscillators, moving averages, and the relative strength index (RSI).
Chart Patterns
To predict future price changes, identify typical chart patterns like head and shoulders, double tops and bottoms, and flags and pennants..
Utilising Fundamental Analysis
Economic Indicators
Keep yourself updated on important economic indicators that might affect asset values and market mood, such as GDP growth, inflation rates, interest rates, and employment data.
Company Analysis
Prior to considering an investment, consider each company's competitive position, growth potential, management team, and financial standing.
Market Sentiment
To determine market trends and mood shifts, track sentiment in the market using investor sentiment indicators, social media, and news.
Developing Discipline and Patience
Stick to Your Plan
Stick to your trading plan religiously and refrain from acting on impulse in response to transient market swings or feelings.
Manage Your Emotions
By keeping a logical attitude and concentrating on the long-term goals of your trading strategy, you may control your emotions of fear and greed.
Continuous Learning
With books, courses, webinars, and trading networks, stay current on market trends, trading strategies, and industry advancements.
To Becoming A Great Trader JOIN NOW

Practising Risk Management
Capital Preservation
Avoid overleveraging and only risk a small portion of your portfolio on each trade to protect your trading money.
Stop-Loss Orders
Stop-loss orders are a useful tool for controlling possible losses and quitting losing trades before they cause large losses.
Diversification
To minimise risk and optimise profits, diversify your investing portfolio among several industries, geographical areas, and asset types.
Conclusion
Great traders are made by commitment, self-control, and lifelong learning. You may improve your chances of making money in the financial markets by learning the principles of trading, creating a strong trading strategy, and managing risk. As you set out on your path to become a profitable trader, never forget to use patience, discipline, and focus on your long-term objectives.
#rogue trader#stock market#crypto#cryptoexchange#cryptocurrency#investing stocks#day trading#trading strategies#trading market#stock exchange
1 note
·
View note
Text
Linox: Pioneering Excellence in Digital Printing and Branding Solutions
Within the ever-evolving field of brand promotion, Linox stands out as a pioneer of innovation, dating back to 1999 when it was first established. As the best option for digital printing in Dubai, Linox has cemented its position as a major player in the GCC, known for providing creative solutions for the advertising sector. Together, we will explore the realm of digital printing and the tactical use of Flags in Dubai, offering you an understanding of how Linox's extensive experience can significantly improve and enhance your brand's visibility.
Digital Printing Unveiled
Digital printing differs from traditional offset printing in that it does not require printing plates; instead, toner or liquid ink is applied directly onto a variety of media substrates. Digital printing, with its Inkjet and Laser types, provides same-day solutions, rapid turnaround times, and unmatched benefits for small-run jobs. With its digital presses, Linox can produce crisp images with consistent colour coverage, making it a dependable option for companies looking for both quality and efficiency.
Benefits of Digital Printing
The difference between digital presses and traditional offset printing has decreased recently. Linox provides excellent colour accuracy, repeatability, accuracy, high-quality results, and cost-effective Digital Printing services in Dubai. Print-on-demand capabilities and simple customization make Linox an excellent choice for keeping your company up to date with consumer preferences and emerging trends.
Loyalty through Digital Printing
Beyond just creating materials, digital printing encourages employee and customer loyalty. Linox's dedication to providing high-quality solutions with quick turnaround times improves customer satisfaction. Businesses can effectively communicate with stakeholders and foster trust and loyalty by adopting the newest technologies.
Linox's Role in Brand Promotion
With its cutting-edge facility, Linox—the best digital printing company in Dubai—transforms the printing sector. Linox serves as a one-stop shop for a variety of branding requirements by providing wide-format vinyl printing, flex printing, textile printing, and sticker printing. The company's dedication to affordability and quality guarantees a strong brand image that appeals to the intended market.
Increasing Sales with Digital Printing
Linox is aware of how dynamic the commercial world is. Businesses can react swiftly to market trends with their digital printing services, whether for branding, events, or exhibitions. Digital printing's efficiency and speed boost sales and provide businesses with a competitive advantage.
Flags in Dubai: A Strategic Branding Technique
In the dynamic metropolis of Dubai, flags show up as a potent choice for advertising brands. Feather, teardrop, advertising, and pennant flags are among the various types of flags that Linox offers. Customised with distinctive patterns and messaging, these flags draw attention right away, which is why companies with limited space or funds prefer to use them.
The Importance of Flags in Branding
Flags are adaptable branding instruments that effectively promote goods and services through their striking visual impact. Linox's superior flags, renowned for their exquisite patterns, brand logos, catchphrases, and images, turn into an essential component of any advertising campaign.
Linox's Guidance in Flag Utilization
As you navigate the world of branding flags, Linox turns into a valuable strategic partner. The business helps you through the steps involved in raising brand awareness and visibility. Linox makes sure your brand stands out, whether it's with feather flags that billow in the breeze or teardrop flags that make a statement.
Why Linox for Flags in Dubai
Leading manufacturer of advertising flags in Dubai, Linox has skilled employees and an internal production facility. The company introduces cutting-edge solutions for branding, events, and exhibitions, defying conventional branding strategies. Linox offers a complete branding solution, ranging from flags to inflatables, corporate gifts, crystal trophies, and much more.
Contact Details
For unparalleled digital printing and flags in Dubai, contact Linox at +971-6-544 2264 or via email at [email protected].
Linox – Crafting Distinctive Brands, Forging Lasting Impressions. Elevate your brand presence with Linox, where innovation meets tradition.

1 note
·
View note
Text
forex chart patterns: A Guide to Effortlessly Identifying
forex chart patterns Introduction:

Undoubtedly,forex chart patterns the foreign exchange market or the forex market is the world's largest financial market, boasting an impressive daily trading volume of nearly $6.6 trillion. Subsequently, traders seeking success in this continually evolving environment must effectively grasp the significance of various chart patterns that can help predict market movements. Consequently, in this informative post, we introduce several pivotal forex chart patterns and delve into how they can be applied to make informed trading decisions.
Double Top and Double Bottom

Initially, the double top pattern emerges when a currency's price encounters resistance twice and fails to surpass it. This prevalent pattern typically signals a trend reversal, prompting astute traders to sell. Conversely, the double bottom pattern forms at a well-established support level, suggesting that an upward trend reversal may be looming. patterns
Head and Shoulders

Following an uptrend, a bearish reversal pattern known as the head and shoulders pattern often materializes. This phenomenon is characterized by a central peak (the "head"), flanked by two lower peaks (the "shoulders"). In essence, this pattern reveals that the market is losing momentum and may soon change direction.
Triangles forex chart patterns

Surprisingly, there are three types of triangle patterns: ascending, descending, and symmetrical. Ascending triangles feature a horizontal resistance line and an upward trendline, while descending triangles exhibit a horizontal support line and a downward trendline. On the other hand, symmetrical triangles showcase two converging trendlines and may break out in either an upward or downward direction. Crucially, triangle patterns frequently depict market consolidation before continuation or reversal patterns.
Flags and Pennants

Both flag and pennant patterns are continuation patterns that often appear after a significant price movement, aptly dubbed the "flagpole."
Wedges

Lastly, wedges emerge when two trendlines effectively converge at an angle. When a breakout occurs in the opposite direction of the wedge, this insightful pattern signifies a trend reversal. patterns
forex chart patterns Conclusion:

In conclusion, patterns serve as indispensable tools for traders seeking to amplify their profitability. By accurately identifying and interpreting these patterns, traders can make well-informed decisions, enhancing their chances of success in the fiercely competitive forex market. Investopedia's Forex Chart Patterns Guide "Gain deeper insights and data on market analysis." "Third Party Risk Management: A Comprehensive Guide Businesses"

Read the full article
0 notes
Text
Learn Technical Analysis in Hindi: The Best Course in Bangalore
Are you an aspiring trader or investor seeking to decode the intricate world of financial markets? Look no further than the comprehensive Technical Analysis Course offered in Hindi, right here in Bangalore. Delve into the world of price patterns, market trends, and chart analysis, all while grasping the concepts in your native language.
Unlocking the Power of Technical Analysis
In the realm of financial markets, decisions are often driven by data, patterns, and trends. Technical analysis is a powerful tool that helps traders and investors make informed choices by studying historical price movements and chart patterns. Whether you're a novice looking to establish a strong foundation or an experienced trader seeking to refine your skills, a technical analysis course can significantly enhance your market insights.
Why Choose a Technical Analysis Course in Hindi
Learning complex financial concepts can be a daunting task, especially when presented in a language you aren't completely comfortable with. The Technical Analysis Course Hindi in Bangalore eliminates this barrier, allowing you to grasp intricate theories and strategies without any language-related hurdles. This course caters to local participants in Bangalore who are more comfortable learning in Hindi, fostering a deeper understanding of the subject matter.
Unveiling the Course
The Technical Analysis Course in Hindi is thoughtfully designed to accommodate various levels of expertise. Whether you're a beginner or have some prior knowledge of technical analysis, the course structure ensures that you progressively build your skills. Here's a glimpse of what the course offers:
Introduction to Technical Analysis: Familiarize yourself with the fundamental concepts and terminologies of technical analysis.
Price Patterns: Learn to identify and interpret various price patterns, such as head and shoulders, flags, and pennants.
Chart Types and Trends: Understand different chart types (line, bar, candlestick) and how to recognize trends in the market.
Indicators and Oscillators: Explore the world of technical indicators like moving averages, RSI, MACD, and how to use them effectively.
Support and Resistance: Master the art of identifying support and resistance levels to make well-timed trading decisions.
Risk Management: Discover the importance of risk management and how it ties into technical analysis strategies.
Experiential Learning
What sets this course apart is its experiential approach. The curriculum is enriched with real-world examples, case studies, and hands-on exercises. Engage in live chart analysis, mock trading scenarios, and interactive discussions that reinforce your understanding of technical analysis principles.
Expert Faculty and Networking
Our faculty consists of seasoned financial experts and traders who bring a wealth of practical knowledge to the classroom. Not only will you benefit from their expertise, but you'll also have the chance to connect with fellow participants, creating a supportive network for ongoing learning and idea exchange.
If you're looking to break into the dynamic world of trading and investing armed with the insights of technical analysis, this course is your gateway. Unlock the power of understanding market trends, chart patterns, and price movements – all while learning in the comfort of Hindi. Join us in Bangalore for an immersive journey into the realm of technical analysis, and elevate your trading strategies to new heights. Your financial success story begins here.
0 notes
Text
Trading Chart Patterns PDF Guide & Algo Tools
Mastering Market Moves: The Ultimate Guide to Trading Chart Patterns Book PDF
Introduction
Have you ever looked at a stock chart and thought, “What am I even looking at?” You’re not alone! Deciphering those zig-zagging lines can feel like trying to read an alien language. But what if I told you that those shapes — those patterns — actually tell a story? And once you understand that story, you could make smarter trading decisions. That’s where a trading chart patterns book PDF becomes your secret weapon.
In this article, we'll break down trading chart patterns in a friendly, no-nonsense way. We'll also explore how combining this knowledge with algorithmic trading software — especially the best algo trading software in India — can supercharge your trading game.
Download the best trading chart patterns book PDF. Learn how chart patterns, algorithmic trading software, and the best algo trading software in India help you win.
What Are Trading Chart Patterns?
Think of chart patterns like footprints in the snow. They show you where traders have been — and sometimes where they might go next. A chart pattern is just a visual formation on a price chart that helps traders make predictions. Whether it’s a triangle, a head and shoulders, or a double bottom — these shapes can signal buying or selling opportunities.
Why Use a Trading Chart Patterns Book PDF?
Let’s be real — the internet is loaded with scattered info. But a trading chart patterns book PDF puts everything in one place. It’s your go-to guide, available offline, structured, and perfect for both beginners and seasoned traders. Plus, you can refer to it anytime — even during a coffee break.
The 3 Main Types of Chart Patterns
Just like in movies, there are three main types of chart patterns:
Reversal Patterns: These hint that the trend is about to change.
Continuation Patterns: These suggest the trend will likely continue.
Bilateral Patterns: They could go either way — like a cliffhanger ending.
Understanding these gives you the power to react smartly, not emotionally.
Top Reversal Patterns Explained
Reversal patterns are like plot twists. They tell you the story is changing.
Head and Shoulders: Think of it like a person slumping. It often signals a shift from up to downtrend.
Double Top and Bottom: These patterns look like the letter ‘M’ or ‘W’. They scream, “Change is coming!”
Learning to spot these can save you from a bad trade — or help you enter just in time.
Key Continuation Patterns You Should Know
Continuation patterns keep the story flowing in the same direction.
Triangles (Ascending, Descending, Symmetrical): Imagine price compressing like a spring — ready to break out.
Flags and Pennants: These are like pit stops in a rally. The price pauses, then zooms off again.
Master these, and you’ll catch trends before others even notice.
How to Read Patterns Like a Pro
Reading chart patterns is part art, part science. Here’s how to get good at it:
Use candlestick charts for clarity.
Watch volume — it tells you how strong a move is.
Use support and resistance lines like guardrails.
It’s like learning to read music — confusing at first, but magical once you get it.
Common Mistakes Traders Make
Even the best traders mess up. Here are common traps:
Forcing patterns: If it doesn’t fit, don’t force it.
Ignoring volume: Patterns without strong volume are weak.
Overtrading: Don’t jump into every “almost” pattern.
Remember: Quality over quantity wins the game.
Best Resources for Chart Pattern PDFs
Here are some great places to find your next trading chart patterns book PDF:
Chart Patterns & Technical Indicators by Edward Dobson
Technical Analysis of the Financial Markets by John Murphy
Online libraries like Scribd, Academia, and even Reddit threads
Official broker platforms often offer free downloads
Just make sure you pick one with charts and examples, not just theory.
How Algorithmic Trading Software Helps
This is where things get exciting. Algorithmic trading software uses computer code to place trades. It can recognize patterns faster than any human. When you combine this with your knowledge of chart patterns, you’ve got a winning formula.
It’s like pairing Sherlock Holmes (your pattern spotting) with Watson (your algo software). Together, unbeatable!
Best Algo Trading Software in India
If you’re in India, here are some top-rated options:
Quanttrix – Known for speed and user-friendly interface.
Zerodha Streak – Drag-and-drop logic for non-coders.
AlgoTrader India – Offers institutional-grade automation.
Each has features like backtesting, live execution, and real-time analysis — ideal for traders who want results.
Using Chart Patterns in Algorithmic Strategies
Good algorithmic traders don’t just rely on numbers. They bake in pattern recognition rules:
Code to detect head and shoulders
Alerts for double tops
Algorithms that track breakout triangles
These strategies can be coded in platforms like MetaTrader, Python scripts, or even Streak.
Getting Started With a Chart Pattern Book
Here’s how to start:
Download a recommended trading chart patterns book PDF.
Start with 3-5 basic patterns.
Print a cheat sheet.
Look at real charts daily.
Journal what you see.
Consistency is key — don’t expect overnight success.
Tips to Practice Pattern Recognition
Think of pattern spotting like facial recognition. The more faces (charts) you see, the better you get.
Use trading simulators
Join trader communities
Quiz yourself using historical charts
Mark up charts manually
This hands-on practice boosts your confidence and instincts.
Mobile Apps & Tools for Chart Learning
Want to learn on the go? Try these:
TradingView: Mobile-friendly and packed with features.
Investing.com App: Clean charts and lots of news.
ChartSchool by StockCharts: A mini chart encyclopedia.
These help reinforce what you read in your chart pattern PDF.
Final Thoughts
Trading isn’t magic — it’s mastery. Understanding chart patterns gives you a serious edge. And when paired with powerful algorithmic trading software, especially the best algo trading software in India, you can turn insights into intelligent action.
So go ahead. Download that trading chart patterns book PDF, open up a demo account, and start seeing the market with new eyes. The journey from confusion to clarity starts with one pattern.
FAQs
What is the best trading chart patterns book PDF for beginners? “Technical Analysis for Dummies” and “Chart Patterns Explained” are great PDFs for those starting out.
Can I use chart patterns with algorithmic trading software? Yes! Many algorithmic tools allow you to code or automate pattern recognition and trading rules.
Which is the best algo trading software in India? Quanttrix and Zerodha Streak are widely recommended due to their user-friendly tools and performance.
Are trading chart patterns reliable for predicting markets? They’re not perfect, but when combined with volume and confirmation signals, they greatly improve your odds.
Where can I practice chart pattern recognition for free? Websites like TradingView and platforms like MetaTrader offer free tools and demo accounts.
0 notes
Text
Master Technical Analysis: Your Guide to the Indian Stock Market
Navigating the Indian stock market can feel overwhelming. With thousands of stocks and constant fluctuations, how do you make informed decisions? Technical analysis offers a way to understand market movements through charts and indicators. This guide will help you get a grip on the essentials of technical analysis, making it easier to trade wisely.
The Allure and Challenges of the Indian Stock Market
The Indian stock market has its own excitement. Investors are drawn to the potential for great returns. However, with opportunity comes risk. The market is volatile, and prices can change quickly. Understanding the tools available can help traders to manage that risk effectively.
Why Technical Analysis is Crucial for Indian Traders
Technical analysis simplifies the process of Stock Marketing Trading. It focuses on price movements and volume rather than company fundamentals. By studying price charts and patterns, traders can make predictions about future market behavior. This method helps reduce emotional decision-making and allows for a more disciplined approach.
Setting the Stage: What This Guide Covers
This guide covers key aspects of technical analysis, including:
Chart Patterns
Technical Indicators
Candlestick Patterns
Risk Management
Advanced Techniques
Each section aims to provide clear insights and actionable strategies for traders in the Indian market.
Chart Patterns: Deciphering Market Signals
Identifying Trend Reversals: Head and Shoulders, Double Tops/Bottoms
Chart patterns are graphical representations of price movements. Recognizing these patterns can signal potential trend reversals:
Head and Shoulders: Indicates a reversal from bullish to bearish.
Double Tops: Signals a peak before a downward trend.
Double Bottoms: Suggests a potential upward movement.
Spotting Continuation Patterns: Flags, Pennants, Wedges
Continuation patterns suggest that a trend will continue. Key patterns to watch include:
Flags: Short-term consolidation before a continuation.
Pennants: Small symmetrical triangles after a sharp price movement.
Wedges: Indicates a potential reversal in a strong trend.
Practical Application: Real-world examples of pattern recognition in Indian stocks
For example, if an Indian stock like Reliance Industries shows a head and shoulders pattern, it might indicate a shift from a bullish trend to a bearish one, guiding traders to adjust their positions accordingly.
Technical Indicators: Unveiling Market Momentum
Moving Averages: Simple, Exponential, Weighted – Explained
Moving averages smooth out price data to identify trends over a specific period. Key types:
Simple Moving Average (SMA): Averages prices over a set time.
Exponential Moving Average (EMA): Gives more weight to recent prices.
Weighted Moving Average (WMA): Assigns different weights to prices based on their age.
Relative Strength Index (RSI): Gauging Market Strength and Weakness
The RSI is a momentum oscillator that ranges from 0 to 100. It helps traders spot overbought or oversold conditions:
Above 70: Indicates overbought conditions.
Below 30: Suggests oversold conditions.
MACD: Identifying Momentum Shifts and Potential Trading Signals
The Moving Average Convergence Divergence (MACD) can identify shifts in momentum. When the MACD line crosses above the signal line, it may indicate a buy signal, and vice versa.
Candlestick Patterns: Unlocking Price Action Insights
Understanding Candlestick Formation and Interpretation
Candlestick charts provide visual insights into price movements. Each candle shows the open, close, high, and low prices for a specific time period.
Powerful Candlestick Patterns: Doji, Hammer, Engulfing Patterns
Some key candlestick patterns include:
Doji: Indicates indecision in the market.
Hammer: Suggests potential bullish reversal.
Engulfing Patterns: Signals strong shifts in market sentiment.
Combining Candlestick Patterns with Indicators for Enhanced Accuracy
By pairing candlestick patterns with indicators like RSI or MACD, traders can enhance their analysis and improve trade accuracy.
Risk Management and Position Sizing in the Indian Context
Defining Your Risk Tolerance and Setting Stop-Loss Orders
Understanding personal risk tolerance is crucial. Setting stop-loss orders helps limit potential losses. For example, if a trader is willing to risk 2% of their portfolio on a trade, they should set a stop-loss accordingly.
Position Sizing Strategies for Indian Stock Market Trading
Calculating position sizes based on risk tolerance aids better capital management. A common method is the fixed percentage approach, allowing traders to determine how much to invest in each trade.
Adapting Risk Management to the Unique Characteristics of Indian Markets
Consider the high volatility in Indian stocks. Adjust risk management practices to protect capital during price swings.
Advanced Technical Analysis Techniques
Fibonacci Retracements and Extensions: Identifying Support and Resistance Levels
Fibonacci levels are used to identify potential retracement levels. Traders often look for support or resistance at these levels during price corrections.
Elliott Wave Theory: Understanding Market Cycles and Trends
Elliott Wave Theory suggests markets move in predictable cycles. Identifying these waves helps traders anticipate future price movements.
Combining Multiple Techniques for Comprehensive Market Analysis
Using multiple technical analysis tools together provides a fuller picture. For instance, analyzing chart patterns alongside indicators can enhance trading decisions.
Conclusion: Mastering Technical Analysis for Sustainable Success
Key Takeaways: Actionable Steps for Indian Stock Market Traders
Focus on mastering chart patterns and technical indicators.
Incorporate risk management strategies tailored to the Indian market.
Continuously learn and adapt to market changes.
Continuous Learning and Adaptation in the Dynamic Indian Market
The Indian stock market is ever-changing. Stay updated with market trends and refine your strategies regularly.
Resources for Further Learning and Development
Books, online courses, and webinars can enhance your understanding. Explore resources like financial news platforms, stock market blogs, and trading forums to continue your education in technical analysis.
By mastering technical analysis, you position yourself for success in the dynamic Indian stock market. Embrace the tools and strategies outlined in this guide to make informed trading decisions. Start analyzing today!
0 notes