#aerosol emission
Text

Best Regards
The Gravitational Waves Reflection In The Solar System
(Analytical Study) (Revised)
https://app.box.com/s/yx3tx5lsvwy4025p4j3mwfeliwhtka07
or
https://app.box.com/s/9wywdejkxqh7x4g791ntf3p3p01kkm8f
or
https://www.tumblr.com/itsgerges/759715471336570880/the-gravitational-waves-reflection-in-the-solar?source=share
or
https://gerges2022.livejournal.com/236389.html
Abstract
Paper question
How Is Planet Velocity Defined?
Paper Hypothesis No. (1)
The solar system is one energy moves in space and reflects 3 times - the points of the reflection are the planets- as a result- the planets are created depending one each other by this energy reflection.
The Explanation Of The Hypothesis No. (1)
I- Preface
Why do we need to define Planet velocity here? Because
Planet velocity definition disproves The Solar System Classical Description.
II- The hypothesis Explanation in details
1 The Energy Reflection Definition
2 The Energy Reflection Proves
3 The Energy Reflection Result
4 The Energy Reflection Objective
5 Saturn Creation Depends On Uranus And The Earth
Let's explain the previous items in following
I- Preface
Why do we need to define Planet velocity before any other discussion in this paper? Because Planet velocity disproves The Solar System Classical Description.
The classical description refutation is a great event because the theories depend on it and – that means- more than 12 theories are wrong in the modern physics book
Shortly- more than the half of the modern physics book provides imaginary ideas and wrong theories because the solar system classical description is wrong.
Let's see examples to explain that clearly
Example No. (1)
No Planet Moves By The Sun Gravity- Newton is wrong- I have proved this fact since long time- and I explained that- Planet moves by the force caused its creation- means- the planet creation and motion is done by one force only otherwise this planet would be broken- simply – if two forces have effects on the same planet it would be broken- means- the planet moves with its creation force- again No planet moves by the sun gravity-
The example shows a gap between the physics book and the solar system facts – Newton imaginary idea is believed by everyone since 400 years!
But- the example doesn't show how great the gap is- in fact the shock is coming from The Sun Nuclear Fusion Theory- let's see the next example
Example No. (2)
The Sun Is Created By The Planets Motions Energies–The Sun Is A Phenomenon
Here we can see the gap clearly
The solar planets were found in their orbits before the sun creation and the planets were revolving around a point in space (this point has no light)
The planet motion produces energy (1/2 mv^2) and this energy is stored in the space in waves form- the planets were revolving around this point for long periods till the stored motion energy in the space be massive energy-
From this massive motion energy the light beam is created (the sun rays is created)
The sun rays is created from this energy- that tells why the sun corona temperature is 5 millions Kelvin but the sun surface is 5800 Kelvin- simply- because The Sun Is Not Doing Nuclear Fusion To Produce Its Rays, the rays is created by the planets motions energies– The Sun Rays Show The Great Gap Between The Physics Book And The Facts
The wrong description is the reason behind the imaginary ideas and wrong theories in the physics book- one more example- the scientists won Nobel prize in physics for their discovery for the gravitational waves- these scientists told us – the gravitational waves are produced by the sun gravitational field which is NOT FACT– the gravitational waves are produced by Planet motion energy- where the planet moves and produces energy (1/2 mv^2) and the planet can't store its motion energy inside its body otherwise its temperature would be raised for that the planet motion energy is stored in the space In Waves Form- the scientists discovered these waves and they called them gravitational waves!! Let's provide one more example
Example No. (3)
The big bang theory tells us the planet creation is done by random process- in details- the theory tells–some planets are suffered from collisions and these collisions changed their diameters and masses- by that we can't know their original diameters and masses by that the current values of these diameters and masses are found by chance and without any geometrical reasons and should be considered random data-
For example- Jupiter diameter now is 142984 km but what's this diameter value in the first creation of Jupiter?
The big bang theory and all random creation ideas are wrong and nonsense- shortly- I have my planet diameter equation which proves Planet diameter is created based on a geometrical rule- means- for example- Jupiter diameter is created at first as 142984 km and never changed since its creation- if any planet had collision and changed its diameter this collision results would be recorded in this planet motion features- as happened with Mars- Mars original orbit was between Mercury and Venus and Mars had migrated to its current orbit- and Mars had collided with Venus and The Earth in its migration motion- but Mars diameter equation refers frequently to its original orbit features and data- that tells the planet motion provides a record for its history because all data is required for planet motion- by that – all data depends on geometrical rules and no random process is used in it –
let's introduce my planet diameter equation in following….
Planet Diameter Equation (v1/v2)= (s/r)= I
v = Planet Velocity and r = Planet Diameter
s= Planet Rotation Periods Number In Its Orbital Period
I= Planet Orbital Inclination (example, 1.8 degrees be produced as a rate 1.8)
v2, s, r and I are belonged to one planet and v1 is belonged to another planet
The planet (v1) is defined by test the minimum error
Earth Equation uses Neptune velocity
Mars Equation uses Pluto velocity
Jupiter Equation uses the Earth moon velocity
Saturn Equation uses Mars velocity
Uranus Equation uses Neptune velocity (As Earth)
Neptune Equation uses Saturn velocity
Pluto Equation uses the Earth moon velocity (As Jupiter)
(The Equation works from The Earth To Pluto) (the discussion explains the reason)
Example
Neptune Equation (89143 /49528) = 9.7/ 5.4 =1.8
89143 = Neptune rotation periods number in Neptune orbital period
49528 km = Neptune diameter
9.7 km/s = Saturn velocity
5.4 km/s = Neptune velocity
59800 days = Neptune orbital period (and Neptune rotation period =16.1 hours)
1.8 degrees = Neptune Orbital Inclination
The equation tells planet diameter is created based on its velocity –means- Neptune diameter is 49528 km because Neptune velocity is 5.4 km/s
The Equation Concept
Planet diameter should be a function in its orbital distance –otherwise- this planet would be broken by its motion- the fact is that – The necessary requirement for planet safe motion is to create a function between this planet diameter and its orbital distance
BUT- the designer can't create a function has only 2 variables (Planet diameter and its orbital distance)- the function in this case can't be useful because – If this planet changes its orbital distance its diameter would be broken also because the diameter is a direct function in the orbital distance without any other variables -As A Result
The designer created the planet diameter as a function in this planet rotation period and the planet rotation period is created as a function in this planet velocity and the planet velocity is created as a function in this planet orbital distance- by that- the function between the planet diameter and its orbital distance is created but the function contains also more variables (rotation period, orbital period and velocity)- by that- if the planet changes its orbital distance- this planet diameter will not be changed but its rotation period, orbital period, and velocity will be changed and the diameter will be saved-
NOTICE-Mars is the example for this theory because Mars original orbit was between Mercury and Venus and Mars had migrated from its original orbit to its current one- after Migration Mars changed its motion data but the diameter is saved
NOTICE- Planet diameter equation is very useful to analyze the energy reflection in the solar system because the equation shows the changes in data resulting from the energy reflection- for example- the equation produces the planet orbital inclination-but in Saturn equation- the equation produces the value (0.4) while we know Saturn orbital inclination is 2.5 degrees- the value (0.4) is produced because the energy is reflected in Saturn and that caused effect on the data by that the value (2.5) become (1/2.5) = 0.4- that's why I refer to my planet diameter equation in this discussion because the equation can work as a tool of anatomy which can see clearly what's happening for the energy in each planet-
Matter Definition
My planet diameter equation provides a new definition for the matter – this definition is found to answer the question- (How Can Planet Velocity And Motion Be Defined Before This Planet Creation?)
What's The Matter And How Is Created?
The matter and space are created from the same one energy and both move with the motion of this energy from which they are created- but- the matter creates for itself a distinguish form and moves by different velocity from the space motion (notice the gravitational waves prove the space has motion and not static).
This is similar to the sea of water- the space is similar to the sea of water and the matter is similar to a whirlpool (vortex) found on the sea page-
The whirlpool (vortex) is created by the sea water and it's carried by the sea water motion- spite of that- the whirlpool is different in its form from the sea waves – also the whirlpool moves by different velocity from the sea waves motion velocity- this example gives explanation for the matter definition- the matter is similar perfectly to the whirlpool on the sea page- it's created by the sea water motion but it has a distinguish form and different velocity from the sea waves-
Also
The whirlpool dimensions depend on the sea water motion features- for example – we have a whirlpool its diameter is 2 meters, this diameter is formed by the sea water motion features (the water velocity- amount-pressure -……etc) that tells the whirlpool is found later after the sea creation- and the water motion is found before the whirlpool creation- this meaning is a fact for the matter creation and dimensions- the matter dimensions are created based on this matter motion- means- the motion is defined before the matter creation- this is proved strongly by my planet diameter equation- the equation tells (for example) Neptune diameter is 49528 km because Neptune velocity is 5.4 km/s- the whirlpool idea explains how the planet matter data is defined based on its motion- because
The original energy was found in motion at first and the planet matter is created from this moving original energy and the planet matter dimensions are defined by this original energy motion features- after the planet creation, the planet moves with this original energy motion means the planet moves this same motion based on which the planet data is created that's why the planet data is in full harmony with the planet motion features.
Also the idea shows the planet motion reason- as I proved before- no planet moves by the sun gravity- Newton is wrong- because the planet creation and motion are done by one force only otherwise this planet would be broken if two forces have effects on it
Here we see the planet motion reason- the planet moves with the original energy from which this planet is created-
What's the original energy?
The original energy is one light beam energy- because – the solar planets and their distances are created from one energy and this energy is provided by one light beam –means – the planets are geometrical points found on the same one light beam and the planets move with this light beam motion-
By that the planets are similar to carriages in one train and the light beam is this train engine- the light motion causes all planets motions
NOTICE - this definition of the matter and planet is very important for our discussion because the paper hypothesis no. (1) tells – the solar system is one energy moves in the space and reflected on some points and these points are the planets- the reflection of energy discussion will show how each planet data and motion depend on the other planet motion by the energy reflection effect- shortly- (The Planet Is A Geometrical Point) this idea is the best one can explain the energy reflection data- by that we can understand how the energy motion and reflection can effect on the planet creation and motion- the energy reflection discussion is found in the paper first hypothesis explanation.
Planet Velocity Definition
Again let's ask ……Why Do We Need To Define The Planet Velocity? ……….
Because – the planet velocity definition refutes the solar system classical description- the definition proves the planet is a geometrical point on the moving energy (and refute the classical definition tells – planet is a solid body created independently from the space and other planets) – in fact the planets are created depending on each other – The 9 planets are as 9 knots or snarls on the same one rope or cable – No planet is created independently– also all of them are created by the same one motion and the same one reason- (imagine you have a ladder or stairs is consisted of 9 units- all units are similar and found for the same reason)- the data proves this fact also
Planet velocity definition provides a powerful proof against Newton theory of the sun gravity-No Planet Motion Depends On Its Mass- Newton is wrong- the velocity Definition Doesn't Refer To Planet Mass- Also planet velocity definition provides a direct strong proof for the energy reflection in the solar system- also – the velocity definition explains the complex machine behind the planet motion which refutes again the naïve idea of Newton about this motion-
The planet velocity definition shows the general design of the solar system where all planets data is defined based on its velocity- means- the planet velocity is defined at first (after the orbit definition) and all other data is defined based on this velocity as we have seen the planet diameter is defined by the rate (v1/v2) by my planet diameter equation and planet orbital distance is defined by the rate (v1/v2)^2 and planet orbital period is defined by the rate (v1/v2)^3- shortly- the motion is the planet life
SHORTLY
I refute the solar system classical description and I wanted to put a piece of strong proof in the first pages of my paper to show that the refutation doesn't depend on ideas or logical analysis- but the refutation depends on the contradiction between the physics theories and the planets creation & motion data- If the contradiction is proved that tells the description is wrong because the planets data can NOT be wrong
Let's start our discussion
How is planet velocity defined?
Kelper stated, planet orbit defines its velocity, this rule is proved by the equation (v1/v2)^2=(d2/d1) where (d= planet orbital distance) and (v= planet velocity)
BUT
How Is The Planet Velocity Defined? And By What Rules?
Planet velocity is defined by Three Rules let's see them in following
(i) First Rule
v1v2 = constant= 322 (my 5th equation)
47.4 km/s (Mercury velocity) x 6.8 km/s (Mercury velocity) =322
35 km/s (Venus velocity) x 4.7 km/s (Pluto velocity) x 2 =322
29.8 km/s (The Earth velocity) x 5.4 km/s (Neptune velocity) x 2 =322
24.1 km/s (Mars velocity) x 13.1 km/s (Jupiter velocity) =322
(Max error 2%)
The rule (v1v2=322) tells the velocities are defined in pairs and not individually, each planet velocity has its own complementary- the rule tells the velocities are reflected on one another- the reflection of energy and data will be studied in details in planet velocity discussion-
In this rule we interest for the constant (322)- let's ask- why the constant = 322?
The constant 322 depends on the speed 1.16 million km per second because
(1160000 seconds = 322 hours) - Means
Mercury (47.4 km/s) moves in 6.8 hours a distance = 1.16 million km and
Uranus (6.8 km/s) moves in 47.4 hours a distance = 1.16 million km
Shortly -we realize that the constant 322 is produced based on the speed 1.16 million km per second- means- the planets velocities are complementary each other because they are defined as functions in this same speed 1.16 million km per second
(This is similar to electron and positron are produced from Gamma ray, The two particles depend on Gamma energy in their masses)
Based On This Data
I concluded there's a light beam its speed 1.16 million km per second and from this light beam energy the solar system is created- and the planets velocities are defined as functions in this speed 1.16 million km per second and that causes the velocities to be complementary each other-
(Please note the speed 1.16 million km per second is proved strongly by other data in my paper specially because the light created the space at first before any planet creation by that all distances in the solar system are created by the energy of this light beam and its speed 1.16 million km per second is registered in the data)
(ii) Second Rule
v1v2 = 1
The velocity here uses the solar day (86400 seconds) – let's prove that-
Mercury moves per solar day = 4.095 million km
Venus moves per solar day = 3.024 million km
The Earth moves per solar day = 2.574 million km
The Moon moves per solar day = 2.4 million km
Mars moves per solar day = 2.082 million km
Jupiter moves per solar day = 1.1318 million km
Saturn moves per solar day = 0.838 million km
Uranus moves per solar day = 0.5875 million km
Neptune moves per solar day = 0.4665 million km
Pluto moves per solar day = 0.406 million km
AND
0.406 (Pluto velocity) x 2.4 (the moon velocity) = 1 (error 2.5%)
0.4665 (Neptune velocity) x 2.082 (Mars velocity) = 1 (error 2.5%)
0.5875 (Uranus velocity) x 3.024 (Venus velocity)/1.772 = 1 (error 2.5%)
0.838 (Saturn velocity) x 1.1318 (Jupiter velocity) = 1 (error 5%)
(1.772 = π^1/2)
The second rule tells very similar meaning (v1v2= constant= 1)
The data uses the velocities per solar day for that the constant is changed from 322 into 1 but the rule is the same- (v1v2= Constant)
I want to say- the rule (v1v2 = Constant) tells a clear idea that (The Velocities Are Reflected On Each Other) this conclusion is simple one (A x 1/A= constant=1)
The rule proves the energy is reflected in the solar system and this reflection has effect on the planets data and for that the planets velocities are defined by this energy reflection and the velocities are produced complementary each other as a result.
Notice
The second rule causes confusion because the complementary player is changed- for example Pluto is complementary with Venus (in the first rule 35 x 4.7 x 2 = 322) but Pluto is complementary with the Earth moon in the second rule (0.406 x 2.4 = 1) that tells the players are changed which is illogical idea- how can we solve this problem?
The third rule solves it – let's see this rule in following
(iii) Third Rule
v1/v2 = 0.8 (based on the planets order)
47.4 km/s (Mercury velocity) x 0.8 = 38 (35 km/s = Venus velocity error 7.25%)
35 km/s (Venus velocity) x 0.8 = 27.78 (The moon velocity)
29.8 km/s (The Earth velocity) x 0.8 = 24.1 (Mars velocity) (error 1%)
24.1 km/s (Mars velocity) x 0.8 = 2 x 9.7 (Saturn velocity)
13.1 km/s (Jupiter velocity) x 0.8 = 2 x 5.4 (Neptune velocity) (error 3%)
6.8 km/s (Uranus velocity) x 0.8 = 5.4 (Neptune velocity)
5.4 km/s (Neptune velocity) x 0.8 = 4.3 (Pluto velocity 4.7 the error 7.25%)
Please note
The error 7.25 is found by the rate 1.0725 – that means
47.4 km/s (Mercury velocity) x 0.8 = 38 = 1.0725 x 35 km/s (Venus velocity)
5.4 km/s (Neptune velocity) x 0.8 = 4.3= 4.7 km/s (Pluto velocity) / 1.0725
29.8 km/s (Earth velocity) = 27.78 km/s (The moon velocity) x 1.0725
We know the rate 1.0725 is found by Lorentz length contraction effect- and we know this rate has effect on around 40% of all planets data – that's why we see this rate has effect on the planets velocities definition-
Let's remember the question-
In the rule (v1v2=322) we found that Pluto is complementary with Venus because
4.7 km/s (Pluto velocity) x 35 km/s (Venus velocity) x 2 = 322
But in the rule (v1v2 =1) we found Pluto is complementary with the moon because
0.406 mkm (Pluto Velocity Daily) x 2.4 mkm (The Moon Velocity Daily) = 1
The question asked – if the planets velocities are defined in pairs complementary each other and not individually how can the players be changed?
The answer tells – the planets velocities are rated by (0.8) based on the planets order means – the moon velocity daily 2.4 mkm = Venus velocity daily 3.024 mkm x 0.8
The rate (0.8) defines all planets velocities depend on each other by order-
Now let's see Planet velocity final definition – because- the definition uses three planets velocities together and not only two – let's put that clearly in following-
(iv) The Planet Velocity Final Definition
(A)
47.4 km/s (Mercury velocity) x 0.8 = 38 km/s (Venus velocity 35 km/s)
Venus moves per solar day 3.024 million km -But
1/3.024 = 0.3307 million km = Uranus moves per solar day 0.5875 million km /1.77
(note 1.77 = π^1/2) and (38 = 35 x 1.0725)
For that
47.4 km/s (Mercury velocity) x 6.8 km/s (Uranus velocity) = 322
(B)
35 km/s (Venus velocity) x 0.8 = 27.78 km/s (The Moon velocity)
The moon moves per solar day 2.4 million km -But
1/2.4 = 0.406 million km = Pluto moves per solar day 0.406 million km
For that
35 km/s (Venus velocity) x 4.7 km/s (Pluto velocity) x 2 = 322
(C)
29.8 km/s (The Earth velocity) x 0.8 = 24.1 km/s (Mars velocity)
Mars moves per solar day 2.082 million km -But
1/2.082 = 0.4665 million km = Neptune moves per solar day 0.4665 million km
For that
29.8 km/s (The Earth velocity) x 5.4 km/s (Neptune velocity) x 2 = 322
(D)
13.1 km/s (Jupiter velocity) x 0.8= 2 x 5.24km/s (Neptune velocity 5.4 km/s error 3%)
Neptune moves per solar day 0.4665 million km - But
1/0.4665 = 2.082 million km = Mars moves per solar day 2.082 million km
For that
13.1 km/s (Jupiter velocity) x 24.1 km/s (Mars velocity) = 322
Shortly
Three planets velocities are defined in each equation- that tells the planet velocity definition is a process more complex than the simple equation (v1v2= constant)
Notice
The 9 planets velocities total is 176 km/s – if we add the Earth moon velocity (29.8 km/s) the total will be 205.8 km/s
The planets velocities are complementary also for this velocity 205.8 km/s – let's see
205.8 km/s = Mercury velocity (47.4 km/s) x Pluto velocity (4.7 km/s) / 1.0725
205.8 km/s = Venus velocity (35 km/s) x Neptune velocity (5.4 km/s) x 1.0725
205.8 km/s = Earth velocity (29.8 km/s) x Uranus velocity (6.8 km/s)
205.8 km/s = Jupiter velocity (13.1 km/s) x Neptune velocity (5.4 km/s) x 3
Mercury velocity = 2 Mars velocity by that Pluto will be used for Mars also
Max error (3%)
Please Note- Saturn is exceptional because
205.8 km/s = 9.7 km/s (Saturn velocity) x 21.4
Where 21.4 hours = 2 x 10.7 hours (Saturn rotation period)
Means- the distance is passed by all planets motions in one hour equal the distance is passed by Saturn in 2 rotation periods (21.4 hours) that tells more analysis is required for Saturn velocity- as we should do later.
(v)
A Question (Why Is The Rate (0.8) Used To Define Each Planet Velocity Based On Its neighbor?)
Kepler stated (Planet orbit defines its velocity) and
My planet orbital distance equation proves each planet orbit is defined based on its neighbor – means- my equation uses only 2 neighbor planets orbital distances
Here also-Planet velocity is defined based on its neighbor – means- this connection enabled Kepler to conclude his statement (Planet orbit defines its velocity)
But Why The Rate (0.8)??
The rate (0.8) is found by the energy reflection effect on Planets velocities definition, for that we need to analyze the energy reflection process deeply to see how the planet velocity is defined by it - The energy reflection process is discussed deeply in the first hypothesis explanation- let's start its discussion in following…
II- The Hypothesis Explanation In Details
Let's remember the paper first hypothesis
The solar system is one energy moves in space and reflects 3 times - the points of the reflection are the planets- as a result- the planets are created depending on each other by this energy reflection.
In following we discuss the energy reflection process in details because the planet velocity definition proves the planets data is reflected on each other and we here try to see as deep as possible how this reflection process is done – the discussion is divided into 5 items which are
Item No. 1 The Energy Reflection Definition
Item No. 2 The Energy Reflection Proves
Item No. 3 The Energy Reflection Result
Item No. 4 The Energy Reflection Objective
Item No. 5 Saturn Creation Depends On Uranus And The Earth
Let's start our discussion in following
Item No. 1 The Energy Reflection Definition
Here we define the reflection of energy – let's do that in following
The solar system is one energy- this energy moves through the space- we can imagine this energy as a light beam or electromagnetic wave- and- the data tells this energy is reflected- let's suppose this energy is reflected from the point (A) to the point (B)- now- these points (A and B) are planets in the solar system-
That tells, the planet is a point in space on which the energy is reflected- it's difficult to accept such strange idea- BUT
The planets data is more strong than our evaluation- we will see that- the planets data is created by the reflection of energy- this fact is proved strongly and doubtless-
For that I analyze the reflection of energy process in details because by this process the planets are created and the energy cycle is completed- for that – we examine the reflection of energy deeply - Now- let's define the energy reflection in following
(i)
The energy is reflected three times in the solar system- from Pluto to Neptune (1st reflection) and from Uranus to Jupiter (2nd reflection) and from Venus to Mars (3rd reflection)
The first and second reflections are unified and work together as one reflection only (later will explain why) - by that – the solar system has 2 basic reflections- the reflection in the outer planets and the reflection from Venus and Mars
(ii)
The reflection of energy is proved strongly because the planets data are changed as a result- let's write these changes in following
v What's used as (A) before the reflection will be used as (1/A) after the reflection.
v What's used as (a distance) before the reflection will be used as (a period of time) after the reflection
v The velocities be squared –the rate (v1/v2) before reflection will be (v1/v2)^2 after the reflection.
v The energy direction is changed by the reflection usually
v The players of the rates of time are reflected also –
These changes are found in all reflections of energy- that's why the proof is powerful and can't be refuted because the planets data shows the reflection process details
(iii)
Let's see the changes in the planets data generally
(Venus reflection)
By this reflection of energy Venus orbital circumference 680 million km will be used as Mars orbital period 687 days and it defines Jupiter orbital period (4331 days = 2π x 687 days) and also Saturn orbital period (10747 days = 4π x 687 days x (1/0.8)) where Uranus orbital inclination (0.8 degrees) creates effect on Saturn data
AND
Venus Orbital Period 224.7 days be used as 227.9 million km (Mars orbital distance)
AND
Also the reflection defines the planets diameters by that
Venus circumference 38025 km = Mars Circumference 21346.6 km x 1.772
(π=3.14159= 1.772^2) (more data about this reflection is discussed later)
(The Outer Planets Reflection)
The reflection is done by Jupiter to Uranus, by that, Jupiter orbital circumference 4900 million km will be used as Uranus orbital period 30589 days where (30589 days = 4900 days x 2π and Neptune orbital period 59800 days = 4900 days x 4π and Pluto orbital period 90560 days = 4900 days x 6π
Notice- the reflection in the outer planets depends basically on Saturn and it's more complex than this simple data but I put similar data for comparison and later we will discuss the details
ALSO
The energy reflection at Venus passes above the Earth to Mars- where the Earth moon suffers from the length contraction effect and its motion distance daily is 2.4 mkm = 2.574 mkm (The Earth motion distance daily) / 1.0725
Similar to that
The energy reflection at Jupiter passes above Saturn to Uranus – Where
Saturn suffers from the length contraction effect because
1433 million km (Saturn orbital distance) x 1.0725 = 2 x 778.6 million km (Jupiter orbital distance) - And- the Earth moon daily displacement is 88000 km and during 10747 days the total be 940 million km=The Earth orbital circumference (where 10747 days = Saturn orbital period)
The previous data shows the reflection energy effect generally- it's important because it compares the data in two different groups and proves the data behaviors are similar- that proves these behaviors are caused by the same one cause-
But we will analyze each reflection in more details to see how each data is created
Item No. 2 The Energy Reflection Proves
(a)
Venus reflection of energy is discussed in item no. (4), But - Here We Analyze The Energy Reflections In The Outer Planets- There are two reflections in the outer planets (from Neptune to Saturn) and (from Uranus to Jupiter)- let's explain the energy trajectory
The energy is sent firstly from Pluto to Neptune and then The energy is reflected from Neptune to Saturn–means- it's one reflection is started by Pluto and finished by Saturn- later the energy is reflected one more time from Uranus to Jupiter- but we have to ask- if the energy was in Saturn orbit why this energy is returned again to Uranus? The reason is–Saturn is created as a result for an interaction between Uranus and the Earth- means- Uranus is Saturn Father- and the energy is got by Saturn sent automatically to Uranus and Uranus reflects this energy to Jupiter- we will discuss the process in details later.
AND
I put Saturn and Uranus relationship analysis in point No. (5) to prove that Saturn is Created by Uranus effect-
(b)
Also there's story I have to summarize before the data discussion-
Pluto energy is reflected to Neptune – this is the first reflection- means- Neptune should send this same energy to Uranus and then to Saturn and the other planets-BUT – Neptune didn't send the energy to Uranus but kept the energy in Neptune orbit – Uranus could not release the energy from Neptune orbit- for that- Uranus created the interaction with the Earth to create Saturn – Saturn is the warrior created to release the energy from Neptune orbit- by that Saturn released the energy from Neptune orbit and sent it immediately to Uranus and Uranus reflected this energy one more time toward Jupiter (CONT)
Gerges Francis Tawdrous +201022532292
Physics Department- Physics & Mathematics Faculty
Peoples' Friendship university of Russia – Moscow (2010-2013)
Curriculum Vitae https://www.academia.edu/s/b88b0ecb7c
E-mail [email protected], [email protected]
[email protected]
ORCID https://orcid.org/0000-0002-1041-7147
Facebook https://www.facebook.com/gergis.tawadrous
VK https://vk.com/id696655587
Tumblr https://www.tumblr.com/blog/itsgerges
Researcherid https://publons.com/researcher/3510834/gerges-tawadrous/
Google https://scholar.google.com/citations?user=2Y4ZdTUAAAAJ&hl=en
Livejournal https://gerges2022.livejournal.com/profile
Pocket https://getpocket.com/@646g8dZ0p3aX5Ad1bsTr4d9THjA5p6a5b2fX99zd54g221E4bs76eBdtf6aJw5d0?src=navbar
PUBLICATIONS
box https://app.box.com/s/47fwd0gshir636xt0i3wpso8lvvl8vnv
Academia https://rudn.academia.edu/GergesTawadrous
List of publications http://vixra.org/author/gerges_francis_tawdrous
Slideshare https://www.slideshare.net/Gergesfrancis
#space weather#seismology#earthquakes#sun#solar flare#earth atmosphere#magnetic field#magnetism#geomagnetism#aerosol emission#energy#electricity#electromagnetism#geomagnetically induced currents#science#earthquake forecast
2 notes
·
View notes
Text
Abstract
"The statistical analysis of the impact of the top 50 X-class solar flares (1997–2024) on global seismic activity as well as on the earthquake preparation zones located in the illuminated part of the globe and in an area of 5000 km around the subsolar point was carried out. It is shown by a method of epoch superposition that for all cases, an increase in seismicity is observed, especially in the region around the subsolar point (up to 33%) during the 10 days after the solar flare in comparison with the preceding 10 days. The case study of the aftershock sequence of a strong Mw = 9.1 earthquake (Sumatra–Andaman Islands, 26 December 2004) after the solar flare of X10.16 class (20 January 2005) demonstrated that the number of aftershocks with a magnitude of Mw ≥ 2.5 increases more than 17 times after the solar flare with a delay of 7–8 days. For the case of the Darfield earthquake (Mw = 7.1, 3 September 2010, New Zealand), it was shown that X-class solar flares and M probably triggered two strong aftershocks (Mw = 6.1 and Mw = 5.9) with the same delay of 6 days on the Port Hills fault, which is the most sensitive to external electromagnetic impact from the point of view of the fault electrical conductivity and orientation. Based on the obtained results, the possible application of natural electromagnetic triggering of earthquakes is discussed for the earthquake forecast using confidently recorded strong external electromagnetic triggering impacts on the specific earthquake preparation zones, as well as ionospheric perturbations due to aerosol emission from the earthquake sources recorded by satellites."
continue reading
#space weather#seismology#earthquakes#sun#solar flare#earth atmosphere#magnetic field#magnetism#geomagnetism#aerosol emission#energy#electricity#electromagnetism#geomagnetically induced currents#science#earthquake forecast
4 notes
·
View notes
Text
3 Questions: A shared vocabulary for how infectious diseases spread
New Post has been published on https://thedigitalinsider.com/3-questions-a-shared-vocabulary-for-how-infectious-diseases-spread/
3 Questions: A shared vocabulary for how infectious diseases spread

On April 18, the World Health Organization (WHO) released new guidance on airborne disease transmission that seeks to create a consensus around the terminology used to describe the transmission of infectious pathogens through the air.
Lydia Bourouiba, the director of the MIT Fluid Dynamics of Disease Transmission Laboratory and the Fluids and Health Network, an associate professor in the MIT departments of Civil and Environmental Engineering and Mechanical Engineering, and a core member of the Institute for Medical Engineering and Science, served on the WHO expert team that developed the guidance. For more than a decade, Bourouiba’s laboratory has been researching fundamental physical processes underlying how infectious diseases spread from person to person.
The new WHO guidance puts forth new definitions of key terminology pertaining to respiratory infectious disease transmission. This reflects a new, shared understanding of how respiratory infectious pathogens move from one person to the next: through the exhalations of turbulent “puff clouds” that carry infectious contaminants in a continuum of droplet sizes and can lead to exposure at a range of distances.
Bourouiba’s lab has pioneered this physical picture and worked closely with a range of stakeholders over the years to ensure that public health guidance incorporates the latest science, improving preparedness for emerging respiratory pathogens. Bourouiba spoke with MIT News about the new WHO guidance.
Q: How did you become involved in creating these new guidelines?
A: I have been researching exhalation emissions for more than a decade. After the first SARS outbreak in 2003, I realized that the mechanisms by which respiratory pathogens are transmitted from one host to the next were essentially considered too random and too brief to be amenable to systematic investigation. Hence, the physical act of pathogen transmission was relegated to a black box. However, I also realized the fundamental importance of understanding these events mechanistically, to ultimately be able to mitigate such transmission events in a rational and principled manner. For this, we needed to understand the fluid physics and biophysics of respiratory emissions.
In the Fluid Dynamics of Disease Transmission Laboratory at MIT, we have been investigating these respiratory emissions. Our work showed that prior guidelines — specifically, the dichotomy of “large” versus “small” drops and isolated droplet emissions (essentially from spray bottles) — were not at all what we actually see and quantify when investigating respiratory emissions. We focused on establishing the full physics of such processes, from emission physiology to the fluid dynamics and biophysics of the exhalation flows and the interaction of the exhaled turbulent multiphase flow with the conditions of the ambient environment (air currents, temperature, and humidity).
Since 2015, I have also been working with the MIT Policy Lab at the Center for International Studies to disseminate our findings to public health officials and various agencies. We organized multiple conferences where we brought in scientists, clinicians, virologists, epidemiologists, microbiologists, and representatives from the U.S. Centers for Disease Control and Prevention and other groups, both before and during the pandemic.
In 2022, I was asked to serve on the World Health Organization’s technical consultation expert team, which was tasked with reaching a consensus on a new framework on respiratory infectious disease transmission. That process lasted about two years and culminated so far in the publication of the new guidelines. The process was obviously accelerated by the Covid-19 pandemic and the issues it brought to the fore regarding the inadequate old definitions. The goal of convening the consultation group was to bring together leading experts from around the globe and from very diverse fields — ranging from fluid physics to clinical medicine and epidemiology — to think through how best to redefine terms related to respiratory infectious disease transmission in light of the latest science. These new guidelines are very much a first step in a series of important consultations and efforts.
Q: How did your research change the WHO’s description of how diseases are transmitted through the air?
A: Our research established that these isolated droplets are not just exhaled as isolated droplets moving semiballistically [that will settle out of the air relatively near to the person who released them]. Instead, they are part of a multiphase turbulent puff gas cloud that contains a continuum of droplet sizes, where the cloud provides a comparatively warm and moist — and hence protective — environment for these droplets and the pathogens they contain, with respect to ambient air. One of our first papers establishing this concept was published in 2014. And we have showed since that models that do not include the proper physics of these turbulent puff clouds can dramatically underestimate the ranges of propagation and also completely shift estimates of risk and pathogen persistence in an indoor space.
These turbulent puff clouds are inhomogeneous, with potential for highly concentrated pathogen-bearing droplet load regions that can persist for a comparatively long time while moving very quickly across an indoor space in some of the most violent exhalations. Their dynamics enable potential effective inhalation exposure at a range of distances, long and short. This continuum and physical picture of concentrated packets of droplets and their impact on persistence of pathogen infectivity and exposure are in complete contrast with the notion of homogeneous mixing indoors, and the prior false dichotomy of “large” droplets that fall ballistically and “small” droplets that essentially evaporate immediately to form aerosols assumed to be deactivated. The prior picture led to the belief that only very few infectious diseases are airborne or requiring air management. This dichotomy, with other misconceptions, rooted in science from the 1930s, has surprisingly persisted in guidelines for decades.
The new guideline is a major milestone, not only because these guidelines do not change very often — every 10 or 15 years at best — but also because in addition to the WHO, five national or transnational health agencies have already endorsed the findings, including the U.S. Centers for Disease Control and Prevention, which also acknowledged the importance of the shift.
Q: What are the biggest implications of these changes?
A: An agreed-upon common terminology is critical in infectious disease research and mitigation. The new guidelines set the foundation for such a common understanding and process. One might think it is just semantics or a small, incremental change in our understanding. However, risk calculations actually vary tremendously based on the framework one uses. We used mathematical models and physical experiments and found that the physical picture change has dramatic implications on risk estimations.
Another major implication was discussed in one of our publications from the very early stages of the pandemic, which stressed the urgent need for health care workers to have N95 masks because of these cloud dynamics and the associated importance of paying attention to indoor air management. Here again, risk calculations without the puff cloud dynamics would suggest that a typical hospital room or emergency department would dilute sufficiently the pathogen load so as to not pose a high risk. But with the puff cloud and dynamic of the droplets of a continuum of sizes within it, and coupled with it, it becomes clear that health care workers could still be exposed via inhalation to significant viral loads. Thus, they should have been provided N95 masks, in most conditions, when entering the space hosting a Covid-19 patient, even if they were not in their immediate vicinity. That article was the first to call attention to the importance of masking of health care workers due to the actual exhalation puff cloud and continuum of droplet sizes, shaping airborne transmission.
It took public health agencies more than six months to start considering shifting their masking guidelines during Covid-19. But this WHO document is broader than Covid-19. It redefines the basic definitions surrounding all respiratory infectious diseases — those that we know and those yet to come. That means there will be a different risk assessment and thereby different decision trees and policies, trickling down to different choices of protective equipment and mitigation protocols, and different parts of health agencies or facilities that might be activated or deployed.
The new guidelines are also a major acknowledgement that infectious disease transmission is truly an interdisciplinary area where scientists, clinicians, and public health officials of different backgrounds need to communicate with each other efficiently and clearly and share their insights, be it fundamental physics or clinical infectious diseases. So, it is not just the content of these guidelines, but also the way this update unfolded. Hopefully it changes the mindset for responding to such public health threats.
#2022#aerosols#air#ambient#Article#assessment#attention#bearing#biophysics#black box#box#Center for International Studies#change#Civil and environmental engineering#Cloud#clouds#content#covid#covid 19#Disease#Diseases#droplets#dynamics#Emissions#engineering#Environment#Environmental#epidemiology#equipment#Events
0 notes
Text
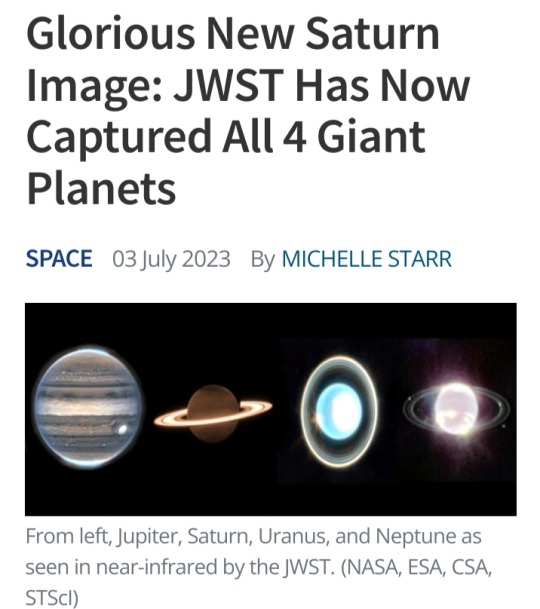
With the addition of Saturn, the James Webb Space Telescope has finally captured all four of our Solar System's giant worlds.
JWST's observations of the ringed planet, taken on 25 June 2023, have been cleaned up and processed, giving us a spectacular view of Saturn's glorious rings, shining golden in the darkness.
By contrast, the disk of Saturn is quite dark in the new image, lacking its characteristic bands of cloud, appearing a relatively featureless dim brown.
This is because of the wavelengths in which JWST sees the Universe – near- and mid-infrared.
These wavelengths of light are usually invisible to the naked human eye, but they can reveal a lot.
For example, thermal emission – associated with heat – is dominated by infrared wavelengths.
When you're trying to learn about what's going on inside a planet wrapped in thick, opaque clouds, studying its temperature is a valuable way to go about it.
Some elements and chemical processes emit infrared light, too. Seeing the planets of the Solar System in wavelengths outside the narrow range admitted by our vision can tell us a lot more about what they have going on.
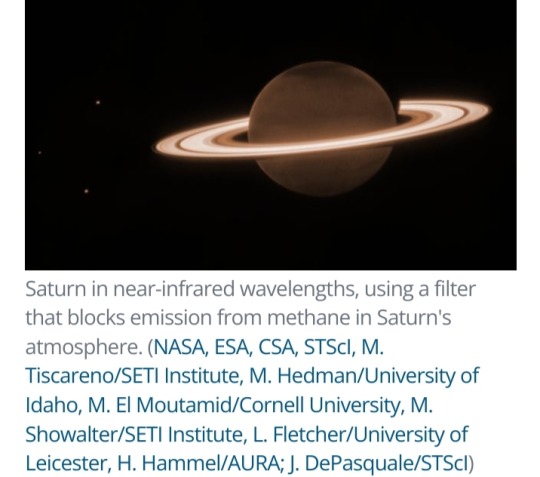
Saturn
As we saw last week, when we clapped eyes on the raw JWST Saturn images, the observations involved filters that dimmed the light of the planet, while allowing light from the rings and moons to shine brightly.
This is so a team led by planetary scientist Leigh Fletcher of the University of Leicester in the UK can study the rings and moons of Saturn in more detail.
They hope to identify new ring structures and, potentially, even new moons orbiting the gas giant.
The image above shows three of Saturn's moons, Dione, Enceladus and Tethys, to the left of the planet.
Although dim, the disk of the planet also reveals information about Saturn's seasonal changes.
The northern hemisphere is reaching the end of its 7-year summer, but the polar region is dark. An unknown aerosol process could be responsible.
Meanwhile, the atmosphere around the edges of the disk appears bright, which could be the result of methane fluorescence, or the glow of trihydrogen, or both. Further analysis could tell us which.
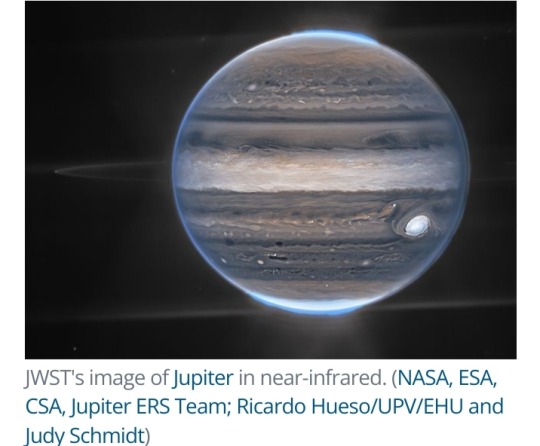
Jupiter
Jupiter was the first of the giant planets to get the JWST treatment, with images dropping in August of last year – and boy howdy were they stunning.
The spectacular detail seen in the planet's turbulent clouds and storms was perhaps not entirely surprising.
However, we also got treated to some rarely seen features: the permanent aurorae that shimmer at Jupiter's poles, invisible in optical wavelengths, and Jupiter's tenuous rings.
We also saw two of the planet's smaller, lesser-known moons, Amalthea and Adrastea, with fuzzy blobs of distant galaxies in the background.
"This one image sums up the science of our Jupiter system program, which studies the dynamics and chemistry of Jupiter itself, its rings, and its satellite system," said astronomer Thierry Fouchet of Paris Observatory in France, who co-led the observations.
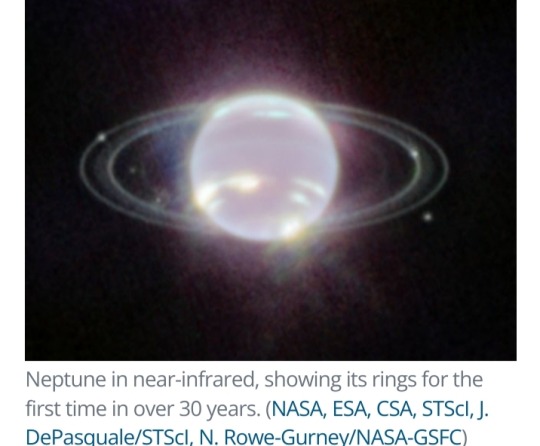
Neptune
Observations of Neptune arrived in the latter half of September 2022.
Because Neptune is so very far away, it tends to get a little neglected; you're probably used to seeing, if anything, the images taken by Voyager 2 when it flew past in 1989.
JWST's observations gave us, for the first time in more than 30 years, a new look at the ice giant's dainty rings – and the first ever in infrared.
It also revealed seven of Neptune's 14 known moons, and bright spots in its atmosphere.
Most of those are storm activity, but if you look closely, you'll see a bright band circling the planet's equator.
This had never been seen before and could be, scientists say, a signature of Neptune's global atmospheric circulation.
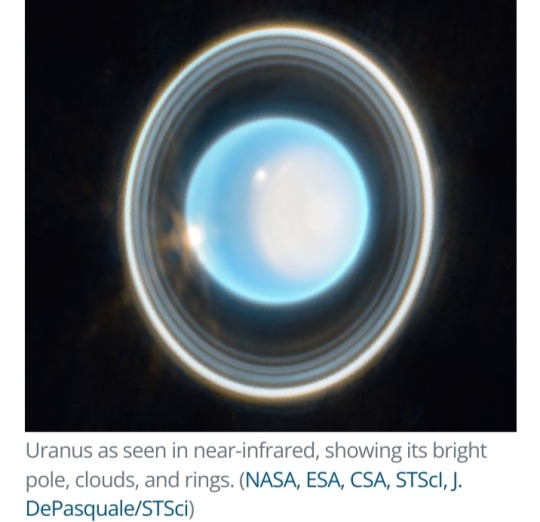
Uranus
Uranus is also pretty far away, but it's also a huge weirdo. Although very similar to Neptune, the two planets are slightly different hues, which is something of a mystery.
Uranus is also tipped sideways, which is challenging to explain too.
JWST's observations, released in April 2023, aren't solving these conundrums.
However, they have revealed 11 of the 13 structures of the incredible Uranian ring system and an unexplained atmospheric brightening over the planet's polar cap.
JWST has a lot to say about the early Universe; but it's opening up space science close to home, too.
As its first year of operations comes to an end, we can't help but speculate what new wonders will be to come in the years ahead.

Top: Jupiter - Neptune / Bottom: Uranus - Saturn
Credit: NASA
#James Webb Space Telescope#Solar System#Saturn#Jupiter#Uranus#Neptune#planets#space#universe#infrared wavelengths#wavelengths#JWST#Leigh Fletcher#planetary science#Thierry Fouchet#moons#Voyager 2#giant planets#astronomy
1K notes
·
View notes
Text
Abnormally warm patches of water in the Pacific Ocean, often referred to as 'blobs', have been having a disastrous effect on marine ecosystems since 2010. Now we may know what's causing them to keep appearing.
A new study from an international team of researchers, and involving some detailed computer simulations, has linked the blobs to a reduction in aerosol emissions in China – so a policy designed to improve environmental conditions may have also come with negative consequences attached.
The reason is that these tiny airborne particles released by factories and power plants do a very good job at reflecting sunlight back into space, and keeping our atmosphere cooler.
Without that cover, the Pacific is more exposed to heat from the Sun, which combines with increasing heat from human-made global warming.
Continue Reading.
94 notes
·
View notes
Text
The 1987 Montreal Protocol, which phased out the production and use of chemicals that were depleting the ozone layer, has long been considered one of the most successful environmental treaties in history. New research finds that the global pact achieved another unforeseen benefit: delaying the melting of Arctic sea ice.
In a study published Monday in the Proceedings of the National Academy of Sciences, researchers from the University of Exeter and Columbia University found that the implementation of the Montreal Protocol is delaying the first ice-free Arctic summer by up to 15 years. That’s because the chemicals banned under the agreement are also potent greenhouse gases.
“Our results show that the climate benefits from the Montreal Protocol are not in some faraway future: the protocol is delaying the melting of Arctic sea ice at this very moment,” Lorenzo Polvani, one of the study’s authors, said in a press release.
The study authors ran a series of climate models based on two different scenarios: one that included levels of ozone-depleting substances that would be expected if the Montreal Protocol never existed, and another accounting for the global treaty. The researchers concluded that the protocol is postponing the first ice-free Arctic summer by a decade or more, and entirely due to the phasedown of ozone-depleting chemicals.
The Montreal Protocol was created to address a hole in the stratospheric ozone layer over the Antarctic. The ozone layer protects the Earth from harmful ultraviolet radiation that causes skin cancer and cataracts in humans. The treaty phased out almost 100 chemicals — including aerosols used in hair spray and other products, refrigerants, and solvents — that were found to be responsible for destroying stratospheric ozone.
Those banned chemicals, collectively called ozone-depleting substances, or ODS, are also potent greenhouse gases, with up to tens of thousands times the global warming potential of carbon dioxide. The report authors estimate that 1 metric ton of avoided ODS emissions leads to 7,000 square meters (more than 75,000 square feet) of avoided Arctic sea loss. By way of comparison, 1 metric ton of carbon dioxide emissions results in about 3 square meters (about 32 square feet) of sea ice loss.
Given the potency of ODSs as a greenhouse gas, the authors are not surprised at this outsize impact on Arctic sea ice levels. “Nonetheless, such a large mitigating impact of the Montreal Protocol on Arctic sea ice loss is remarkable if one keeps in mind that the protocol was aimed at preventing ozone depletion in the Antarctic stratosphere, and little was known of its effect on Arctic sea ice when the protocol was signed,” the authors noted.
According to their projections, the Montreal Protocol has already prevented more than half a million square kilometers (about 193,000 square miles) of sea ice loss. By 2030, that amount will rise to more than 1 million square kilometers, and to 2 million square kilometers of prevented Arctic sea ice loss by 2040.
-via Grist, 5/24/23
#arctic#arctic circle#arctic ocean#arctic ice#sea ice#climate change#global warming#sea level rise#montreal protocol#cfc#hfc#greenhouse gasses#carbon dioxide#if we hurry#we can absolutely buy ourselves the time to save ourselves#as someone constantly looking at good news developments in the environment and green tech I truly believe that#good news#hope
418 notes
·
View notes
Text
The chemistry behind "Ocean Smell"

Near the coast, the unmistakable scent of the sea, often attributed to salt, actually stems from dimethyl sulfide (DMS). Produced by marine algae and decomposed by bacteria from decaying organisms, DMS forms marine aerosols through wave action, creating the iconic 'ocean smell.' As a major volatile sulfur compound, DMS constitutes approximately 95% of marine sulfur emissions, playing a crucial role in climate regulation by exerting anti-greenhouse gas effects.
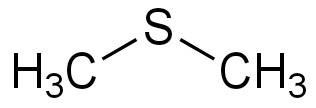
dimethyl sulfide (DMS):
Formula:C2H6S
ExactMass:62.02
Mol.Wt.62.13
Elem.Anal.:C,38.66H,9.73S,51.6
m/z:62.02(100%)64.01(4.52%)63.02(2.16%)
66 notes
·
View notes
Text
Excerpt from this story from EcoWatch:
An international team of scientists say efforts to protect the ozone layer have been a “huge global success,” with damaging atmospheric gases declining more quickly than expected.
According to the new study, the total amount of chlorine — which depletes the ozone — in all hydrochlorofluorocarbons (HCFCs) peaked in 2021, five years earlier than the most recent predictions.
“This has been a huge global success. We’re seeing that things are going in the right direction,” said Dr. Luke Western, lead author of the study and a Marie Curie Research Fellow at University of Bristol’s School of Chemistry, as The Guardian reported.
The reduction in HCFCs is largely due to the 1987 Montreal Protocol, which introduced controls on the usage and production of ozone-depleting substances. HCFCs were once common in the manufacturing of hundreds of products, from refrigerators and packaging to aerosol sprays and foams.
Lowering the amount of HCFCs — which are also greenhouse gases — should help lessen global heating, a press release from University of Bristol said.
Developed to replace chlorofluorocarbons — banned globally since 2010 — production and usage of HCFCs is still in the process of being phased out.
“The results are very encouraging. They underscore the great importance of establishing and sticking to international protocols,” Western said in the press release. “Without the Montreal Protocol, this success would not have been possible, so it’s a resounding endorsement of multilateral commitments to combat stratospheric ozone depletion, with additional benefits in tackling human-induced climate change.”
HCFC emissions fell less than one percent between 2021 and 2023, but are still moving in the right direction.
“Their production is currently being phased out globally, with a completion date slated for 2040. In turn these HCFCs are being replaced by non-ozone depleting hydrofluorocarbons (HFCs) and other compounds. By enforcing strict controls and promoting the adoption of ozone-friendly alternatives, the protocol has successfully curbed the release and levels of HCFCs into the atmosphere,” Western said.
37 notes
·
View notes
Text
Superspreading of SARS-CoV-2 at a choir rehearsal in Finland—A computational fluid dynamics view on aerosol transmission and patient interviews - Published Sept 12, 2024
Abstract
Introduction
COVID-19 pandemic has highlighted the role of aerosol transmission and the importance of superspreading events. We analyzed a choir rehearsal in November 2020, where all participants, except one who had recently earlier recovered from COVID-19, were infected. We explore the risk factors for severe disease in this event and model the aerosol dispersion in the rehearsal room.
Materials and methods
Characteristics of participants were collected by interviews and supplemented with patient records. A computational simulation of aerosol distribution in the rehearsal room and the efficacy of potential safety measures was conducted using the Large-Eddy Simulation approach. Infection risk was studied by analyzing quanta emission and exposure with the Wells-Riley equation.
Results
The simulation showed that airborne transmission likely explains this mass contagion event. Every singer was exposed to the virus in only 5 min from the beginning of the rehearsal, and maximum concentration levels were reached at 20 min the concentration levels started to approach a steady state after 20 min. Although concentration differences existed in the room, risk levels near (1 m) and far (5 m) from the aerosol source were similar for certain singers. Modeling indicated infection risk levels of 70–100% after one hour; the risk would have been considerably reduced by wearing high-filtration respirators. Age and pre-existing comorbidities predicted more severe disease. The high incidence of illness may be partly attributed to the relatively high median age of individuals. Additionally, those admitted to the hospital had multiple underlying health conditions that predispose them to more severe disease.
Conclusions
Airborne transmission and indoor space can explain this mass exposure event. High-filtration respirators could have prevented some infections. The importance of safety distances diminishes the longer the indoor event. The concept of safety distance is challenging, as our study suggests that long range airborne transmission may occur in indoor events with extended duration. We encourage informing the public, especially persons at risk, of safety measures during epidemics.
#mask up#covid#pandemic#covid 19#wear a mask#public health#coronavirus#sars cov 2#still coviding#wear a respirator
8 notes
·
View notes
Note
(Me again! Previously I had bothered you in DMs about an article, but figured it might be better to send an ask in this case.)
On the topic of environmental concerns, I did have a question about James Hansen's 'Global Warming in the Pipeline' which was published last year. A previous (and rather bleak) Medium article you analyzed had cited this particular paper as proof that we're on track to exceed 3C in our lifetimes, even if emissions were to suddenly halt today.
https://pubs.giss.nasa.gov/abs/ha09020b.html
Since this paper has now passed peer review, what exactly does this mean in simplistic terms? I understand this means that the climate scientists that have analyzed the paper agree with what it states (and see no issues with it's logic), but does it actually mean we'll reach 4C by 2100? Or have I misunderstood what this is stating? The only way I see this not being the case is if somehow Hansen's paper later turns out to be incorrect (which seems unlikely).
I also understand that the paper heavily advocates for a level of geoengineering, which I think is a better alternative to letting a large majority of people suffer, but I'm not sure if you have any opinions on when you think that'd be best to do.
oooh, i've put off answering this because it's perhaps a bit above my pay grade, but let's see
so as far as passing peer review - it's hard to say how robust that is in terms of whether you should believe its conclusions. it depends a lot on the field, the reviewers, and so on - papers are retracted frequently, even if the initial round of reviewers advised to publish.
in climate science we are engaged in a spectacularly difficult modelling task. this paper also speaks on a pretty broad range of subjects. let me quote the full abstract, adding some paragraph breaks:
Improved knowledge of glacial-to-interglacial global temperature change yields Charney (fast-feedback) equilibrium climate sensitivity 1.2±0.3°C (2σ) per W/m2, which is 4.8°C±1.2°C for doubled CO2. Consistent analysis of temperature over the full Cenozoic era — including 'slow' feedbacks by ice sheets and trace gases — supports this sensitivity and implies that CO2 was 300-350 ppm in the Pliocene and about 450 ppm at transition to a nearly ice-free planet, exposing unrealistic lethargy of ice sheet models. Equilibrium global warming for today's GHG amount is 10°C, which is reduced to 8°C by today's human-made aerosols.
Equilibrium warming is not 'committed' warming; rapid phaseout of GHG emissions would prevent most equilibrium warming from occurring. However, decline of aerosol emissions since 2010 should increase the 1970-2010 global warming rate of 0.18°C per decade to a post-2010 rate of at least 0.27°C per decade. Thus, under the present geopolitical approach to GHG emissions, global warming will exceed 1.5°C in the 2020s and 2°C before 2050.
Impacts on people and nature will accelerate as global warming increases hydrologic (weather) extremes. The enormity of consequences demands a return to Holocene-level global temperature. Required actions include: (1) a global increasing price on GHG emissions accompanied by development of abundant, affordable, dispatchable clean energy, (2) East-West cooperation in a way that accommodates developing world needs, and (3) intervention with Earth's radiation imbalance to phase down today's massive human-made 'geo-transformation' of Earth's climate. Current political crises present an opportunity for reset, especially if young people can grasp their situation.
As I've split it, the first paragraph is a quantitative statement about equilibrium warming, which is the paper's scientific contribution. The second paragraph adds some qualifiers about the expected trajectory "under the present geopolitical approach". The third para is a political argument - a 'what is to be done' type statement.
That's a lot to cover in one paper! It also invites different kinds of approaches to peer review. A scientist reviewing the first half of this paper would be making a technical analysis: do Hansen et al look at the right data, analyse it rigorously, etc. etc.
Why is this all so complicated? Well, lots of things change on Earth when it gets hotter and colder. The amount of cloud coverage, the amount of ice, the way the oceans mix hot and cold water, etc. etc., the amount of dust and soot in the air from forest fires - all of this affects how much energy comes into the atmosphere, how much gets reflected into space, etc etc.
The main things that the paper talks about are...
the equilibrium climate sensitivity: basically, if you add a bunch of extra energy to the system (what climate scientists call 'forcing'), once everything settles down, what temperature do you end up at, per unit of forcing?
the speed of various feedbacks - how quickly the clouds, ice, etc. etc. change in response to the forcing, which determines how quickly you approach this final equilibrium temperature. Knowing which feedbacks are fast and slow is important since it tells us what we can expect to happen when we cut CO2 emissions.
It's naturally a pretty involved discussion and I don't pretend to have the background to follow all the ins and outs of it, but Hansen et al. use various lines of evidence to try to assess these parameters, see how they affect climate models, and the like. They perform an analysis of how temperature and estimated CO2 varied during the Cenozoic era, and there's a section on estimating the effects of aerosols, both natural and human-made.
On the subject of aerosols, Hansen et al. suggest that previous climate models may have made two mistakes that cancelled each other out:
Recent global warming does not yield a unique ECS [Equilibrium Climate Sensitivity] because warming depends on three major unknowns with only two basic constraints. Unknowns are ECS, net climate forcing (aerosol forcing is unmeasured), and ocean mixing (many ocean models are too diffusive). Constraints are observed global temperature change and Earth’s energy imbalance (EEI) [80]. Knutti [150] and Hansen [75] suggest that many climate models compensate for excessive ocean mixing (which reduces surface warming) by using aerosol forcing less negative than the real world, thus achieving realistic surface warming.
What they're saying here is, though we have a pretty good idea of how much CO2 we put in the atmosphere, since we don't have a good measure of aerosols we don't actually know for sure how much energy humans were adding to the atmosphere. Like, CO2 adds energy, but sulfur dioxide reflects it away.
There's three unknown parameters here, and two constraints (things we can calculate for definite). We use a model to tell us one of those unknowns (the ocean stuff), and that allows us to tune the effect of aerosols until our model Earth matches our measurements of the real Earth. But, if our ocean model is wrong, then we end up wrongly estimating the effect of aerosols.
The upshot is that aerosols have been a bigger deal than we thought, and as the world cleans up the atmsophere and removes the amount of aerosols, the rate of warming will increase. It's definitely plausible - but it's such a complicated system that there could easily be some other nuance here.
I won't try to summarise every point in the paper but it's that kind of thing that they're arguing about here. This isn't a mathematical proof, though! Since it's touching on a huge range of different parameters, trying to draw together lots of different lines of evidence, there is still a fair bit of room for nuance. It's not so simple as 'Hansen et al. are right' or 'Hansen et al. are wrong' - they could be wrong about one thing and right about another.
To say they've passed peer review is to say that they've done as reasonable a job as anyone can expect to try and figure out this kind of messy problem. However, other scientists may still take issue with one or another claim. It's not as definitive as a maths paper.
That said, Hansen's arguments all seem pretty plausible to me. The tools he uses to assess this situation are sensible and he talks about cases where things weren't as expected (he thought that improved climate models would change in a different way, and they didn't). But while I know enough about the subject to be able to largely follow what he's saying, I'm not confident saying whether he's right.
The second half takes on a different tone...
This section is the first author’s perspective based on more than 20 years of experience on policy issues that began with a paper [179] and two workshops [180] that he organized at the East-West Center in Hawaii, followed by meetings and workshops with utility experts and trips to more than a dozen nations for discussions with government officials, energy experts, and environmentalists. The aim was to find a realistic scenario with a bright energy and climate future, with emphasis on cooperation between the West and nations with emerging or underdeveloped economies.
So this is more of a historical, political analysis section, addressing why we are on this trajectory and why scientists may be institutionally underestimating the threat ('scientific reticence', 'gradualism' and so on). Well, more precisely, it's a polemic - a scientifically informed polemic, but this is basically an editorial stapled to the science part of the paper.
This includes an account of how a previous paper ('Ice Melt') led by Hansen was reviewed, and sidelined by other scientists, for what Hansen considers unsound reasons. It leads into something of an impassioned plea by Hansen addressed at his fellow scientists, complete with rhetorical questions:
Climate science reveals the threat of being too late. ‘Being too late’ refers not only to warning of the climate threat, but also to technical advice on policy implications. Are we scientists not complicit if we allow reticence and comfort to obfuscate our description of the climate situation? Does our training, years of graduate study and decades of experience, not make us well-equipped to advise the public on the climate situation and its policy implications? As professionals with deep understanding of planetary change and as guardians of young people and their future, do we not have an obligation, analogous to the code of ethics of medical professionals, to render to the public our full and unencumbered diagnosis? That is our objective.
This leads into Hansen's proposal for how to get out of this mess: a price on carbon dioxide, nuclear power, and rushing to research geoengineering such as spraying salt water in the air. And then e.g. specific political proposals, like 'a political party that takes no money from special interests', ranked choice voting and so on.
Naturally this is a lot harder to take technical issue with. It's more like an editorial. As a reviewer you'd probably say it's worth publishing because it's well argued, etc. etc., without necessarily agreeing with every one of Hansen's proposals. You can say 'that obviously wouldn't work' and so on, but it's a different kind of argument.
So re your questions:
does it actually mean we'll reach 4C by 2100?
If Hansen et al. are right, the IPCC reports are underestimating the equilibrium we approach for the current amount of CO2 in the atmosphere - which would lead to 2°C well before 2050, so 4°C by 2100 seems plausible (I didn't spot a timeline that goes that far in the paper when I skimmed through but I could have missed it).
This isn't the amount of warming that will happen, because the Earth has many systems which gradually scrub CO2 from the atmosphere. If we stopped pumping out CO2 suddenly, the amount of CO2, and the amount of extra energy it adds, would gradually decline. So we wouldn't necessarily approach that equilibrium. On the other hand, the amount of CO2 forcing is only going up as things currently stand - and if the amount of forcing stayed the same, Hansen says it would eventually deglaciate Antarctica, leading to over 10°C of warming.
But working out what will actually happen by 2100 depends on a lot of modelling assumptions - how long do you assume we keep pumping out CO2? Hansen addresses this when talking about the subject of 'committed warming':
‘Committed warming’ is less precisely defined; even in the current IPCC report [12] (p. 2222) it has multiple definitions. One concept is the warming that occurs if human-made GHG emissions cease today, but that definition is ill-posed as well as unrealistic. Do aerosol emissions also cease? That would cause a sudden leap in Earth’s energy imbalance, a ‘termination shock,’ as the cooling effect of human-made aerosols disappears. A more useful definition is the warming that will occur with plausibly rapid phasedown of GHG emissions, including comparison with ongoing reality. However, the required ‘integrated assessment models,’ while useful, are complex and contain questionable assumptions that can mislead policy (see Perspective on policy implications section).
So, will we reach 4C by 2100? We can only phrase this question in a conditional way: if we continue to add this much energy, then...
In practice we will probably end up reducing our emissions one way or another - which is to say, if our present complex societies collapse, they ain't gonna be emitting much carbon anymore...
I also understand that the paper heavily advocates for a level of geoengineering, which I think is a better alternative to letting a large majority of people suffer, but I'm not sure if you have any opinions on when you think that'd be best to do.
The way things are going, I think it's likely that people will try geoengineering when the climate-related disasters really start to ramp up, so whether or not they should ends up kind of besides the point.
Hansen doesn't really advocate a specific programme to pursue - only one paragraph in the whole paper talks about geoengineering:
Highest priority is to phase down emissions, but it is no longer feasible to rapidly restore energy balance via only GHG emission reductions. Additional action is almost surely needed to prevent grievous escalation of climate impacts including lock-in of sea level rise that could destroy coastal cities world-wide. At least several years will be needed to define and gain acceptance of an approach for climate restoration. This effort should not deter action on mitigation of emissions; on the contrary, the concept of human intervention in climate is distasteful to many people, so support for GHG emission reductions will likely increase. Temporary solar radiation management (SRM) will probably be needed, e.g. via purposeful injection of atmospheric aerosols. Risks of such intervention must be defined, as well as risks of no intervention; thus, the U.S. National Academy of Sciences recommends research on SRM [212]. The Mt. Pinatubo eruption of 1991 is a natural experiment [213, 214] with a forcing that reached [30] –3 W/m2. Pinatubo deserves a coordinated study with current models. The most innocuous aerosols may be fine salty droplets extracted from the ocean and sprayed into the air by autonomous sailboats [215]. This approach has been discussed for potential use on a global scale [216], but it needs research into potential unintended effects [217]. This decade may be our last chance to develop the knowledge, technical capability, and political will for actions needed to save global coastal regions from long-term inundation.
He says 'we need to research this more to figure out the risks, since we'll probably have to do it' basically. Climate researchers have historically been reluctant to advocate geoengineering for fear it will be mistaken as a way to solve the climate problem without reducing GHG emissions, so honestly seeing them suggest it now maybe brings to light the atmosphere of desperation in the field.
Unfortunately, when talking about politics and economics, Hansen is on much less firm ground than when he's picking apart the intricacies of climate feedbacks. He clearly wants to try to discourage doomerism, and he's rightly critical of cap-and-trade and similar schemes, but he has his specific political fixations and what he suggests is all a bit unconvincing as a programme. I don't say this because I've got a better idea, though.
The problem is that the future is really hard to predict. It's bad enough when it's climate systems, but humans are even more complicated little nonlinear freaks. This isn't a new problem for Hansen's paper. I am pessimistic enough by nature that I don't really trust my ability to predict what we will do when climate change gets more severe. Hopefully by the time we finally decide to stop kicking the can down the road, there will still be something to be done.
8 notes
·
View notes
Text

Best Regards
The Gravitational Waves Reflection In The Solar System
(Analytical Study) (Revised)
https://app.box.com/s/yx3tx5lsvwy4025p4j3mwfeliwhtka07
or
https://app.box.com/s/9wywdejkxqh7x4g791ntf3p3p01kkm8f
or
https://www.tumblr.com/itsgerges/759715471336570880/the-gravitational-waves-reflection-in-the-solar?source=share
or
https://gerges2022.livejournal.com/236389.html
Abstract
Paper question
How Is Planet Velocity Defined?
Paper Hypothesis No. (1)
The solar system is one energy moves in space and reflects 3 times - the points of the reflection are the planets- as a result- the planets are created depending one each other by this energy reflection.
The Explanation Of The Hypothesis No. (1)
I- Preface
Why do we need to define Planet velocity here? Because
Planet velocity definition disproves The Solar System Classical Description.
II- The hypothesis Explanation in details
1 The Energy Reflection Definition
2 The Energy Reflection Proves
3 The Energy Reflection Result
4 The Energy Reflection Objective
5 Saturn Creation Depends On Uranus And The Earth
Let's explain the previous items in following
I- Preface
Why do we need to define Planet velocity before any other discussion in this paper? Because Planet velocity disproves The Solar System Classical Description.
The classical description refutation is a great event because the theories depend on it and – that means- more than 12 theories are wrong in the modern physics book
Shortly- more than the half of the modern physics book provides imaginary ideas and wrong theories because the solar system classical description is wrong.
Let's see examples to explain that clearly
Example No. (1)
No Planet Moves By The Sun Gravity- Newton is wrong- I have proved this fact since long time- and I explained that- Planet moves by the force caused its creation- means- the planet creation and motion is done by one force only otherwise this planet would be broken- simply – if two forces have effects on the same planet it would be broken- means- the planet moves with its creation force- again No planet moves by the sun gravity-
The example shows a gap between the physics book and the solar system facts – Newton imaginary idea is believed by everyone since 400 years!
But- the example doesn't show how great the gap is- in fact the shock is coming from The Sun Nuclear Fusion Theory- let's see the next example
Example No. (2)
The Sun Is Created By The Planets Motions Energies–The Sun Is A Phenomenon
Here we can see the gap clearly
The solar planets were found in their orbits before the sun creation and the planets were revolving around a point in space (this point has no light)
The planet motion produces energy (1/2 mv^2) and this energy is stored in the space in waves form- the planets were revolving around this point for long periods till the stored motion energy in the space be massive energy-
From this massive motion energy the light beam is created (the sun rays is created)
The sun rays is created from this energy- that tells why the sun corona temperature is 5 millions Kelvin but the sun surface is 5800 Kelvin- simply- because The Sun Is Not Doing Nuclear Fusion To Produce Its Rays, the rays is created by the planets motions energies– The Sun Rays Show The Great Gap Between The Physics Book And The Facts
The wrong description is the reason behind the imaginary ideas and wrong theories in the physics book- one more example- the scientists won Nobel prize in physics for their discovery for the gravitational waves- these scientists told us – the gravitational waves are produced by the sun gravitational field which is NOT FACT– the gravitational waves are produced by Planet motion energy- where the planet moves and produces energy (1/2 mv^2) and the planet can't store its motion energy inside its body otherwise its temperature would be raised for that the planet motion energy is stored in the space In Waves Form- the scientists discovered these waves and they called them gravitational waves!! Let's provide one more example
Example No. (3)
The big bang theory tells us the planet creation is done by random process- in details- the theory tells–some planets are suffered from collisions and these collisions changed their diameters and masses- by that we can't know their original diameters and masses by that the current values of these diameters and masses are found by chance and without any geometrical reasons and should be considered random data-
For example- Jupiter diameter now is 142984 km but what's this diameter value in the first creation of Jupiter?
The big bang theory and all random creation ideas are wrong and nonsense- shortly- I have my planet diameter equation which proves Planet diameter is created based on a geometrical rule- means- for example- Jupiter diameter is created at first as 142984 km and never changed since its creation- if any planet had collision and changed its diameter this collision results would be recorded in this planet motion features- as happened with Mars- Mars original orbit was between Mercury and Venus and Mars had migrated to its current orbit- and Mars had collided with Venus and The Earth in its migration motion- but Mars diameter equation refers frequently to its original orbit features and data- that tells the planet motion provides a record for its history because all data is required for planet motion- by that – all data depends on geometrical rules and no random process is used in it –
let's introduce my planet diameter equation in following….
Planet Diameter Equation (v1/v2)= (s/r)= I
v = Planet Velocity and r = Planet Diameter
s= Planet Rotation Periods Number In Its Orbital Period
I= Planet Orbital Inclination (example, 1.8 degrees be produced as a rate 1.8)
v2, s, r and I are belonged to one planet and v1 is belonged to another planet
The planet (v1) is defined by test the minimum error
Earth Equation uses Neptune velocity
Mars Equation uses Pluto velocity
Jupiter Equation uses the Earth moon velocity
Saturn Equation uses Mars velocity
Uranus Equation uses Neptune velocity (As Earth)
Neptune Equation uses Saturn velocity
Pluto Equation uses the Earth moon velocity (As Jupiter)
(The Equation works from The Earth To Pluto) (the discussion explains the reason)
Example
Neptune Equation (89143 /49528) = 9.7/ 5.4 =1.8
89143 = Neptune rotation periods number in Neptune orbital period
49528 km = Neptune diameter
9.7 km/s = Saturn velocity
5.4 km/s = Neptune velocity
59800 days = Neptune orbital period (and Neptune rotation period =16.1 hours)
1.8 degrees = Neptune Orbital Inclination
The equation tells planet diameter is created based on its velocity –means- Neptune diameter is 49528 km because Neptune velocity is 5.4 km/s
The Equation Concept
Planet diameter should be a function in its orbital distance –otherwise- this planet would be broken by its motion- the fact is that – The necessary requirement for planet safe motion is to create a function between this planet diameter and its orbital distance
BUT- the designer can't create a function has only 2 variables (Planet diameter and its orbital distance)- the function in this case can't be useful because – If this planet changes its orbital distance its diameter would be broken also because the diameter is a direct function in the orbital distance without any other variables -As A Result
The designer created the planet diameter as a function in this planet rotation period and the planet rotation period is created as a function in this planet velocity and the planet velocity is created as a function in this planet orbital distance- by that- the function between the planet diameter and its orbital distance is created but the function contains also more variables (rotation period, orbital period and velocity)- by that- if the planet changes its orbital distance- this planet diameter will not be changed but its rotation period, orbital period, and velocity will be changed and the diameter will be saved-
NOTICE-Mars is the example for this theory because Mars original orbit was between Mercury and Venus and Mars had migrated from its original orbit to its current one- after Migration Mars changed its motion data but the diameter is saved
NOTICE- Planet diameter equation is very useful to analyze the energy reflection in the solar system because the equation shows the changes in data resulting from the energy reflection- for example- the equation produces the planet orbital inclination-but in Saturn equation- the equation produces the value (0.4) while we know Saturn orbital inclination is 2.5 degrees- the value (0.4) is produced because the energy is reflected in Saturn and that caused effect on the data by that the value (2.5) become (1/2.5) = 0.4- that's why I refer to my planet diameter equation in this discussion because the equation can work as a tool of anatomy which can see clearly what's happening for the energy in each planet-
Matter Definition
My planet diameter equation provides a new definition for the matter – this definition is found to answer the question- (How Can Planet Velocity And Motion Be Defined Before This Planet Creation?)
What's The Matter And How Is Created?
The matter and space are created from the same one energy and both move with the motion of this energy from which they are created- but- the matter creates for itself a distinguish form and moves by different velocity from the space motion (notice the gravitational waves prove the space has motion and not static).
This is similar to the sea of water- the space is similar to the sea of water and the matter is similar to a whirlpool (vortex) found on the sea page-
The whirlpool (vortex) is created by the sea water and it's carried by the sea water motion- spite of that- the whirlpool is different in its form from the sea waves – also the whirlpool moves by different velocity from the sea waves motion velocity- this example gives explanation for the matter definition- the matter is similar perfectly to the whirlpool on the sea page- it's created by the sea water motion but it has a distinguish form and different velocity from the sea waves-
Also
The whirlpool dimensions depend on the sea water motion features- for example – we have a whirlpool its diameter is 2 meters, this diameter is formed by the sea water motion features (the water velocity- amount-pressure -……etc) that tells the whirlpool is found later after the sea creation- and the water motion is found before the whirlpool creation- this meaning is a fact for the matter creation and dimensions- the matter dimensions are created based on this matter motion- means- the motion is defined before the matter creation- this is proved strongly by my planet diameter equation- the equation tells (for example) Neptune diameter is 49528 km because Neptune velocity is 5.4 km/s- the whirlpool idea explains how the planet matter data is defined based on its motion- because
The original energy was found in motion at first and the planet matter is created from this moving original energy and the planet matter dimensions are defined by this original energy motion features- after the planet creation, the planet moves with this original energy motion means the planet moves this same motion based on which the planet data is created that's why the planet data is in full harmony with the planet motion features.
Also the idea shows the planet motion reason- as I proved before- no planet moves by the sun gravity- Newton is wrong- because the planet creation and motion are done by one force only otherwise this planet would be broken if two forces have effects on it
Here we see the planet motion reason- the planet moves with the original energy from which this planet is created-
What's the original energy?
The original energy is one light beam energy- because – the solar planets and their distances are created from one energy and this energy is provided by one light beam –means – the planets are geometrical points found on the same one light beam and the planets move with this light beam motion-
By that the planets are similar to carriages in one train and the light beam is this train engine- the light motion causes all planets motions
NOTICE - this definition of the matter and planet is very important for our discussion because the paper hypothesis no. (1) tells – the solar system is one energy moves in the space and reflected on some points and these points are the planets- the reflection of energy discussion will show how each planet data and motion depend on the other planet motion by the energy reflection effect- shortly- (The Planet Is A Geometrical Point) this idea is the best one can explain the energy reflection data- by that we can understand how the energy motion and reflection can effect on the planet creation and motion- the energy reflection discussion is found in the paper first hypothesis explanation.
Planet Velocity Definition
Again let's ask ……Why Do We Need To Define The Planet Velocity? ……….
Because – the planet velocity definition refutes the solar system classical description- the definition proves the planet is a geometrical point on the moving energy (and refute the classical definition tells – planet is a solid body created independently from the space and other planets) – in fact the planets are created depending on each other – The 9 planets are as 9 knots or snarls on the same one rope or cable – No planet is created independently– also all of them are created by the same one motion and the same one reason- (imagine you have a ladder or stairs is consisted of 9 units- all units are similar and found for the same reason)- the data proves this fact also
Planet velocity definition provides a powerful proof against Newton theory of the sun gravity-No Planet Motion Depends On Its Mass- Newton is wrong- the velocity Definition Doesn't Refer To Planet Mass- Also planet velocity definition provides a direct strong proof for the energy reflection in the solar system- also – the velocity definition explains the complex machine behind the planet motion which refutes again the naïve idea of Newton about this motion-
The planet velocity definition shows the general design of the solar system where all planets data is defined based on its velocity- means- the planet velocity is defined at first (after the orbit definition) and all other data is defined based on this velocity as we have seen the planet diameter is defined by the rate (v1/v2) by my planet diameter equation and planet orbital distance is defined by the rate (v1/v2)^2 and planet orbital period is defined by the rate (v1/v2)^3- shortly- the motion is the planet life
SHORTLY
I refute the solar system classical description and I wanted to put a piece of strong proof in the first pages of my paper to show that the refutation doesn't depend on ideas or logical analysis- but the refutation depends on the contradiction between the physics theories and the planets creation & motion data- If the contradiction is proved that tells the description is wrong because the planets data can NOT be wrong
Let's start our discussion
How is planet velocity defined?
Kelper stated, planet orbit defines its velocity, this rule is proved by the equation (v1/v2)^2=(d2/d1) where (d= planet orbital distance) and (v= planet velocity)
BUT
How Is The Planet Velocity Defined? And By What Rules?
Planet velocity is defined by Three Rules let's see them in following
(i) First Rule
v1v2 = constant= 322 (my 5th equation)
47.4 km/s (Mercury velocity) x 6.8 km/s (Mercury velocity) =322
35 km/s (Venus velocity) x 4.7 km/s (Pluto velocity) x 2 =322
29.8 km/s (The Earth velocity) x 5.4 km/s (Neptune velocity) x 2 =322
24.1 km/s (Mars velocity) x 13.1 km/s (Jupiter velocity) =322
(Max error 2%)
The rule (v1v2=322) tells the velocities are defined in pairs and not individually, each planet velocity has its own complementary- the rule tells the velocities are reflected on one another- the reflection of energy and data will be studied in details in planet velocity discussion-
In this rule we interest for the constant (322)- let's ask- why the constant = 322?
The constant 322 depends on the speed 1.16 million km per second because
(1160000 seconds = 322 hours) - Means
Mercury (47.4 km/s) moves in 6.8 hours a distance = 1.16 million km and
Uranus (6.8 km/s) moves in 47.4 hours a distance = 1.16 million km
Shortly -we realize that the constant 322 is produced based on the speed 1.16 million km per second- means- the planets velocities are complementary each other because they are defined as functions in this same speed 1.16 million km per second
(This is similar to electron and positron are produced from Gamma ray, The two particles depend on Gamma energy in their masses)
Based On This Data
I concluded there's a light beam its speed 1.16 million km per second and from this light beam energy the solar system is created- and the planets velocities are defined as functions in this speed 1.16 million km per second and that causes the velocities to be complementary each other-
(Please note the speed 1.16 million km per second is proved strongly by other data in my paper specially because the light created the space at first before any planet creation by that all distances in the solar system are created by the energy of this light beam and its speed 1.16 million km per second is registered in the data)
(ii) Second Rule
v1v2 = 1
The velocity here uses the solar day (86400 seconds) – let's prove that-
Mercury moves per solar day = 4.095 million km
Venus moves per solar day = 3.024 million km
The Earth moves per solar day = 2.574 million km
The Moon moves per solar day = 2.4 million km
Mars moves per solar day = 2.082 million km
Jupiter moves per solar day = 1.1318 million km
Saturn moves per solar day = 0.838 million km
Uranus moves per solar day = 0.5875 million km
Neptune moves per solar day = 0.4665 million km
Pluto moves per solar day = 0.406 million km
AND
0.406 (Pluto velocity) x 2.4 (the moon velocity) = 1 (error 2.5%)
0.4665 (Neptune velocity) x 2.082 (Mars velocity) = 1 (error 2.5%)
0.5875 (Uranus velocity) x 3.024 (Venus velocity)/1.772 = 1 (error 2.5%)
0.838 (Saturn velocity) x 1.1318 (Jupiter velocity) = 1 (error 5%)
(1.772 = π^1/2)
The second rule tells very similar meaning (v1v2= constant= 1)
The data uses the velocities per solar day for that the constant is changed from 322 into 1 but the rule is the same- (v1v2= Constant)
I want to say- the rule (v1v2 = Constant) tells a clear idea that (The Velocities Are Reflected On Each Other) this conclusion is simple one (A x 1/A= constant=1)
The rule proves the energy is reflected in the solar system and this reflection has effect on the planets data and for that the planets velocities are defined by this energy reflection and the velocities are produced complementary each other as a result.
Notice
The second rule causes confusion because the complementary player is changed- for example Pluto is complementary with Venus (in the first rule 35 x 4.7 x 2 = 322) but Pluto is complementary with the Earth moon in the second rule (0.406 x 2.4 = 1) that tells the players are changed which is illogical idea- how can we solve this problem?
The third rule solves it – let's see this rule in following
(iii) Third Rule
v1/v2 = 0.8 (based on the planets order)
47.4 km/s (Mercury velocity) x 0.8 = 38 (35 km/s = Venus velocity error 7.25%)
35 km/s (Venus velocity) x 0.8 = 27.78 (The moon velocity)
29.8 km/s (The Earth velocity) x 0.8 = 24.1 (Mars velocity) (error 1%)
24.1 km/s (Mars velocity) x 0.8 = 2 x 9.7 (Saturn velocity)
13.1 km/s (Jupiter velocity) x 0.8 = 2 x 5.4 (Neptune velocity) (error 3%)
6.8 km/s (Uranus velocity) x 0.8 = 5.4 (Neptune velocity)
5.4 km/s (Neptune velocity) x 0.8 = 4.3 (Pluto velocity 4.7 the error 7.25%)
Please note
The error 7.25 is found by the rate 1.0725 – that means
47.4 km/s (Mercury velocity) x 0.8 = 38 = 1.0725 x 35 km/s (Venus velocity)
5.4 km/s (Neptune velocity) x 0.8 = 4.3= 4.7 km/s (Pluto velocity) / 1.0725
29.8 km/s (Earth velocity) = 27.78 km/s (The moon velocity) x 1.0725
We know the rate 1.0725 is found by Lorentz length contraction effect- and we know this rate has effect on around 40% of all planets data – that's why we see this rate has effect on the planets velocities definition-
Let's remember the question-
In the rule (v1v2=322) we found that Pluto is complementary with Venus because
4.7 km/s (Pluto velocity) x 35 km/s (Venus velocity) x 2 = 322
But in the rule (v1v2 =1) we found Pluto is complementary with the moon because
0.406 mkm (Pluto Velocity Daily) x 2.4 mkm (The Moon Velocity Daily) = 1
The question asked – if the planets velocities are defined in pairs complementary each other and not individually how can the players be changed?
The answer tells – the planets velocities are rated by (0.8) based on the planets order means – the moon velocity daily 2.4 mkm = Venus velocity daily 3.024 mkm x 0.8
The rate (0.8) defines all planets velocities depend on each other by order-
Now let's see Planet velocity final definition – because- the definition uses three planets velocities together and not only two – let's put that clearly in following-
(iv) The Planet Velocity Final Definition
(A)
47.4 km/s (Mercury velocity) x 0.8 = 38 km/s (Venus velocity 35 km/s)
Venus moves per solar day 3.024 million km -But
1/3.024 = 0.3307 million km = Uranus moves per solar day 0.5875 million km /1.77
(note 1.77 = π^1/2) and (38 = 35 x 1.0725)
For that
47.4 km/s (Mercury velocity) x 6.8 km/s (Uranus velocity) = 322
(B)
35 km/s (Venus velocity) x 0.8 = 27.78 km/s (The Moon velocity)
The moon moves per solar day 2.4 million km -But
1/2.4 = 0.406 million km = Pluto moves per solar day 0.406 million km
For that
35 km/s (Venus velocity) x 4.7 km/s (Pluto velocity) x 2 = 322
(C)
29.8 km/s (The Earth velocity) x 0.8 = 24.1 km/s (Mars velocity)
Mars moves per solar day 2.082 million km -But
1/2.082 = 0.4665 million km = Neptune moves per solar day 0.4665 million km
For that
29.8 km/s (The Earth velocity) x 5.4 km/s (Neptune velocity) x 2 = 322
(D)
13.1 km/s (Jupiter velocity) x 0.8= 2 x 5.24km/s (Neptune velocity 5.4 km/s error 3%)
Neptune moves per solar day 0.4665 million km - But
1/0.4665 = 2.082 million km = Mars moves per solar day 2.082 million km
For that
13.1 km/s (Jupiter velocity) x 24.1 km/s (Mars velocity) = 322
Shortly
Three planets velocities are defined in each equation- that tells the planet velocity definition is a process more complex than the simple equation (v1v2= constant)
Notice
The 9 planets velocities total is 176 km/s – if we add the Earth moon velocity (29.8 km/s) the total will be 205.8 km/s
The planets velocities are complementary also for this velocity 205.8 km/s – let's see
205.8 km/s = Mercury velocity (47.4 km/s) x Pluto velocity (4.7 km/s) / 1.0725
205.8 km/s = Venus velocity (35 km/s) x Neptune velocity (5.4 km/s) x 1.0725
205.8 km/s = Earth velocity (29.8 km/s) x Uranus velocity (6.8 km/s)
205.8 km/s = Jupiter velocity (13.1 km/s) x Neptune velocity (5.4 km/s) x 3
Mercury velocity = 2 Mars velocity by that Pluto will be used for Mars also
Max error (3%)
Please Note- Saturn is exceptional because
205.8 km/s = 9.7 km/s (Saturn velocity) x 21.4
Where 21.4 hours = 2 x 10.7 hours (Saturn rotation period)
Means- the distance is passed by all planets motions in one hour equal the distance is passed by Saturn in 2 rotation periods (21.4 hours) that tells more analysis is required for Saturn velocity- as we should do later.
(v)
A Question (Why Is The Rate (0.8) Used To Define Each Planet Velocity Based On Its neighbor?)
Kepler stated (Planet orbit defines its velocity) and
My planet orbital distance equation proves each planet orbit is defined based on its neighbor – means- my equation uses only 2 neighbor planets orbital distances
Here also-Planet velocity is defined based on its neighbor – means- this connection enabled Kepler to conclude his statement (Planet orbit defines its velocity)
But Why The Rate (0.8)??
The rate (0.8) is found by the energy reflection effect on Planets velocities definition, for that we need to analyze the energy reflection process deeply to see how the planet velocity is defined by it - The energy reflection process is discussed deeply in the first hypothesis explanation- let's start its discussion in following…
II- The Hypothesis Explanation In Details
Let's remember the paper first hypothesis
The solar system is one energy moves in space and reflects 3 times - the points of the reflection are the planets- as a result- the planets are created depending on each other by this energy reflection.
In following we discuss the energy reflection process in details because the planet velocity definition proves the planets data is reflected on each other and we here try to see as deep as possible how this reflection process is done – the discussion is divided into 5 items which are
Item No. 1 The Energy Reflection Definition
Item No. 2 The Energy Reflection Proves
Item No. 3 The Energy Reflection Result
Item No. 4 The Energy Reflection Objective
Item No. 5 Saturn Creation Depends On Uranus And The Earth
Let's start our discussion in following
Item No. 1 The Energy Reflection Definition
Here we define the reflection of energy – let's do that in following
The solar system is one energy- this energy moves through the space- we can imagine this energy as a light beam or electromagnetic wave- and- the data tells this energy is reflected- let's suppose this energy is reflected from the point (A) to the point (B)- now- these points (A and B) are planets in the solar system-
That tells, the planet is a point in space on which the energy is reflected- it's difficult to accept such strange idea- BUT
The planets data is more strong than our evaluation- we will see that- the planets data is created by the reflection of energy- this fact is proved strongly and doubtless-
For that I analyze the reflection of energy process in details because by this process the planets are created and the energy cycle is completed- for that – we examine the reflection of energy deeply - Now- let's define the energy reflection in following
(i)
The energy is reflected three times in the solar system- from Pluto to Neptune (1st reflection) and from Uranus to Jupiter (2nd reflection) and from Venus to Mars (3rd reflection)
The first and second reflections are unified and work together as one reflection only (later will explain why) - by that – the solar system has 2 basic reflections- the reflection in the outer planets and the reflection from Venus and Mars
(ii)
The reflection of energy is proved strongly because the planets data are changed as a result- let's write these changes in following
v What's used as (A) before the reflection will be used as (1/A) after the reflection.
v What's used as (a distance) before the reflection will be used as (a period of time) after the reflection
v The velocities be squared –the rate (v1/v2) before reflection will be (v1/v2)^2 after the reflection.
v The energy direction is changed by the reflection usually
v The players of the rates of time are reflected also –
These changes are found in all reflections of energy- that's why the proof is powerful and can't be refuted because the planets data shows the reflection process details
(iii)
Let's see the changes in the planets data generally
(Venus reflection)
By this reflection of energy Venus orbital circumference 680 million km will be used as Mars orbital period 687 days and it defines Jupiter orbital period (4331 days = 2π x 687 days) and also Saturn orbital period (10747 days = 4π x 687 days x (1/0.8)) where Uranus orbital inclination (0.8 degrees) creates effect on Saturn data
AND
Venus Orbital Period 224.7 days be used as 227.9 million km (Mars orbital distance)
AND
Also the reflection defines the planets diameters by that
Venus circumference 38025 km = Mars Circumference 21346.6 km x 1.772
(π=3.14159= 1.772^2) (more data about this reflection is discussed later)
(The Outer Planets Reflection)
The reflection is done by Jupiter to Uranus, by that, Jupiter orbital circumference 4900 million km will be used as Uranus orbital period 30589 days where (30589 days = 4900 days x 2π and Neptune orbital period 59800 days = 4900 days x 4π and Pluto orbital period 90560 days = 4900 days x 6π
Notice- the reflection in the outer planets depends basically on Saturn and it's more complex than this simple data but I put similar data for comparison and later we will discuss the details
ALSO
The energy reflection at Venus passes above the Earth to Mars- where the Earth moon suffers from the length contraction effect and its motion distance daily is 2.4 mkm = 2.574 mkm (The Earth motion distance daily) / 1.0725
Similar to that
The energy reflection at Jupiter passes above Saturn to Uranus – Where
Saturn suffers from the length contraction effect because
1433 million km (Saturn orbital distance) x 1.0725 = 2 x 778.6 million km (Jupiter orbital distance) - And- the Earth moon daily displacement is 88000 km and during 10747 days the total be 940 million km=The Earth orbital circumference (where 10747 days = Saturn orbital period)
The previous data shows the reflection energy effect generally- it's important because it compares the data in two different groups and proves the data behaviors are similar- that proves these behaviors are caused by the same one cause-
But we will analyze each reflection in more details to see how each data is created (CONT)
Gerges Francis Tawdrous +201022532292
Physics Department- Physics & Mathematics Faculty
Peoples' Friendship university of Russia – Moscow (2010-2013)
Curriculum Vitae https://www.academia.edu/s/b88b0ecb7c
E-mail [email protected], [email protected]
[email protected]
ORCID https://orcid.org/0000-0002-1041-7147
Facebook https://www.facebook.com/gergis.tawadrous
VK https://vk.com/id696655587
Tumblr https://www.tumblr.com/blog/itsgerges
Researcherid https://publons.com/researcher/3510834/gerges-tawadrous/
Google https://scholar.google.com/citations?user=2Y4ZdTUAAAAJ&hl=en
Livejournal https://gerges2022.livejournal.com/profile
Pocket https://getpocket.com/@646g8dZ0p3aX5Ad1bsTr4d9THjA5p6a5b2fX99zd54g221E4bs76eBdtf6aJw5d0?src=navbar
PUBLICATIONS
box https://app.box.com/s/47fwd0gshir636xt0i3wpso8lvvl8vnv
Academia https://rudn.academia.edu/GergesTawadrous
List of publications http://vixra.org/author/gerges_francis_tawdrous
Slideshare https://www.slideshare.net/Gergesfrancis
#space weather#seismology#earthquakes#sun#solar flare#earth atmosphere#magnetic field#magnetism#geomagnetism#aerosol emission#energy#electricity#electromagnetism#geomagnetically induced currents#science#earthquake forecast
2 notes
·
View notes
Text

New NASA Study Tallies Carbon Emissions From Massive Canadian Fires
Extreme wildfires like these will continue to have a large impact on global climate.
Stoked by Canada’s warmest and driest conditions in decades, extreme forest fires in 2023 released about 640 million metric tons of carbon, NASA scientists have found. That’s comparable in magnitude to the annual fossil fuel emissions of a large industrialized nation. NASA funded the study as part of its ongoing mission to understand our changing planet.
The research team used satellite observations and advanced computing to quantify the carbon emissions of the fires, which burned an area roughly the size of North Dakota from May to September 2023. The new study, published on Aug. 28 in the journal Nature, was led by scientists at NASA’s Jet Propulsion Laboratory in Southern California.
They found that the Canadian fires released more carbon in five months than Russia or Japan emitted from fossil fuels in all of 2022 (about 480 million and 291 million metric tons, respectively). While the carbon dioxide (CO2) emitted from both wildfires and fossil fuel combustion cause extra warming immediately, there’s an important distinction, the scientists noted. As the forest regrows, the amount of carbon emitted from fires will be reabsorbed by Earth’s ecosystems. The CO2 emitted from the burning of fossil fuels is not readily offset by any natural processes.
An ESA (European Space Agency) instrument designed to measure air pollution observed the fire plumes over Canada. The TROPOspheric Monitoring Instrument, or TROPOMI, flies aboard the Sentinel 5P satellite, which has been orbiting Earth since 2017. TROPOMI has four spectrometers that measure and map trace gases and fine particles (aerosols) in the atmosphere.
The scientists started with the end result of the fires: the amount of carbon monoxide (CO) in the atmosphere during the fire season. Then they “back-calculated” how large the emissions must have been to produce that amount of CO. They were able to estimate how much CO2 was released based on ratios between the two gases in the fire plumes.
“What we found was that the fire emissions were bigger than anything in the record for Canada,” said Brendan Byrne, a JPL scientist and lead author of the new study. “We wanted to understand why.”
Warmest Conditions Since at Least 1980
Wildfire is essential to the health of forests, clearing undergrowth and brush and making way for new plant life. In recent decades, however, the number, severity, and overall size of wildfires have increased, according to the U.S. Department of Agriculture. Contributing factors include extended drought, past fire management strategies, invasive species, and the spread of residential communities into formerly less developed areas.
To explain why Canada’s fire season was so intense in 2023, the authors of the new study cited tinderbox conditions across its forests. Climate data revealed the warmest and driest fire season since at least 1980. Temperatures in the northwest part of the country — where 61% of fire emissions occurred — were more than 4.5 degrees Fahrenheit (2.6 degrees Celsius) above average from May through September. Precipitation was also more than 3 inches (8 centimeters) below average for much of the year.
Driven in large part by these conditions, many of the fires grew to enormous sizes. The fires were also unusually widespread, charring some 18 million hectares of forest from British Columbia in the west to Quebec and the Atlantic provinces in the east. The area of land that burned was more than eight times the 40-year average and accounted for 5% of Canadian forests.
“Some climate models project that the temperatures we experienced last year will become the norm by the 2050s,” Byrne said. “The warming, coupled with lack of moisture, is likely to trigger fire activity in the future.”
If events like the 2023 Canadian forest fires become more typical, they could impact global climate. That’s because Canada’s vast forests compose one of the planet’s important carbon sinks, meaning that they absorb more CO2 from the atmosphere than they release. The scientists said that it remains to be seen whether Canadian forests will continue to absorb carbon at a rapid rate or whether increasing fire activity could offset some of the uptake, diminishing the forests’ capacity to forestall climate warming.
IMAGE: An astronaut aboard the International Space Station photographed wildfire smoke from Nova Scotia billowing over the Atlantic Ocean in May 2023. Warm weather and lack of rain fueled blazes across Canada last year, burning 5% of the country’s forests. Credit: NASA
4 notes
·
View notes
Text
Ocean waves crashing on the world’s shores emit more PFAS into the air than the world’s industrial polluters, new research has found, raising concerns about environmental contamination and human exposure along coastlines.
The study measured levels of PFAS released from the bubbles that burst when waves crash, spraying aerosols into the air. It found sea spray levels were hundreds of thousands times higher than levels in the water.
The contaminated spray likely affects groundwater, surface water, vegetation, and agricultural products near coastlines that are far from industrial sources of PFAS, said Ian Cousins, a Stockholm University researcher and the study’s lead author.
“There is evidence that the ocean can be an important source [of PFAS air emissions],” Cousins said. “It is definitely impacting the coastline.”
PFAS are a class of 15,000 chemicals used across dozens of industries to make products resistant to water, stains and heat. Though the compounds are highly effective, they are also linked to cancer, kidney disease, birth defects, decreased immunity, liver problems and a range of other serious diseases.
They are dubbed “forever chemicals” because they do not naturally break down and are highly mobile once in the environment, so they continuously move through the ground, water and air. PFAS have been detected in all corners of the globe, from penguin eggs in Antarctica to polar bears in the Arctic.
continue reading
The seafood you eat is filled with PFAS, as is the water you drink and the air you breathe.
5 notes
·
View notes
Note
can't climate change easily be solved with infrastructure projects like sea walls that the dutch have
with sea walls? uh. i don't think there's enough concrete to build a sea wall across every coastline on earth. and lots of places it wouldn't matter--if you're building on porous limestone, it will just seep up through that. and then you get other effects--you will note that concrete sea walls do not occur in nature, and you're going to massively alter erosion patterns and increase your vulnerability to tsunamis.
sea level rise is only one part of the concern around climate change anyway. increased desertification, rendering currently densely populated regions far less habitable, droughts and flooding resulting from shifting weather patterns, destruction of property due to wildfires, and negative impacts on food production are all going to occur to some extent or another.
if the amount of carbon in the atmosphere gets really high, the severity of these effects will not scale in a simple proportional manner to the amount of warming. carbon sinks like the amazon may cease to function, ocean currents may be altered, ocean acidification may alter marine habitats so much that specific industries like fishing are severely affected.
at a certain point it will make economic sense to bite the bullet and engage in geoengineering projects like injecting aerosols into the upper atmosphere--these projects may have negative environmental effects (like acid rain in the case of sulfur aerosols), but they will be less than the climate continuing to heat up. unfortunately these would be stopgap measures only: problems like ocean acidification aren't going to be affected at all. if co2 levels get too high human brain function starts to be affected.
there really is no long term solution for the problems caused by co2 emissions other than there being less co2 in the atmosphere. because carbon capture technology is still not very sophisticated, this means our best bet, by far, is to just not emit that co2 in the first place. personally i think good ol' nuclear power shows promise--modern technology can make it pretty darn clean and safe! even if we ultimately want to switch to other energy sources, fission is a good transitional option while we flesh out those technologies. continuing to burn coal (the stopgap a lot of anti-nuclear types seem to prefer) is not.
24 notes
·
View notes
Text
There is a price for all of this car usage, of course. For one thing, roughly 17% of global greenhouse gas emissions come from automobiles alone. And building road infrastructure means felling trees and destroying wild areas. Asphalt, with which most roads are paved, generates its own organic aerosol pollution, according to a Harvard study; the same asphalt then keeps cities hot at night in the summer, raising air conditioning costs in places like Phoenix. Worse, some American cities' land use consists of as much as 14% asphalt, thanks to poor planning and low density.
9 notes
·
View notes
Text
Chemistry behind the aroma of the sea
🌊✨ The mesmerizing scent of the sea! That distinct salty and tangy aroma near the coastline comes from Dimethyl sulfide (DMS), the ocean's signature fragrance! It's produced by microscopic algae in the ocean and released when marine organisms decay. The crashing waves create aerosols, allowing us to experience this iconic "oceanic aroma." DMS is the primary volatile sulfur compound emitted by the ocean, accounting for 95% of marine sulfur emissions. It even plays a role in combating greenhouse effects, impacting Earth's climate. Dive into the enchanting scent of the sea! 🌊
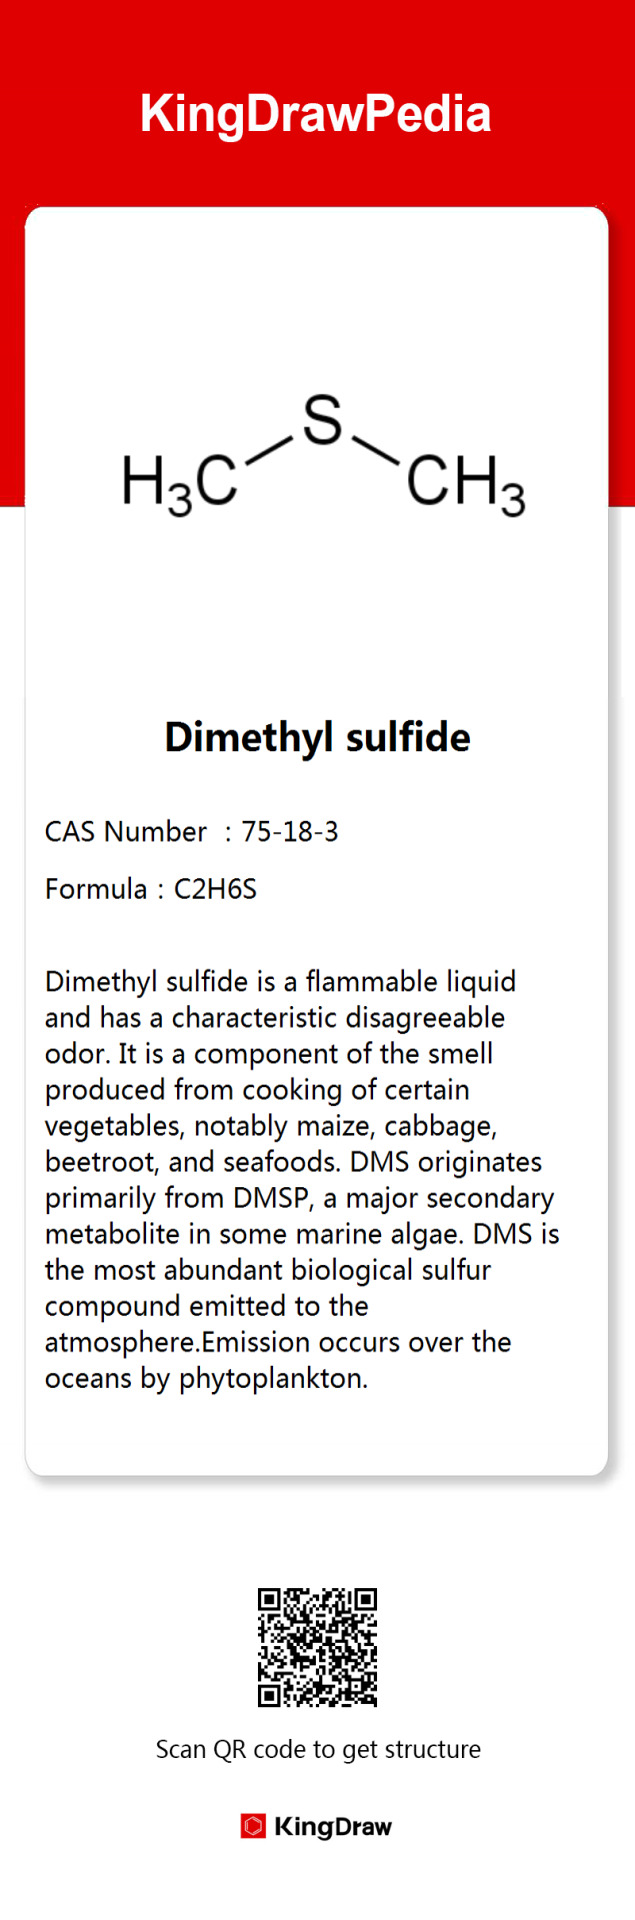
#sea#ocean#aroma#scent#organic chemistry#ochem#chemblr#stem studyblr#science#chemistry#molecule#did u know
27 notes
·
View notes
Last Seen Blogs

beatscriativos
Sem título

illbefinealonereads
illbefinealone reads

magicalpersonamoneyzonk-blog
Sebastiánfit.09

musicistheair-blog
Music Is The Air

oneguardian15
please tap on the glass (gently tho)