#arcgis web map
Explore tagged Tumblr posts
Visit Tumblr Blog
Explore Tumblr blogs with no restrictions, modern design and the best experience.
Last Seen Tumblr Blogs


Fun Fact
Tumblr Inc. is funded by 13 investors.
Text
Geoserver: A comprehensive overview of Spatial datasets and web services
GeoServer is open-source software for sharing, processing and creating web services for geospatial data. It plays a vital role in geospatial information systems (GIS) and web mapping applications.
Here's a comprehensive view of Geoserver-
Geospatial Data Support: GeoServer handles diverse geospatial formats, encompassing both vector and raster data.
Web Service Standards: It complies with web service standards like WMS, WFS, WCS, and WMTS, facilitating geospatial data sharing and web visualization.
WMS (Web Map Service): It serves customizable maps (PNG, JPEG) with dynamic rendering based on user requests.
WFS (Web Feature Service): WFS enables querying, retrieval, and editing of geographic features, allowing vector data access and manipulation.
WCS (Web Coverage Service): GeoServer distributes raster data (e.g., GeoTIFF or NetCDF) via WCS, facilitating user access to coverage data.
WMTS (Web Map Tile Service): It supports WMTS for efficient pre-rendered map tiles in a consistent grid, enhancing web mapping application performance.
RESTful Services: Ita offers a RESTful API for developers and custom apps to access geospatial data and services via HTTP requests.
Data Styling and Symbology: Users can customize data layer styles with GeoServer using the flexible Styled Layer Descriptor (SLD) standard.
Security and Access Control: GeoServer secures data and services through access control, supporting authentication and authorization to restrict access to authorized users.
Data Reprojection: GeoServer on-the-fly reprojection serves data in various coordinate reference systems (CRS) to meet client needs
Data Versioning and Publication: GeoServer supports dataset versioning for data integrity and history tracking.
Community and Ecosystem: GeoServer boasts a vibrant user community offering support, docs, and plugins for extended functionality
Scalability: GeoServer is versatile, suiting single servers to distributed setups, effectively managing high data volumes and requests.
Interoperability: GeoServer is compatible with GIS software and can be combined with tools like QGIS, OpenLayers, and Leaflet.
Extensibility: Extensible via plugins and custom code for added functionality and data format support.
GeoServer is a powerful tool for organizations and developers looking to share and publish geospatial data on the web and build web mapping applications.
0 notes
Text
Seri Bluff: Menguasai QGIS Desktop 3.34.x LTR.
Dapatkan harga Video Tutorial "Seri Bluff: Menguasai QGIS Desktop 3.34.x LTR" hanya Rp. 99.000,- ( Harga asli Rp. 279.000). Hanya berlaku 5 hari sampai 21/02/2025
#attribute query#select by attribute#feature info#opensource#gis operator#geodatabase#spatial query#select by location#location allocation#location intelligence#location based services#gis#geoserver#arcgis#esri#openlayers#wms#wfs#web mapping#leaflet#shapefile#qgis#geonode#freelancer#gis analyst#gis jobs#webgis#development#gis professional#project management
0 notes
Text
Data survey lapangan dalam UTM dapat di kelola dengan baik menggunakan QGIS.
Data tabular survey lapangan yang di lengkapi dengan titik koordinat UTM zone 47 N dapat di plot ke atas aplikasi QGIS dimana sebaran data ini akan tampil dan memudahkan dalam analisis spasial, pemodelan spasial dan pengambilan keputusan. Dapatkan video tutorialnya disini:
#attribute query#select by attribute#feature info#opensource#gis operator#geodatabase#spatial query#select by location#location allocation#location intelligence#location based services#gis#geoserver#arcgis#esri#openlayers#wms#wfs#web mapping#leaflet#shapefile#qgis#geonode#freelancer#gis analyst#gis jobs#webgis#development#gis professional#project management
0 notes
Text
engaging and educational things to do on the web :)
ArcGIS StoryMaps - informative, presents maps with spatial GIS data on numerous topics from various organizations in a scrollable format (best on desktop). we really enjoyed For the Birds :)
United States Botanic Garden Virtual Tour - 360 degree view of various parts of the U.S. Botanic Garden, indoors and outdoors, also includes links to video tours (youtube)
National Museum of Natural History Virtual Tour - includes permanent, current, and past exhibits, narrated tours, and more!
Van Gogh Museum: Enjoy the Museum From Home - high quality views of Gogh’s paintings, 4k video tour (youtube), virtual book club (meetings have ended, but the free EPUBs and PDFs remain on the site for download), Unravel Van Gogh application to learn more about individual paintings, and a children’s media section
bonus: while not really educational, we’re a big fan of the calming Window Swap, which allows you to see the view out of people’s windows all over the world (with audio!)
mandatory disclaimer we have not tried every link on these sites and are not affiliated with these organizations. some links may have ads (window swap especially). please feel free to add on your favourite sites like these in the notes!
#text#mine#not vc#virtual museum tour#window swap#arcgis storymaps#it's been a hot minute since we've done anything vc related ourself tbh but we wanted to share these resources w you all :)#hopefully once we move we can get back into bone cleaning but that's hard w a roommate and no yard. we will be starting to make cyanotypes..#...though! stay tuned for that on our art blog we're very excited to make botanical prints and#maybe even some hats tote bags etc. if they work out we might sell some!
22 notes
·
View notes
Text
Back in Business
by Chloe Foor, Student Historian 2022/2024
Hello everyone, long time no see! I am so excited to be a Student Historian with the University Archives for another year! This year, I’m going to be doing something quite a bit different from my oral history project last year, and I was able to get a head start over the summer. Read on to learn more!

From the Wisconsin LGBT History Project, showing LGBT Businesses in Madison.
This year, I am working on a project that will map queer spacemaking in Madison from the late 1940s to present day. During the summer, I worked on teaching myself ArcGIS, which is the mapping software that I will be using to document these places. I also spent working through the Madison LGBTQ Archive, housed in the UW Archives, researching using documents about the Gay Purges, the GSCC’s foundation, and other early LGBTQ-related events and organizations in the area. I’m excited that I’m able to spend more time in the Archives this year, since that was one thing that I wish I did more of last year. When I’m not researching in the archives themselves, I’m scraping the web, trying to find queer spaces in the area through history. Some resources that have been essential to me have been Dick Wagner’s We’ve Been Here All Along and Coming Out, Moving Forward, which chronicle LGBTQ+ History in Wisconsin from the turn of the 20th century to Stonewall to present day. Some projects similar to my own project that have been incredibly helpful are Mapping the Gay Guides, which hosts an interactive map of queer spaces in America from 1960 to 1980, and the Wisconsin LGBT History Project, which has an interactive map of queer business in Wisconsin from the 1950s to the 2010s. I’ve gotten many incredible entries from all of these resources, and I am currently at over 160 entries!
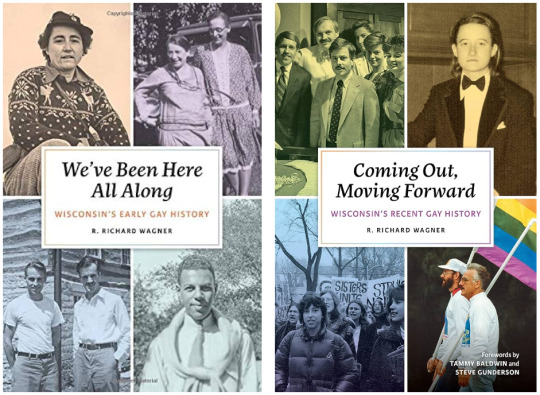
We’ve Been Here All Along and Coming Out, Moving Forward by Richard Wagner, detailing queer history in Wisconsin.

Joe Hammersley (far right), the driving force behind the Gay Purges at UW in the 1950s. Photo from 1951 Badger Yearbook, UW Archives.
Defining exactly what counts as “queer spacemaking” has been a process for me. At first glance, some counter-intuitive locations are included on the map, such as the places where men were arrested during the Gay Purges. These may seem like an absence of queer space, since these spaces were being policed and persecuted by the authorities. However, in order to have been a location that the police knew about, they first had to be a queer space, where LGBTQ+ people might have been comfortable expressing their true selves and desires, if only for a short while. Such locations include the basement of Science Hall, bathrooms in Bascom Hall, and 1514 Adams Street, the residence of two men who, upon being caught kissing outside, were arrested and were the first known victims of the Gay Purges.
All that being said, I really want to get feedback from the community on queer spaces to include on this project. If you head to tinyurl.com/queeratuw, you can submit your own entry to be included on the map! You can submit as many as you like, as long as the entries are places in Madison relating to queer history.
That’s all for now! I’ll make sure to keep you updated over the coming months as the project progresses.
11 notes
·
View notes
Text
Interactive map for the North American eclipse next week, including areas not in totality
3 notes
·
View notes
Text
There are many programs distributing free Naloxone/Narcan to users and non-users.
The link below has an interactive map of locations across the United States specifically where you may be able to source free Narcan if you, someone you know, or just general members of your community are using

‘We put lifesaving medication behind a physical paywall because capitalism and fuck you’
29K notes
·
View notes
Text
Mapextractor for Urban Planners: A Game Changer?
Urban planning is a complex process that requires accurate, up-to-date spatial data. From zoning and infrastructure to green space management and population analysis, every decision depends on high-quality geographic information. That’s where Mapextractor comes in—a tool that is rapidly becoming a game changer for urban planners around the world.
In this article, we’ll explore how Mapextractor is transforming urban planning and why it might be the tool your city development team has been waiting for.
🏙️ What Is Mapextractor?
Mapextractor is a web-based tool that allows users to select specific regions from a digital map and extract detailed geospatial data. With support for various file formats like GeoJSON, SHP, KML, and CSV, it’s designed to help users easily export map data for use in GIS platforms and planning software.
It offers features such as:
Area of Interest (AOI) selection
Layer-specific extraction (roads, buildings, parks, water bodies, etc.)
Multi-format export
Batch processing
API access for automation
🛠️ Why Urban Planners Need It
Urban planning requires extensive mapping work to analyze:
Land use and zoning
Transportation networks
Infrastructure layouts
Public amenities
Environmental impact zones
Traditional GIS platforms like ArcGIS or QGIS can perform these tasks but often require significant training and manual data preparation. Mapextractor simplifies this process, allowing planners to access ready-to-use data in minutes.
🌍 Key Features That Benefit Urban Planners
1. Quick Access to Accurate Data
Mapextractor allows planners to draw or input an exact AOI and instantly retrieve data on roads, buildings, green spaces, and more. This real-time extraction helps teams keep pace with tight project deadlines.
2. Multiple Export Formats
Whether you’re using ArcGIS, QGIS, or even Google Earth, Mapextractor delivers compatible file formats that integrate seamlessly with planning tools.
3. Layer Selection
Planners can extract only the data they need. For instance, if a transportation project is underway, they can isolate road networks and ignore other map layers, minimizing clutter and file size.
4. Cloud-Based and No Installation
Being entirely web-based, Mapextractor allows for collaboration across teams working remotely. There’s no need to install heavy GIS software on every computer.
5. Cost-Effective Solution
Mapextractor offers a free tier and affordable premium plans, making it ideal for small municipalities and consulting firms that might not have the budget for high-end GIS software.
🏗️ Use Case Examples
Transit Planning: Extract road and traffic data to optimize public transportation routes.
Zoning Analysis: Use building footprint data to identify high-density areas for rezoning.
Green Space Allocation: Analyze existing parks and green areas to plan for future development.
Emergency Services: Map existing fire stations, hospitals, and access roads for crisis response planning.
✅ Final Verdict: A True Game Changer
Mapextractor empowers urban planners by removing the technical barriers to geospatial data extraction. With its simplicity, flexibility, and speed, it's revolutionizing how cities and communities plan their growth.
If you're involved in urban development, infrastructure design, or land-use planning, Mapextractor is not just useful—it’s essential.
1 note
·
View note
Text
Geographic Information Systems (GIS) Development

Geographic Information Systems (GIS) have revolutionized the way we interact with spatial data. From city planning to environmental monitoring and logistics, GIS is a powerful tool that combines maps with data for smarter decision-making. In this post, we'll explore what GIS is, the technologies involved, and how to get started with GIS application development.
What is GIS?
GIS stands for Geographic Information Systems, which are tools and systems used to capture, store, analyze, manage, and visualize spatial or geographic data. These systems are essential for analyzing patterns, relationships, and geographic trends across various fields.
Applications of GIS
Urban Planning: Design infrastructure based on population density and land usage data.
Environmental Monitoring: Track climate changes, deforestation, or water quality.
Disaster Management: Map hazard zones and optimize emergency response logistics.
Transportation & Logistics: Optimize routes, manage traffic, and plan delivery systems.
Agriculture: Analyze crop health and soil conditions using satellite imagery.
Key Components of GIS Development
Data: Spatial data (coordinates, maps, images) and attribute data (information about the location).
Maps: Visual representations created from layers of geographic data.
Tools: GIS software and libraries for manipulating and analyzing the data.
Applications: Web or mobile interfaces for users to interact with spatial information.
Popular Tools and Libraries
QGIS: Open-source GIS desktop application for analyzing and visualizing spatial data.
ArcGIS: Enterprise-grade software suite by Esri, used for advanced GIS development.
Leaflet.js: Lightweight JavaScript library for creating interactive maps.
Mapbox: Modern mapping platform with customizable maps and location-based APIs.
GDAL/OGR: Libraries for raster and vector geospatial data manipulation.
PostGIS: A spatial database extender for PostgreSQL.
Basic GIS Development Workflow
Collect Geographic Data: Use satellite data, GPS devices, or public databases like OpenStreetMap.
Preprocess the Data: Clean, convert, and format the data (e.g., shapefiles, GeoJSON, KML).
Store Data: Use spatial databases like PostGIS to manage geodata efficiently.
Develop the Interface: Create web or mobile applications using Leaflet, Mapbox, or OpenLayers.
Analyze Spatial Relationships: Implement queries and analytics to derive insights.
Visualize the Results: Present data in layers, markers, and thematic maps.
Sample Project: Visualizing Population Density with Leaflet.js
<script> var map = L.map('map').setView([40.7128, -74.0060], 11); L.tileLayer('https://{s}.tile.openstreetmap.org/{z}/{x}/{y}.png').addTo(map); // Add GeoJSON layer L.geoJSON(populationData, { style: function (feature) { return { fillColor: getColor(feature.properties.density), weight: 1, opacity: 1, color: 'white', fillOpacity: 0.7 }; } }).addTo(map); </script>
Challenges in GIS Development
Handling large datasets and real-time updates.
Ensuring accuracy and relevance of geographic data.
Managing performance and rendering complex map layers.
Integrating with external services and APIs.
Conclusion
GIS development is a rewarding field that blends programming, data science, and geography. As more industries recognize the value of spatial insights, GIS applications will continue to play a vital role in shaping our world. Whether you're visualizing data on a map or building complex spatial analysis tools, GIS offers endless opportunities for developers to create impactful solutions.
1 note
·
View note
Link
1 note
·
View note
Text
Top 10 Field Data Collection Apps for 2024
Efficient field data collection is crucial for businesses in today’s fast-paced environment. As of 2024, ensuring accuracy, security, and streamlined workflows in data collection processes has become more important than ever. With advancements in technology, a wide range of field data collection apps are available to simplify and enhance these processes.
This article explores the top 10 field data collection apps for 2024. From automated form creation to cloud-based solutions, these tools offer features designed to collect reliable data quickly and efficiently. We’ll examine each app's unique functionalities, advantages, and potential drawbacks to help you determine the best fit for your organization. Let’s dive in!
What Are Field Data Collection Apps?
Field data collection apps are specialized software solutions designed to gather, store, and manage data systematically. These apps allow users to collect information through surveys, forms, polls, and other methods, facilitating organized and efficient data collection for businesses, researchers, and organizations.
Many of these apps include features such as customizable forms, offline functionality, real-time syncing, and integration with other platforms. They are widely used across industries like healthcare, education, agriculture, and market research to improve data accuracy, optimize workflows, and enable data-driven decision-making.
The 10 Best Field Data Collection Apps for 2024
With the increasing demand for secure, reliable, and efficient data collection, field data collection apps have become indispensable tools. Below are the top 10 apps, highlighting their features, user-friendliness, pricing, and more:
1. Fulcrum
Fulcrum is a cloud-based app designed for seamless data gathering and reporting across industries such as construction, environmental science, and inspections. It offers customizable forms, offline data capture, and advanced analytics, making it a popular choice for field teams.
2. Teamscope
Ideal for sectors like research, healthcare, and education, Teamscope provides a secure and user-friendly platform for collecting sensitive data in remote or challenging environments. Features include offline functionality, data encryption, and real-time insights.
3. KoboToolbox
KoboToolbox is an open-source platform that excels in survey creation, data collection, and analysis. Widely used by NGOs and researchers, it offers flexibility and powerful tools for managing and sharing data.
4. Magpi
Magpi simplifies mobile data capture with an intuitive drag-and-drop interface. Industries such as healthcare and environmental monitoring rely on its efficient form-building capabilities and actionable insights.
5. JotForm
JotForm is a versatile online form builder catering to various needs, from surveys to order forms. With extensive integrations and a user-friendly design, it’s suitable for businesses, educators, and individuals.
6. FastField
FastField focuses on simplifying field data collection with offline capabilities, automation features, and real-time reporting. It’s commonly used in industries like construction and inspections.
7. Survey123 for ArcGIS
Survey123 combines user-friendly survey creation with ArcGIS’s mapping capabilities, making it ideal for collecting and analyzing spatial data.
8. Forms on Fire
Forms on Fire empowers organizations with mobile forms and intuitive web interfaces. Its offline capabilities and industry-specific features make it a reliable choice for construction, research, and more.
9. GoSpotCheck
Now part of FORM MarketX, GoSpotCheck specializes in mobile forms and real-time reporting for industries like retail and merchandising. It streamlines workflows and improves data accuracy.
10. iFormBuilder
iFormBuilder supports mobile data collection with offline functionality and automation features. It’s a go-to tool for field research, inspections, and construction.
These apps offer a variety of features tailored to specific industries and needs. By leveraging the right field data collection tool, you can enhance efficiency, ensure data accuracy, and make informed decisions based on reliable insights.
0 notes
Text
Seri Bluff: Menguasai ArcGIS Desktop 10.8.2.
Dapatkan harga Video Tutorial "Seri Bluff: Menguasai ArcGIS Desktop 10.8.2" hanya Rp. 99.000,- ( Harga asli Rp. 279.000). Hanya berlaku 5 hari sampai 21/02/2025.
#attribute query#select by attribute#feature info#opensource#gis operator#geodatabase#spatial query#select by location#location allocation#location intelligence#location based services#gis#geoserver#arcgis#esri#openlayers#wms#wfs#web mapping#leaflet#shapefile#qgis#geonode#freelancer#gis analyst#gis jobs#webgis#development#gis professional#project management
0 notes
Text
Field survey data can be managed well using ArcGIS PRO 3. Field survey tabular data equipped with coordinate points can be plotted onto the ArcGIS PRO 3 application where the distribution of this data will appear and facilitate spatial analysis, spatial modeling and decision making. Get the video tutorial here:
#attribute query#select by attribute#feature info#opensource#gis operator#geodatabase#spatial query#select by location#location allocation#location intelligence#location based services#gis#geoserver#arcgis#esri#openlayers#wms#wfs#web mapping#leaflet#shapefile#qgis#geonode#freelancer#gis analyst#gis jobs#webgis#development#gis professional#project management
0 notes
Text
Cartographic creations with web maps
https://www.esri.com/arcgis-blog/products/arcgis-online/mapping/cartography-tutorial-series-for-web-maps/
0 notes
Text
IBM TRIRIGA Application Suite v11.6 Is Officially Available

TRIRIGA Application
V11.6
IBM has announced the release of TRIRIGA Applications v11.6, Platform v5.0, and CAD Integrator v14.0, together with the most recent version of the IBM TRIRIGA Application Suite (TAS), v11.6.
With the introduction of important enhancements intended to assist enterprises in further streamlining their real estate and facilities management processes, this version represents a noteworthy milestone for TAS. IBM ranked the areas that its customers and analysts thought would be most helpful for improving their business operations. As part of the Application Suite, IBM Maximo Monitor for workplace analytics and monitoring features is being introduced. Teams can now see real-time occupancy, energy, environmental, and facility asset data with this new AI-powered monitoring feature, which will help them make informed decisions and take action to maximize their property portfolios.
Esri ArcGIS
TRIRIGA Location Service for Esri is another significant addition to the Application Suite. Customers may now directly license Esri ArcGIS on Kubernetes from IBM, allowing GIS visualization and TRIRIGA experiences. Through the ability to search for and explore buildings, indoor mapping and navigation give employees and visitors more tools to enhance the occupant experience. Facility managers can view and interact with portfolio data on a map using outdoor GIS, enabling perceptive visual analysis.
Additional notable improvements to TAS include the following new lease accounting features:
Situations with Negative Asset Value
For scenarios involving prepaid rent, the Net Lease Liability Roll Forward Report
Journal Entries to Make Retrospective Adjustments
RE Invoice Creation Form Redesign for AR and AP Leases
IBR% Changes and Lease Documents in Bulk Upload
By exporting space plan scenarios to PDF for evaluation with important stakeholders, new dynamic space planner functionalities offer improvements to cooperation. Space planners can visualize scenario modifications before they are implemented by connecting to the Stacking App.
Users may work more productively with improvements to the Work Task Services App’s user experience, such as inventory monitoring capabilities and the option to view reservation owner details in the Reservation App to arrange a room change
v11.6 of the TRIRIGA Application Suite represents a substantial improvement when all of these new features and capabilities are combined. Contact your IBM Business Partner to arrange a discussion about TRIRIGA and v11.6.
TRIRIGA Application Platform
Organizations may quickly configure apps and increase the use and value of IBM TRIRIGA applications by utilizing the graphical and configuration tools provided by the IBM TRIRIGA Application Platform solution. Key business systems are interoperable through the use of standards-based technologies, interfaces, and a high-performance workflow process engine.
For quick transaction processing, there is a runtime environment called the IBM TRIRIGA Application Platform. The Administrator Console, Document Manager, IBM TRIRIGA Connector for Business programs enabling system integration, and linkage to computer-aided design (CAD) programs are all part of the platform, which also supplies the underlying technology for the IBM TRIRIGA apps. Additionally, a suite of browser-based tools for creating and modifying the applications that IBM TRIRIGA delivers is provided via the IBM TRIRIGA Application Platform.
For the purpose of creating UX apps, the IBM TRIRIGA Application Platform offers an MVC-based UX framework. The program is divided into three parts or layers using the model-view-controller (MVC) technique: the model, view, and controller. The Polymer collection of reusable web components serves as the foundation for the view layer. The UX framework’s adaptable and modular architecture makes it easier for businesses to meet business objectives while offering a touch-friendly interface, enhanced performance, and an intuitive user interface.
Using the all-inclusive IBM TRIRIGA solution, you can:
Set up IBM TRIRIGA programs without modifying the original code.
Produce regulatory reports in the same setting as regular business tasks.
Cut down on IBM TRIRIGA application implementation and maintenance time and expenses.
Provide applications using reliable portals.
Upgrade your applications to safeguard special configurations.
Change an existing business object and its associated workflows, lifecycle states, and data field definitions.
TRIRIGA Application Suite
What is TRIRIGA application?
TRIRIGA is an IWMS (Integrated Workplace Management System) designed to assist teams in charge of facilities and enterprise real estate in managing assets and portfolios over the course of their lives.
Streamline your facilities and real estate management processes
For most major firms, real estate represents the second-largest financial burden. Businesses are quickly moving toward centralized structures due to a changing operational environment. Enterprise-grade solutions are needed for this in order to save costs and improve responsiveness and efficiency.
Enhancing operational effectiveness requires having access to data from a single source of truth throughout the real estate lifecycle. IBM TRIRIGA provides a comprehensive suite of natively integrated Integrated Workplace Management Systems (IWMS) from a reputable brand that leads the market in functionality, security, and configurability.
TRIRIGA is a fast, flexible, and all-inclusive platform that offers all the applications needed to optimize facility lifecycle performance and get you ready for future requirements.
Read more on govindhtech.com
#IBMTRIRIGAApplication#Suitev116#TRIRIGAApplication#IBMMaximo#IBMTRIRIGAApplicationSuite#TAS#TRIRIGAApplicationPlatform#ibm#IBMTRIRIGA#managementprocesses#technology#technews#news#govindhtech
0 notes
Text
5 Top GIS Tools - Discover the Power of GIS
As Geographic Information System (GIS) technology continues to advance, 3D GIS tools are playing an increasingly important role in the visualization and analysis of geospatial data. These tools not only allow for the display of complex spatial relationships but also provide users with a more intuitive way to understand and utilize geographic data. Below are five noteworthy 3D GIS tools, each offering unique features and applications that can greatly support you in creating virtual worlds.
1. Esri ArcGIS Pro
Overview: ArcGIS Pro, provided by Esri, is a leading GIS software that integrates 2D and 3D geospatial data management, analysis, and visualization. Within a single project, you can work with both 2D and 3D maps and scenes, enabling data analysis from multiple perspectives.
Features:
Powerful 3D analysis capabilities, including line-of-sight analysis and 3D model import.
Support for creating and sharing 3D scene layers, making it easy to display complex terrains, buildings, and urban models.
Suitable for managing large-scale geospatial data, efficiently integrating various data formats.
Use Cases: Urban planning, infrastructure management, environmental impact assessment.
2. Google Earth
Overview: Google Earth is a free geospatial information platform that allows users to explore any location on Earth in 3D. With its intuitive interface and rich satellite imagery, 3D models, and street view, users can examine the terrain and buildings in detail.
Features:
Combines satellite imagery with elevation data to provide realistic 3D views.
Offers location search, route display, and historical imagery time-lapse features.
Displays 3D buildings and terrain data, offering users deep geographic insights.
Use Cases: Tourism, education, basic geographic awareness.
3. Wings Engine
Overview: Wings Engine is a high-performance visualization platform focused on real-time 3D Geographic Information Systems (GIS). It is widely used in urban planning, environmental analysis, and infrastructure management. Wings Engine supports multiple data formats and can render complex terrains and buildings in real-time.
Features:
Supports various 3D data, allowing for the visualization of terrains, buildings, and infrastructure.
Real-time data processing and display, with dynamic scenes and time sliders to visualize data changes.
An advanced rendering engine that smoothly handles large-scale urban models and detailed terrain displays.
Use Cases: Urban planning, disaster simulation, environmental monitoring, infrastructure management.
4. CesiumJS
Overview: CesiumJS is an open-source JavaScript library designed for creating and displaying interactive 3D globes or maps in web browsers. Through WebGL technology, it enables real-time high-performance rendering of large-scale geospatial data.
Features:
Provides streaming and visualization of large-scale 3D data.
Real-time 3D rendering in web-based applications, supporting time-series and dynamic data.
Open-source and highly customizable, suitable for various types of geospatial application development.
Use Cases: Web-based geospatial applications, aerospace, urban planning.
5. Bentley ContextCapture
Overview: Bentley ContextCapture uses photogrammetry technology to convert the real world into high-precision 3D models. By processing images taken by drones or cameras, it can automatically generate large-scale and detailed models of cities, buildings, and terrains.
Features:
Automatically generates realistic 3D models from photos or point cloud data.
Creates high-precision large-scale 3D models that can integrate seamlessly with other GIS software.
Use Cases: Architectural design, city modeling, infrastructure monitoring.
Conclusion These five 3D GIS tools each offer unique advantages and applications in their respective fields. Whether you're involved in urban planning, environmental monitoring, or creating virtual worlds, these tools can provide you with powerful support. Choosing the right tool will significantly enhance the efficiency and effectiveness of your geospatial data processing and visualization. If you have any questions or need further advice, feel free to reach out.
0 notes