#chromedev
Explore tagged Tumblr posts
Visit Tumblr Blog
Explore Tumblr blogs with no restrictions, modern design and the best experience.
Last Seen Tumblr Blogs


Fun Fact
The average Tumblr user visits about 67 pages every month.
Text
Secure Your Users: Essential Security Practices for Chrome Extensions
Learn how to enhance the security of your Chrome extensions with best practices. Safeguard user data and build trust while delivering a seamless experience.
0 notes
Text
Using Google Chrome DevTools To Improve Site Performance

Chrome DevTools is a set of web developer tools built directly into the Google Chrome browser. DevTools can help you edit pages on-the-fly and diagnose problems quickly, which ultimately helps you build better websites, faster. As a digital marketing agency, it’s essential to understand the backend of technology to be able to provide better solutions, faster.
And improved site performance is essential for any brand to have better visibility, and to prepare better inbound marketing strategies.
TWO IMPORTANT GOOGLE CHROME DEVTOOLS TO IMPROVE YOUR SITE PERFORMANCE ARE –
Performance Tool
Audit tool or Lighthouse
How can you access these tools?
Load your website in a Chrome browser
Right click on you webpage
Click on ‘inspect Element’
You will see different tabs – Elements, Console , Sources , Network, Performance, Memory, Application, Audits (recently named as Lighthouse) , Security
Here, we are going to discuss two tools which are on 5th and 8th tab from the left when we access the “inspect element” section of the webpage
Performance Tool:
To record Ctrl + E
To reload Ctrl+Shift+E (to record page load)
Performance tool helps you to check load time of each element on your webpage. It helps to check runtime performance and load performance. Runtime performance is the performance of page when it is running and load performance refers to the performance of the page when it is loading. Both help to identify performance issues that affect speed and overall user experience.

This performance report shows frame by frame load time.
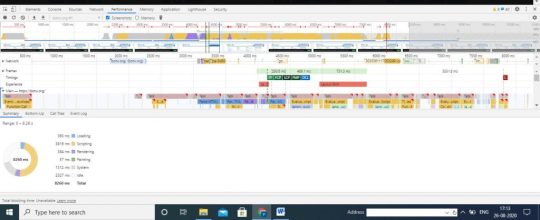
While running a performance tool, you will see load time taken by each element. You will encounter different terminologies on horizontal frames such as FP, FCP, LCP, FMP, DCL etc. Let’s have a look at each of these terms.
FP – First Paint
It is the time taken by first pixel when painted onto the webpage.
FCP – First Contentful Paint
It is a first content render on the webpage when user browses the website.
LCP – Largest Contentful Paint
It measures the loading performance of a website. LCP means time taken by largest element on the website to load. Ideal LCP score should not be more than 2.5 seconds.
FMP – First Meaningful Paint
As the name suggests, First Meaningful Paint means the time taken to provide the first meaningful information to users.
DCL – DOM Content Loaded
It measures when the HTML document on a webpage is loaded and parsed.
Audit or Lighthouse Tool:
An Audit tab gives you an overview of the metrics that improves performance, accessibility, SEO and other best practices areas. It is also known as Google lighthouse report.
This is what the Lighthouse pane looks like (see below). You can check scores of the above-mentioned metrics for your website. They give scores for both the devices i.e. mobile as well as desktop. You can also check the performance score for the Progressive Web App if you have it.
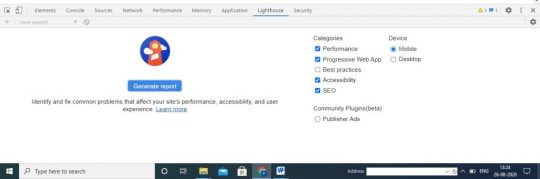
To run this tool, you have to right click on the webpage you want to test. Then, click on “Inspect Element”. It opens up a pane where you will see this Lighthouse tab. After clicking on a “Generate Report”, it will provide a score as shown below –
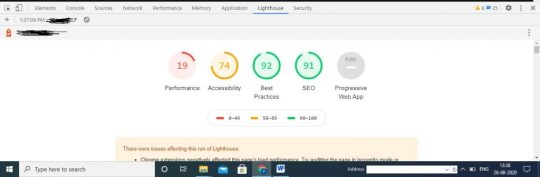
With Lighthouse reports, you may get these recommendations that can help you to improve site speed –
A. Performance
Information regarding render-blocking resources
Server response time
Information about impact of third party codes on the website
Header information and server push
JavaScript execution time
Website cache policy
Number of requests to resources required to load the webpage i.e. request count
LCP (Large Contentful Paint elements) & CLS (Cumulative Layout Shifts on elements) issues. Read more about LCP & CLS issues here – https://support.google.com/webmasters/answer/9205520?hl=en
Information about minifying CSS & JavaScripts as well as HTML
Image Sizes and formats
DOM size
Network payloads
Unused codes like CSS and JS
Recommendations on animate content
B. Accessibility
Colours and contrast
Navigations
Names and labels for images, links and form elements
Meta viewport tag for mobile
Language attributes
C. Best Practices
Security aspects of JavaScript libraries used
Security in terms of HTTPS signals
Security aspects of cross-origin destinations
Copy-paste values into form fields
D. SEO
Image alt attributes
Tap sizes on mobile devices
Structured data
Meta viewport tags for mobile
Meta title and descriptions
HTTP response code
Status for robots.txt
Indexing status
Hreflang tags and canonical tags
Font sizes
Information about plugins
E. Progressive Web App
Page load information on mobile networks
Information about installability such as service worker and web app manifest
Redirections
Use of HTTPS
Cross-browser functionality
And other PWA optimisation aspects
Bonus: Alternative to Google Chrome Lighthouse tool is web.dev
Hope running these easy tests will help improve your site speed and performance. If you need any assistance to audit your website, contact Liqvd Asia tech and SEO support here!
WANT FREE SITE PERFORMANCE REPORT?
Visit our website homepage to add your business information with a ‘get in touch’ form in a footer and get site performance tips straight to your inbox.
1 note
·
View note
Text
How To Scrape & Automate Job Data From Websites?

In this article, we will scrape & automate job data from websites. Both of these tasks are achievable using several tools and libraries. Let’s have a look at each one of them.
Web Scraping: Web Scraping is a method that enables data extraction from websites and collecting them on spreadsheets or databases on a server. It is helpful for data analytics or developing bots for several purposes. Here, we will change it to small jobs scraper that can automatically run and fetch the data and help us see new scraped job offerings. The Job automate data scraper is the most used tool for this purpose.
Several different libraries help you achieve this task successfully:
Python: Both Scrapy and BeautifulSoup are the most popular used libraries for web scraping. The role of BeautifulSoup is to provide a simple interface for extracting data from HTML and XML documents. Scrapy, on the other hand, is a robust framework for building web spiders and crawling websites.
Node.js: Regarding web scraping in Node.js, Cheerio and Puppeteer are popular choices. Cheerio is a jQuery-like library that enables one to traverse and manipulate HTML. Puppeteer is a headless browser automation tool that is helpful for more complex scraping tasks.
Ruby: To perform web scraping in Ruby, Nokogiri is a commonly used library. It provides an easy-to-use interface for parsing HTML and XML documents and extracting data.
Android Automation: When it comes to performing automating tasks on Android devices, several tools and frameworks are helpful:
Puppeteer: a Node.js collection offers advanced API to switch Chromium over the DevTools Procedure. It possesses advance JavaScript and browser features.
Playwright: This library provides cross-browser automation via a single API.
Appium: Appium is an open-source tool for automating mobile apps on Android and iOS platforms. It supports multiple programming languages, including Java, Python, and Ruby, and allows you to write tests that interact with your Android app.
Thus, when it comes to scraping job websites, the best and most affordable option is to seek professional help from Job recruitment data scraping services. They are well equipped with the tricks and latest techniques that help obtain scraped job posting data and get the most relevant ones based on your needs.
Those, as mentioned earlier, are some of the few examples of the tools and frameworks required for web scraping job postings Python and Android automation. Depending upon your preference and specific requirements, you choose the one that best suits your requirements.
List of Data Fields
Job Title
Company name
Location
Job Summary
Description
Salary
Employee profiles
Job Postings
Company Profiles
Job Type
To scrape job recruitment data online, the site we are supposed to scrape is remoteok.io.
Installing Libraries: We use Puppeteer to scrape job data from the websites. To automate the scraping, we have to run the script every day. It is possible to use CronTab, a Linus time job scheduler utility. It is a headless browser API that offers the Chromium browser with easy control, similar to the other browsers.
We will use a framework generator to frame an project and the Pug template engine to show the scraped jobs via the Express server.
Inspecting the Site: The first and foremost step before scraping any site is to inspect every detail of the site content to know the process of building the script. However, scraping is a technique that mostly depends on understanding the website structure, like, how DOM is structured and which HTML Elements & attributes are important. We are using ChromeDev Tools or Mozilla Dev Tools for inspection.
Developing the Scraping Script
All async codes are handled using async/await. We will also export the primary function to the modules run to be used from outside and called from our server.
Next, we will look for the job and extract the Title, Company, and other details.
For more information, get in touch with iWeb Data Scraping now! You can also reach us for all your web scraping service and mobile app data scraping requirements.
#Scrape&AutomateJobDataFromWebsites#Jobrecruitmentdatascrapingservices#webscrapingjobpostingsPythonandAndroidautomation#Jobautomatedatascraper#scrapejobdatafromthewebsites#dataextractionfromwebsites
0 notes
Text
Make screenshot of website with device frame in Chrome
Make screenshot of website with device frame in Chrome #chromedev #mobility #chromedevtools #programming #developer #coding #developercommunity #daysofcode
All modern browsers offer mobile emulation tools, and one of the best can be found in Chrome. The post will show you how to Make screenshot of website with device frame in Chrome. It is very useful for developers to check how their web sites look on smartphones and small screen devices. Here what you need to do: 1. Start Chrome, navigate to the web page you want to test and open the Developer…

View On WordPress
0 notes
Text
Lighthouse Bringing Better Recommendations to Google PageSpeed Insights
We all care about how fast our website loads.
At least, we should by now.
A fast website on any device or browser not only provides a better user experience but is rewarded by search engines with more authority, helping to improve your search rank.
If you really don’t know the importance of website load time, check out Christine and Marcus talk about it here, but before you do, let me tell you about this new update from Google that may give put it into perspective for you.
Drumroll.
PageSpeed Insight & Lighthouse Unite!
PSI now uses Lighthouse as its analysis engine.
Why is this a big deal? Well, as you may know, Google provides a variety of tools (like PSI and Lighthouse) to help you understand the performance of a single page or even your entire site.
While this is seemingly a good thing, recently, it was realized that having such a variety of tools caused some issues because they all had different recommendations, which could ultimately confuse the user.
Google decided to fix that and have PageSpeed Insights and Lighthouse (two long-offered tools) work together to bridge the gap.
PageSpeed Insight (PSI), for those of you not familiar with it, is a tool that analyzes the performance of a page on both desktop and mobile devices and provides you suggestions on how to improve your page.
Lighthouse, meanwhile, is an open-source, automated tool used for helping you improve your page. According to Google, it “gives you personalized advice on how to improve your website across performance, accessibility, PWA, SEO, and other best practices.”
Google states, by now working together, “... developers [will] get the same performance audits and recommendations everywhere: on the web, from the command line, and in Chrome DevTools.”
In other words, recommendations and data between the tools will now be consistent, reducing confusion and mixed messages.
What insights will users now get their hands on? Let’s start with each individual tool.
What Information Does PSI Provide?
With PageSpeed Insight, you are provided with the following information.
Lab Data. Using LightHouse, PSI simulates how a mobile device loads your page. Once completed, it summarizes the performance metrics, such as First Contentful Paint and Time to Interactive, and gives you a performance score from 0-100. Scores are categorized into three levels, a score of 90 or above is considered fast, and 50 to 90 is considered average, and below 50 is considered to be slow. …
Field Data. These are real-world performance metrics, First Contentful Paint and First Input Delay, for a page and its origin. The strengths of this report is it captures true real-world user experience and enables correlation to business key performance indicators. (Note that not all site may have field data available for display)
Opportunities. These are the suggestions that PSI provides on how to improve a page’s performance metrics and estimate how much faster the page will load, if you were to follow through with them.
Diagnostics. Provides additional information about how a page follows best practices for web development.
What Information Does Lighthouse Provide?
If you wanted to use Lighthouse as a solo website speed test, outside of PageSpeed Insights, the audit reports on a few key factors for each web page. They are:
Overall Performance. Included metrics are First Contentful Paint, First Meaningful Paint, Speed Index, First CPU Idle, Time to Interactive, Estimated Input Latency.
Progressive Web App. These checks validate the aspects of a Progressive Web App, as specified by the baseline PWA Checklist.
Best Practices. Some of these best practices include Uses HTTPS, Page has the HTML doctype, Avoids deprecated APIs, No browser errors logged to the console, etc.
Accessibility. These checks highlight opportunities to improve the accessibility of your web app. Only a subset of accessibility issues can be automatically detected so manual testing is also encouraged.
SEO. These checks ensure that your page is optimized for search engine results ranking. There are additional factors Lighthouse does not check that may affect your search ranking. Learn more.
Here is a guide that explains how Lighthouse calculates the scores.
In the Lighthouse report, audit has a reference doc explaining why the audit is important, as well as how to fix it.
What Does This Mean for You?
Your audits between all the different Google Performance tools will be less confusing and more cohesive!
As marketers, these types of tools you and your developers should truly care about as they help to make sure your site is optimal, and help improve your search engine ranking.
Whether you are making constant updates to your site or not, you should be checking on your performance to ensure you’re in-line with what search engines are looking for.
If PSI or Lighthouse tells you your site is running slow, and you want a few more recommendations, here are 5 ways you and your team can improve page load time on your website.
So, How Do I Get Started using Lighthouse or PSI?
You can run Lighthouse in ChromeDev Tools, and for more technical developers or marketers who like to tap into development, from the command line or a Node module.
Here you can find step by step directions for running Lighthouse.
For PSI, just go to https://developers.google.com/speed/pagespeed/insights/, enter your URL and hit the analyze button, to see your results.
from Web Developers World https://www.impactbnd.com/blog/lighthouse-bringing-better-recommendations-to-google-pagespeed-insights
0 notes
Text
Google Removes MetaMask from Chrome Extension Store
Google has abruptly removed MetaMask from the Chrome Extension store without any explanation. The Dapp browser extension has been unceremoniously removed from the Android and Chrome marketplace with no indication as to why, and if or when it will be restored.
MetaMask made the announcement on its Twitter handle on Wednesday July 25 in a tweet that read:
“PSA: MetaMask has been delisted from the Chrome Web Store. We are unsure of why this is the case and we will update everyone as we get more information. All other browsers are unaffected.”
PSA: MetaMask has been delisted from the Chrome Web Store. We are unsure of why this is the case and we will update everyone as we get more information. All other browsers are unaffected.
— MetaMask (@metamask_io) July 25, 2018
Bad News For Ethereum Users
Currently, MetaMask plays an extrmely vital role in the mainstreaming of Ethereum, as it provides an interface between conventional web browsers and decentralised networks. Using MetaMask, users can access Ethereum DApps in their browsers with no need to run a full blockchain node.
Until Ethereum and other decentralized frameworks attain widespread adoption, such interfaces remain perhaps the most important part of the present Ethereum experience.
The sudden and unexplained delisting by the Google Chrome web store will make it more difficult for chrome users who do not already have the extension installed to access Ethereum Dapps, which could have a negative effect on the continued adoption of Ethereum.
For the time being other well known browsers than can run MetaMask, including Mozilla Firefox, Opera and Brave are not affected by the purge.
Speaking on Twitter, MetaMask expressed cautious optimism abut resolving the situation quickly, informing existing MetaMask users that the service should still work fine for the time being.
This would only affect new users on Chrome short-term as they would not be able to install it. Hopefully this resolves before we push up an update, which we would need a store listing (to our knowledge) to make happen.
— MetaMask (@metamask_io) July 25, 2018
As to whether this will continue going forward, there is still no indication yet, but MetaMask hopes that it will be able to reach out to Google and resolve the issue quickly.
While @googlechrome has taken MetaMask down from their @ChromeDev store without notice or explanation, users can still install MetaMask manually on Chrome by following this guide. Note: @brave, @firefox, and @opera stores are all working fine!https://t.co/11ElxRgjDL
— MetaMask (@metamask_io) July 25, 2018
In the meantime, MetaMask users have been taking to Twitter to voice their displeasure and speculations about the ongoing situation.
Some have speculated that the delisting is a simple mistake caused by an overzealous keyword function.
Chrome has banned crypto mining addons. They are probably using an automated system that banned Metamask based on keywords that are similar to those in mining addons.
— The Cryptophiliac (@thecryptophilia) July 25, 2018
Others have reacted with rage against Google, suggesting that the situation presents a perfect opportunity to migrate from Chrome to other browsers such as Brave.
Bye bye chrome, hello Brave. Bye bye google, hello Presearch. Bye bye instagram , hello Lit
— Ignasi Palazuelos (@IgnasiBCN) July 25, 2018
Amidst all this, both MetaMask and Augur have pointed out that fraudsters are looking to take advantage of the chaos by placing phishing apps on the Android store which impersonate MetaMask.
https://twitter.com/AugurProject/status/1022186967432192000
For now, no one can say for sure what the issue is, least of all MetaMask itself. Whether MetaMak is suffering a minor developer hiccup as speculated by some users, or it is the victim of a more permanent reorganization by Google remains to be seen.
CCN will bring more updates as they become available.
Follow us on Telegram or subscribe to our newsletter here. • Join CCN’s crypto community for $9.99 per month, click here. • Want exclusive analysis and crypto insights from Hacked.com? Click here. • Open Positions at CCN: Full Time and Part Time Journalists Wanted.
Advertisement
source: https://ift.tt/2uNSrm6
The post Google Removes MetaMask from Chrome Extension Store appeared first on BTC News Today.
from WordPress https://ift.tt/2OhR8E8 via IFTTT
0 notes
Text
Мошенники воспользовались удалением расширения MetaMask из магазина Chrome
Вечером 25 июля Chrome Web Store удалил Ethereum-расширение MetaMask. Однако на следующий день плагин вновь появился в интерн��т-магазине. Согласно заявлению команды MetaMask в Twitter, поисковый гигант Google Chrome без предупреждения удалил приложение из веб-магазина, не объяснив причины решения. While @googlechrome has taken MetaMask down from their @ChromeDev store without notice or explanation, users can still […]
Сообщение Мошенники воспользовались удалением расширения MetaMask из магазина Chrome появились сначала на Охота за монетами.
from WordPress https://ift.tt/2uQ9gx3 via IFTTT
0 notes
Link
Show HN: Embedded v8 inspector integration with chromedev tools front end 3 by harshahs |
0 notes
Link
Article URL: https://github.com/hsharsha/v8inspector
Comments URL: https://news.ycombinator.com/item?id=16034285
Points: 12
# Comments: 1
hnrss is a labor of love, but if the project has made your job or hobby project easier and you want to show some gratitude, donations are very much appreciated. PayPal and Bitcoin both accepted. Thanks!
0 notes
Text
New top story on Hacker News: Show HN: Embedded v8 inspector integration with chromedev tools front end
Show HN: Embedded v8 inspector integration with chromedev tools front end 8 by harshahs | 1 comments on Hacker News.
https://ClusterAssets.tk
View On WordPress
0 notes
Text
Show HN: Embedded v8 inspector integration with chromedev tools front end
Show HN: Embedded v8 inspector integration with chromedev tools front end 3 by harshahs | from Blogger http://ift.tt/2pZZOqW
0 notes
Text
Selecting the Perfect Tech Stack for Your Chrome Extension Project
Discover how to choose the right tech stack for building Chrome extensions that meet your needs and goals. Explore factors to consider and how to align technology choices with your project's requirements.
0 notes
Text
Step-by-Step Guide: Publishing Your Chrome Extension to the Web Store
Easily publish your Chrome extension with our step-by-step guide. From preparation to submission, we cover everything you need to get your extension live on the Web Store.
#ChromeExtension#WebStore#PublishingGuide#ChromeDev#ExtensionDevelopment#TechTips#DeveloperLife#ChromeWebStore#ExtensionPublishing#HowToPublish
0 notes
Text
How to Create a Chrome Extension Without Coding
Creating a Chrome extension doesn't always require deep coding knowledge. In this guide, you'll learn how to develop powerful, customized Chrome extensions using user-friendly tools and platforms that simplify the process. Whether you're a business professional, entrepreneur, or tech enthusiast, this step-by-step tutorial will help you bring your extension ideas to life without needing to write a single line of code.
#ChromeExtension#NoCode#NoCodeDevelopment#NoCodeTools#NoCodePlatform#ChromeDev#BrowserExtension#ExtensionDevelopment
0 notes
Text
How to Easily Build a Chrome Extension: A Comprehensive Guide
Chrome extensions have revolutionized browsing experiences, offering users tailored functionalities from ad blockers to productivity tools. But what makes them so compelling, and why should you consider creating one? In this guide, we explore the process of conceptualizing, developing, and launching a Chrome extension. From understanding its core components to navigating deployment, this post equips you with everything needed to turn your idea into reality.
#ChromeExtension#WebDevelopment#ProductivityTools#TechGuide#DeveloperTips#Coding101#TechTutorial#WebDev#ChromeDev#SoftwareDevelopment#buildchromeextension#.
0 notes