#concept_map
Explore tagged Tumblr posts
Visit Tumblr Blog
Explore Tumblr blogs with no restrictions, modern design and the best experience.
Last Seen Tumblr Blogs


Fun Fact
Users from the US are the majority of Tumblr visitors.
Quote
UML を認識する方法は、誰も覚えていないほど多様な矢印スタイルによって決まります。 それが普及しなかった主な理由だと90%確信しています。 必要があります 学習する 愚かな矢印があるため、UML を 。 これを次のようなものと比較すると、UML 図を時々読むためだけに、10 種類の矢印のスタイルを何気なく暗記する人はいないという事実が認められます。 https://buck2.build/docs/concepts/concept_map/
ノムノムル | ハッカーニュース
0 notes
Photo
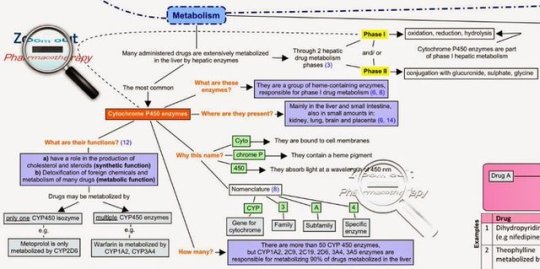
CYP450 metabolism drug interactions. Part of #drug_drug_interactions #concept_map from Zoom out - Pharmacotherapy. Available on https://t.co/ZseGZoesm9 pic.twitter.com/ZXCGv4O4PV
— ZO - Pharmacotherapy (@pharmacotherapy) May 3, 2019
0 notes
Photo

Concept Map
I created a concept map which tracks the spread of the Bubonic plague. I divided the information into four distinct sections in order to make it easier to follow the information. I wanted to keep the color palette simple. I used black and purple to evoke a sense of disease and death without being too overtly morbid. The background is an image of piled bones. I wanted this to be very subtle to help reduce the shock factor. I created vectors of European citizens from the 1300s based off an image from a history website.
1 note
·
View note
Photo

For this project i designed a concept map poster for freshwater usage. I researched terminology associated with freshwater usage and then from there found some statistics. I then separated my topic into three sub topics and then visually connected them appropriately. I went with a tan, blue and tan color scheme to give it an earthy water feel. My favorite thing about my concept map is my creative pie graph.
0 notes
Photo

Concept map poster that illustrates the essential factors that contribute to Global Climate Change. The main goal for this poster was to let the viewer to understand global climate change as a cyclical force of nature. Every living being on earth plays a role in or is affected by our climate, so by intertwining seemingly unrelated phenomena the viewer can better understand why the earth is really just one ecosystem.
0 notes
Photo

This is a map that details and connects the goals, projects, and tools associated with S.E.T.I. (the Search for Extra-Terrestrial Intelligence). It includes two info graphics!
0 notes
Text
Concept Map
This is a concept map explaining the concept of the Spread of Illness. It is essentially a visual web of ideas detailing all the factors that went into one of the deadliest pandemics in history, the Spanish Flu.
My overarching goal with this assignment was to show that many factors are interrelated in the spread of an illness. I achieved this by creating a composition that seemed to go everywhere in a way similar to the spread of a virus. The path of my chart also changes depending on which route you take, and some paths lead to the same place, showing this interrelated nature.
0 notes
Photo

"Concept Map"
A Concept Map is a specific kind of information graphic that explains a topic by connecting its major ideas and terms through a series of "linking words", making up "framing sentences". I chose to research and to make a concept map about the spread of a particular kind of illness. I created a concept map about the spread of the illness called "Malaria". I included information such as its cause, transmission, symptoms, treatment, and prevention.
0 notes
Photo

Title: Concept Map: Civil Rights Movement Post WWII
Instructor: Natalie Davis
I created a concept map influenced by Venn Diagrams illustrating the history of the Civil Rights Movement after 1945. I created two infographics, one is a timeline of the history with dates, the other showing the difference in African American registered voters in 1945 and 2010.
0 notes
Photo

#Parkinson_disease vs atypical parkinsonism - PD differential diagnosis https://t.co/cKxJLFA5TW #concept_map http://pic.twitter.com/fmFLPQFyt7
— ZO - Pharmacotherapy (@pharmacotherapy) November 5, 2017
0 notes
Photo

Course: Junior Studio Year: Spring 2011 Instructor: Daniel Lievens
0 notes