#count5
Explore tagged Tumblr posts
Visit Tumblr Blog
Explore Tumblr blogs with no restrictions, modern design and the best experience.
Last Seen Tumblr Blogs


Fun Fact
Women make up for the other 50% of Tumblr’s audience.
Text
ep 7
why are the phones on loud all the time
elle :(
oh my god darcy
mr farouk 🩷🩷
michael is the best
did they do it in the music room??
oh god movie night is either going to be amazing or a complete disaster
cry count5(?)
oh nick :(
nick feeling lost hurts to watch :(
i love all the little moments of checking in with consent
1 note
·
View note
Photo

Amygda: { Ok gang, what do we think?
Hiraeh: I’m going xo be incredibly X if ix xurns oux we’re all dead, ngl
Amygda: { Ok phair, but I mean in terms of these asks sppeciphically.
Cilone: Well, wh- sent which, again?
Amygda: { Dienoh Dewise - the hugger - sent ‘no one’s dead’ and Al….? I think? Sent ‘maybe everyone’s dead.’
Cilone: …Ah. S- a familiar but unreliable s-urce, and a less familiar s-urce with questi-nable reliability.
Amygda:{ Yeah basically.
Amygda: { PPersonally, I’d say we listen to Al on this one. Dienoh’s… okay, and all, but they’ve also ppulled some ppretty dumb stunts around here, so I can’t say I trust their judgement.

Cilone: I d-n’t think we sh-uld take st-ck in either -ne. Even if Alf-nz can tell anything -f -ur situati-n in any capacity, there’s n- guarantee us being d–med means anything.
Cilone: It c-uld be that it feels -ff because, say, we were br-ught here because we’ll die in -ur near futures but haven’t yet. We’re all decently -ld as tr-lls g-, this isn’t an unusual p-int in -ur life expectancy t- die.
Lailla: |Bullshit. I swore I wasn’t going to die and there’s no way I’ll die anytime soon. Nor you, for that matter.|
Lailla: |I take good care of myself, there’s no reason for me to be here.|
Quokka: (picking a fight with that a55hole cerulean count5 a5 ‘taking care of her5elf’? 8:/)
Amygda: { Quokka, shh.)
Lailla: |My point is. I refuse to die, that’s the last thing I want. There’s no way this Al kid has an-|
??????: It’s actually not as bad as people say it is, you know.

Everyone: …………………………..

Lailla: |…It was him this whole time???|
Quirk free:
Amygda: Ok gang, what do we think?
Hiraeh: I’m going to be incredibly cross if it turns out we’re all dead, ngl
Amygda: Ok phair, but I mean in terms of these asks specifically.
Cilone: Well, who sent which, again?
Amygda: Dienoh Dewise - the hugger - sent ‘no one’s dead’ and Al….? I think? Sent ‘maybe everyone’s dead.’
Cilone: …Ah. So a familiar but unreliable source, and a less familiar source with questionable reliability.
Amygda:Yeah basically.
Amygda: PPersonally, I’d say we listen to Al on this one. Dienoh’s… okay, and all, but they’ve also ppulled some ppretty dumb stunts around here, so I can’t say I trust their judgement.
Cilone: I don’t think we should take stock in either one. Even if Alfonz can tell anything of our situation in any capacity, there’s no guarantee us being doomed means anything.
Cilone: It could be that it feels off because say, we were brought here because we’ll die in our near futures but haven’t yet. We’re all decently old as trolls go, this isn’t an unusual point in our life expectancy to die.
Lailla: Bullshit. I swore I wasn’t going to die and there’s no way I’ll die anytime soon. Nor you, for that matter.
Lailla: I take good care of myself, there’s no reason for me to be here if that’s the case.
Quokka: (picking a fight with that asshole cerulean counts as ‘taking care of herself’? :/)
Amygda: (Quokka, shh.)
Lailla: My point is. I refuse to die, that’s the last thing I want. There’s no way this Al kid has an-
: It’s actually not as bad as people say it is, you know.
Lailla: …It was him this whole time???
#plot#Ghost post#WE MADE IT...#Amygda Feliss#Cilone Hednis#lailla#quokka frarer#Hiraeh Xexies#Purrol Yaluli#Zahyit Geiste#I feel like I could have scripted the visual reveal on this better but whatever#i want this posted already and this is an informal blog fnhjdgns#long post#off camera#ic
7 notes
·
View notes
Photo

In honor of the International Day of Happiness, take the "Hands Up" challenge! Raise your hand. Count off 5 things you are grateful for. Type it. Share it. Repeat it. "Hands Up" for greater happiness!
0 notes
Text
Microlearning Market 2022 Business Strategies, Revenue and Growth Rate upto 2024
According to a research report "Microlearning Market by Component (Solution and Services), Organization Size, Deployment Type, Industry (Retail, Manufacturing and Logistics, BFSI, Telecom and IT, Healthcare and Life Sciences), and Region - Global Forecast to 2024", published by MarketsandMarkets, the global microlearning market size is expected to grow from USD 1.5 billion in 2019 to USD 2.7 billion by 2024, at a Compound Annual Growth Rate (CAGR) of 13.2% during the forecast period. Increasing demand for training deskless and mobile workers across industries and growing need for skills-based and result-oriented training among enterprises are the major factors driving the growth of the microlearning market.
Download PDF Brochure @ https://www.marketsandmarkets.com/pdfdownloadNew.asp?id=127184631
The solutions segment of microlearning to hold the highest market share during the forecast period
Corporate training programs are undergoing a transformation in their learning methodologies. Traditional methods of classroom training are steadily overtaken by online methods of learning that offer flexibility to learners. Enterprises are focusing on offering enhanced learning experience to employees through various learning and development activities, which are more interesting and engaging. Hence, businesses are keen on adopting training methods that are directly inclined toward a learning objective, which focuses on particular skills or understanding of compliance. The microlearning solution providers are competing with each other to increase their market coverage and expand their presence in newer markets.
Healthcare and life sciences to grow at a significant CAGR during the forecast period
In the healthcare industry, microlearning is used in hospitals, laboratories, and research labs to enable on-the-go learning. Medical practitioners need to update their knowledge and skills to provide the latest treatment to customers/patients. Keeping employees updated about new medical devices and pharmaceutical products is another key aspect of the training and development module in the healthcare industry. The growing demand for advanced eLearning technologies, such as 3D images of internal organs and live interaction with experts, is expected to drive the demand for microlearning solution and services in the healthcare industry, accounting for its highest share among all the industries.
North America to hold the highest market share during the forecast period
The increase in use of eLearning tools, growth in adoption of handheld devices, such as tablets and mobile phones, and technological advancements in learning methodologies have boosted the growth of the microlearning market in North America. In this region, enterprises have become more dependent on handheld devices for better results and convenience of use. With the help of mobile devices, multiple employees, even if they are geographically dispersed, can simultaneously be trained. This capability has drastically helped the corporate sector cut down expenses for the training of employees, and is one of the major factors encouraging corporates to adopt microlearning over the traditional training methods.
The major vendors in the microlearning market are Saba Software (US), Mindtree (India), Axonify (Canada), IBM (US), Bigtincan (US), SwissVBS (Canada), iSpring Solutions (US), Epignosis (US), Cornerstone OnDemand (US), Qstream (US), Pryor Learning Solutions (US), count5 (US), mLevel (US), Gnowbe (US), Trivantis (US), SweetRush (US), Multiversity (India), and Neovation Learning Solutions (Canada).
Browse in-depth TOC on Complete Report @ https://www.marketsandmarkets.com/Market-Reports/microlearning-market-127184631.html
0 notes
Text
Microlearning Market share 2021 Segments, Competitors Strategy, Regional Analysis and Growth by Forecast to 2027
Global Micro-learning Market Synopsis
According to MRFR, the Global Micro-learning Market size was valued at USD 1.09 Billion in 2019 and is poised to record a CAGR of 14.6% during the review period.
There is increasing demand for less training desk and mobile workers across verticals which is a major factor responsible for market growth. Apart from that, another main factor driving the global micro-learning market is the increasing need for skill-based and result-oriented training among companies. Nonetheless, corporations' reluctance to invest an immense amount on turning existing training content into microcontent is expected to curb market growth. The biggest incentive for the providers of micro-learning solutions is to gamify training and education. The use of advanced technologies such as AR , VR, AI, ML and mobile technology is growing, which is another sector for key players to tap into.
Get Free Sample Copy at: https://www.marketresearchfuture.com/sample_request/8688
Competitive Dashboard
The Key Players are Bigtincan (US), Count5 (US), SwissVBS (Canada), Pryor Learning Solutions (US), Gnowbe (Singapore), Crossknowledge (US), mLevel (US), Saba Software (US), Axonify (Canada), iSpring Solutions (US), Mindtree (US), Epignosis (US), IBM Corporation (US), Cornerstone OnDemand (US) and Qstream (US). The major strategies implemented by most of the players are agreements, partnerships, and collaborations.
The other players in the market are Multiversity (India), Gameffective (US), EdApp (Australia), Grovo (US), SweetRush (US), Trivantis (US), Neovation Learning Solutions (Canada) among others.
Market Segmentation
The Global Micro-Learning Market has been segmented based on Vertical, Deployment, Component, Organization Size, and Region.
The global demand for micro-learning has been divided by Component into products and services. The division of resources was further broken down into two segments: consultation and implementing, and support and maintenance.
The Global Micro-Learning Market was broken down into cloud and on-premise by implementation. Over the forecast period, the on-site microlearning solution had a greater market share as these solutions allow companies to develop, store and deliver business-critical data on the server of the company and track access to training programs.
The global micro-learning market was divided into small and medium-sized enterprises ( SMEs) and large companies, depending on the size of the organizations. During the forecast period the broad enterprise segment is projected to hold the largest market share. The SME group, however, is also expected to hold a larger market over a number of verticals as opposed to its previous share.
The global micro-learning market was divided up vertically into retail, manufacturing and logistics, finance, financial services and insurance, telecommunications and IT, healthcare and life sciences, and others.
Regional Outlook
The geographic overivew of the global micro-learning market has been done for the Middle East & Africa, North America, Europe, Asia-Pacific, and South America.
Thanks to the ever-increasing use of eLearning devices, North America has the highest market share as well as the rise of handheld computer adoption. Such tools include cell phones and tablets. Owing to the greater number of technical advancements in learning methodologies compared to Canada and Mexico, the US dominates the market in North America.
In the study era, Europe is projected to be the second-largest market, as businesses use handheld devices on a wide scale across verticals due to ease of usage. Workers located at different locations can be trained concurrently with the help of mobile devices by which the enterprises can save the expenditures for training employees. Because of these benefits, the firms are increasingly adopting microlearning over the region's traditional methods of training. In the forecast period Asia-Pacific is projected to be the fastest-growing segment on the global micro-learning market. The demand is expected to expand at a rapid pace in countries such as China and Japan in the coming years. The the need for skill-based and result-oriented training between companies is a key driver of market growth in Asia-Pacific.
Get Complete Report Details at: https://www.marketresearchfuture.com/reports/micro-learning-market-8688
About Market Research Future:
At Market Research Future (MRFR), we enable our customers to unravel the complexity of various industries through our Cooked Research Report (CRR), Half-Cooked Research Reports (HCRR), Raw Research Reports (3R), Continuous-Feed Research (CFR), and Market Research & Consulting Services.
Contact:
Market Research Future
+1 646 845 9312
Email: [email protected]
0 notes
Text
Microlearning Market Research Report with Outlook, Strategies, Challenges, Geography Trends
Global microlearning market is expected to rise to an estimated value of USD 3.71 billion by 2026, registering a healthy CAGR in the forecast period of 2020-2026. Microlearning is the process of training and skilling workers in an enterprise by training them through specialized training method which involves providing them with micro or smaller information sets so as to enhance their understanding and grasping capacity.
Major Market Competitors/Players
Few of the major competitors currently working in the global microlearning market are Saba Software; Mindtree.com; Axonify Inc.; IBM Corporation; Bigtincan; SwissVBS; iSpring Solutions Inc.; Epignosis; Cornerstone; Qstream, Inc.; count5, LLC; pryor.com; mLevel; Gnowbe; Neovation Corporation; Multiversity; Trivantis; Aptara Inc.; AlertDriving among others.

Get Exclusive Sample Report: @ https://www.databridgemarketresearch.com/request-a-sample/?dbmr=global-microlearning-market
This method ensures that the worker can learn it in a more focused duration as the training sets are only for a few minutes and include various interactive activities.
Segmentation: Global Microlearning Market
· By Component (Solution, Services)
· By Organization Size (Large Enterprises, SMEs)
· By Deployment Type (On-Premises, Cloud)
· By Industry (Retail, Manufacturing & Logistics, BFSI, Telecom & IT, Healthcare & Life Sciences, Others)
· By Geography (North America, Europe, Asia-Pacific, South America, Middle East and Africa)
Competitive Analysis
Global microlearning market is highly fragmented and the major players have used various strategies such as new product launches, expansions, agreements, joint ventures, partnerships, acquisitions, and others to increase their footprints in this market. The report includes market shares of microlearning market for Global, Europe, North America, Asia-Pacific, South America and Middle East & Africa.
Market Drivers:
· Increasing volume of deskless/mobile workers worldwide in various enterprises; this factor is expected to propel the growth of the market
· Enhanced need for implementing skill-based training that can provide measurable results for enterprises is another factor boosting this market growth
· High demands for training the high volume of workers present in different enterprises across a variety of industries also acts as a market driver
· Cost efficient method of learning which boosts the levels of preferences for corporates to indulge in this training method is expected to enhance the adoption rate for this method
Market Restraints:
· Concerns regarding lack of preference of enterprises to incur large-scale expenditure on transformation of content for microlearning methods; this factor is expected to hinder the growth of the market
· This method is generally not preferred or compatible for complex training modules or for modules that require long-term training duration hampers the market growth
· It’s not ideal for long-term goals of enhancing the performance of enterprise as it is a collection of different modules and training sets which only train workers on a single brief topic; this factor also acts as a restraint to the market growth
Enquiry About Report @ https://www.databridgemarketresearch.com/inquire-before-buying/?dbmr=global-microlearning-market
Key Insights in the report:
· Complete and distinct analysis of the market drivers and restraints
· Key market players involved in this industry
· Detailed analysis of the market segmentation
· Competitive analysis of the key players involved
About Us:
Data Bridge Market Research set forth itself as an unconventional and neoteric Market research and consulting firm with unparalleled level of resilience and integrated approaches. We are determined to unearth the best market opportunities and foster efficient information for your business to thrive in the market. Data Bridge Market Research provides appropriate solutions to the complex business challenges and initiates an effortless decision-making process.
Contact:
Data Bridge Market Research
US: +1 888 387 2818
Related Reports:
Mainframe Market
Data Center Networking Market
#Microlearning Market#Microlearning#Microlearning Market Trends#Microlearning Market Industry#Microlearning Market News#Microlearning Market Research
0 notes
Text
Microlearning Market Size Global Gathering and Future Outlook 2020 to 2026
Global microlearning market is expected to rise to an estimated value of USD 3.71 billion by 2026, registering a healthy CAGR in the forecast period of 2020-2026. Microlearning is the process of training and skilling workers in an enterprise by training them through specialized training method which involves providing them with micro or smaller information sets so as to enhance their understanding and grasping capacity.
Major Market Competitors/Players
Few of the major competitors currently working in the global microlearning market are Saba Software; Mindtree.com; Axonify Inc.; IBM Corporation; Bigtincan; SwissVBS; iSpring Solutions Inc.; Epignosis; Cornerstone; Qstream, Inc.; count5, LLC; pryor.com; mLevel; Gnowbe; Neovation Corporation; Multiversity; Trivantis; Aptara Inc.; AlertDriving among others.

Get Exclusive Sample Report: @ https://www.databridgemarketresearch.com/request-a-sample/?dbmr=global-microlearning-market
This method ensures that the worker can learn it in a more focused duration as the training sets are only for a few minutes and include various interactive activities.
Segmentation: Global Microlearning Market
· By Component (Solution, Services)
· By Organization Size (Large Enterprises, SMEs)
· By Deployment Type (On-Premises, Cloud)
· By Industry (Retail, Manufacturing & Logistics, BFSI, Telecom & IT, Healthcare & Life Sciences, Others)
· By Geography (North America, Europe, Asia-Pacific, South America, Middle East and Africa)
Competitive Analysis
Global microlearning market is highly fragmented and the major players have used various strategies such as new product launches, expansions, agreements, joint ventures, partnerships, acquisitions, and others to increase their footprints in this market. The report includes market shares of microlearning market for Global, Europe, North America, Asia-Pacific, South America and Middle East & Africa.
Market Drivers:
· Increasing volume of deskless/mobile workers worldwide in various enterprises; this factor is expected to propel the growth of the market
· Enhanced need for implementing skill-based training that can provide measurable results for enterprises is another factor boosting this market growth
· High demands for training the high volume of workers present in different enterprises across a variety of industries also acts as a market driver
· Cost efficient method of learning which boosts the levels of preferences for corporates to indulge in this training method is expected to enhance the adoption rate for this method
Market Restraints:
· Concerns regarding lack of preference of enterprises to incur large-scale expenditure on transformation of content for microlearning methods; this factor is expected to hinder the growth of the market
· This method is generally not preferred or compatible for complex training modules or for modules that require long-term training duration hampers the market growth
· It’s not ideal for long-term goals of enhancing the performance of enterprise as it is a collection of different modules and training sets which only train workers on a single brief topic; this factor also acts as a restraint to the market growth
Enquiry About Report @ https://www.databridgemarketresearch.com/inquire-before-buying/?dbmr=global-microlearning-market
Key Insights in the report:
· Complete and distinct analysis of the market drivers and restraints
· Key market players involved in this industry
· Detailed analysis of the market segmentation
· Competitive analysis of the key players involved
About Us:
Data Bridge Market Research set forth itself as an unconventional and neoteric Market research and consulting firm with unparalleled level of resilience and integrated approaches. We are determined to unearth the best market opportunities and foster efficient information for your business to thrive in the market. Data Bridge Market Research provides appropriate solutions to the complex business challenges and initiates an effortless decision-making process.
Contact:
Data Bridge Market Research
US: +1 888 387 2818
Related Reports:
Mainframe Market
Data Center Networking Market
#Microlearning Market#Microlearning#Microlearning Market Trends#Microlearning Market Industry#Microlearning Market News#Microlearning Market Research
0 notes
Text
Depressed People: Family History and Drugs/Alcohol DependenceAssignment #Week02: Call in Dataset (NESARC)
I choose python to write my 1st program. The variables that I have chosen to work with were written on the 1st assignment last week. In this assignment, I made my own dataset called subset1 that categorized the respondents by age 15 to 24 called as youth (WHO reference) and have suffered depression. My script on call in NESARC dataset are written below.
#depression and family history study
#depression and alcohol/drugs dependence study
import pandas
import numpy
mynesarc = pandas.read_csv('nesarc_pds.csv', low_memory=False)
#A bug fix for display formats to avoid run time errors
pandas.set_option("display.float_format", lambda x:"%f" %x)
print(len(mynesarc)) #number of observations (rows)
print(len(mynesarc.columns)) #number of variables (columns)
#Frequency of the variables I work with
print("counts for SEX")
sex = mynesarc.groupby("SEX").size()
print(sex)
print("percentages for SEX")
sex = mynesarc.groupby("SEX").size()*100/len(mynesarc)
print(sex)
print("counts for S4AQ1 - Felt depressed, sad, blue, or down for 2 weeks")
c1 = mynesarc["S4AQ1"].value_counts().sort_index(ascending=True)
print(c1)
print("percentages for S4AQ1 - Felt depressed, sad, blue, or down for 2 weeks")
p1 = mynesarc.groupby("S4AQ1").size()*100/len(mynesarc)
print(p1)
print("counts for S4AQ420A - Alcohol consume to improve mood")
c2 = mynesarc["S4AQ20A"].value_counts().sort_index(ascending=True)
print(c2)
print("percentages for S4AQ20A - Alcohol consume to improve mood")
p2 = mynesarc.groupby("S4AQ20A").size()*100/len(mynesarc)
print(p2)
print("counts for S4AQ21A - medicine/drug consume to improve mood")
c3 = mynesarc["S4AQ21A"].value_counts().sort_index(ascending=True)
print(c3)
print("percentages for S4AQ21A - medicine/drug consume to improve mood")
p3 = mynesarc.groupby("S4AQ21A").size()*100/len(mynesarc)
print(p3)
print("counts for S4BQ2 - Biological mother suffered from depression")
c4 = mynesarc["S4BQ2"].value_counts().sort_index(ascending=True)
print(c4)
print("percentages for S4BQ2 - Biological mother suffered from depression")
p4 = mynesarc.groupby("S4BQ2").size()*100/len(mynesarc)
print(p4)
#subset data to youth by range 15 to 24 (WHO reference) who have suffered from depression
subsetnew1 = mynesarc [(mynesarc["AGE"]>=15)&(mynesarc["AGE"]<=24)&(mynesarc["S4AQ1"]==1)]
#copy of new subset1 data frame
subset1 = subsetnew1.copy()
print("Counts for youth who have suffered from depression")
Count1 = subset1.groupby("S4AQ1").size()
print(Count1)
print("percentages for youth who have suffered from depression")
Per1 = subset1.groupby("S4AQ1").size()*100/len(subset1)
print(Per1)
print("Counts for SEX youth who have suffered from depression, 1=male")
Count2 = subset1.groupby("SEX").size()
print(Count2)
print("percentages for SEX youth who have suffered from depression, 1=male")
Per2 = subset1.groupby("SEX").size()*100/len(subset1)
print(Per2)
print("counts for youth AGE who have suffered from depression")
Count3 = subset1.groupby("AGE").size()
print(Count3)
print("Percentages for youth AGE who have suffered from depression")
Per3 = subset1.groupby("AGE").size()*100/len(subset1)
print(Per3)
print("counts for youth who have suffered from depression and had mother suffered from depression too, 1=yes")
Count4 = subset1.groupby("S4BQ2").size()
print(Count4)
print("percentages for youth who have suffered from depression and had mother suffered from depression too, 1=yes")
Per4 = subset1.groupby("S4BQ2").size()*100/len(subset1)
print(Per4)
print("Counts for youth who have suffered from depression and took alcohol to improve mood")
Count5 = subset1.groupby("S4AQ20A").size()
print(Count5)
print("percentages for youth who have suffered from depression and took alcohol to improve mood")
Per5 = subset1.groupby("S4AQ20A").size()*100/len(subset1)
print(Per5)
print("Counts for youth who have suffered from depression and took medicine/drugs to improve mood")
Count6 = subset1.groupby("S4AQ21A").size()
print(Count6)
print("Percentages for youth who have suffered from depression and took medicine/drugs to improve mood")
And the results of my own dataset are written below.
Counts for youth who have suffered from depression
S4AQ1
1 1445
dtype: int64
Counts for SEX youth who have suffered from depression, 1=male
SEX
1 561
2 884
dtype: int64
percentages for SEX youth who have suffered from depression, 1=male
SEX
1 38.823529
2 61.176471
dtype: float64
counts for youth AGE who have suffered from depression
AGE
18 205
19 194
20 195
21 199
22 218
23 199
24 235
dtype: int64
Percentages for youth AGE who have suffered from depression
AGE
18 14.186851
19 13.425606
20 13.494810
21 13.771626
22 15.086505
23 13.771626
24 16.262976
dtype: float64
counts for youth who have suffered from depression and had mother suffered from depression too, 1=yes
S4BQ2
1 595
2 708
9 142
dtype: int64
percentages for youth who have suffered from depression and had mother suffered from depression too, 1=yes
S4BQ2
1 41.176471
2 48.996540
9 9.826990
dtype: float64
Counts for youth who have suffered from depression and took alcohol to improve mood
S4AQ20A
453
1 214
2 776
9 2
dtype: int64
percentages for youth who have suffered from depression and took alcohol to improve mood
S4AQ20A
31.349481
1 14.809689
2 53.702422
9 0.138408
dtype: float64
Counts for youth who have suffered from depression and took medicine/drugs to improve mood
S4AQ21A
453
1 98
2 893
9 1
dtype: int64
Percentages for youth who have suffered from depression and took medicine/drugs to improve mood
S4AQ21A
31.349481
1 6.782007
2 61.799308
9 0.069204
dtype: float64
The results above show us that number of youth who suffered with depression is 1445 people with 61.18% of female and 38.82% of male. We can see another information about their family history, 41.18% of them had had their mothers suffered from depression as well. Besides, 14.81% of them did consume alcohol and 6.78% of them did consume drugs/medicine to improve their mood. Can we infer that women incline to suffer from depression as nearly twice to men? Also, can we say that there is no association between depressed people to their family history? And depressed people are not more likely to be alcohol/drugs dependence?
0 notes
Text
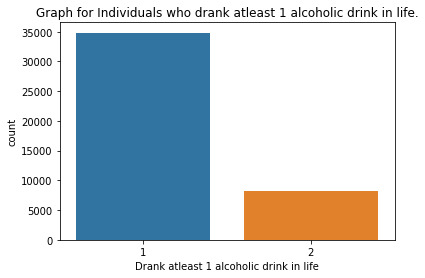
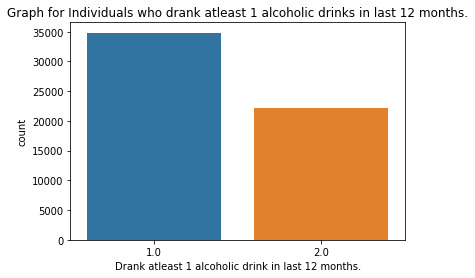
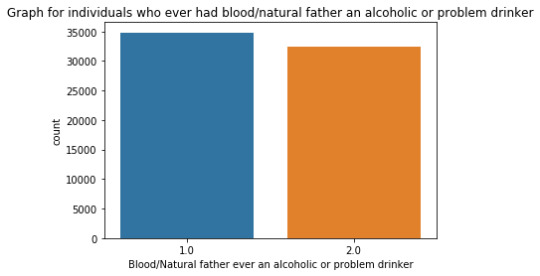
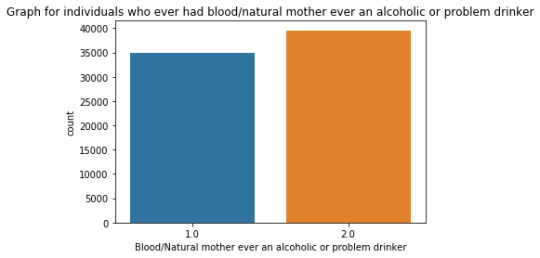
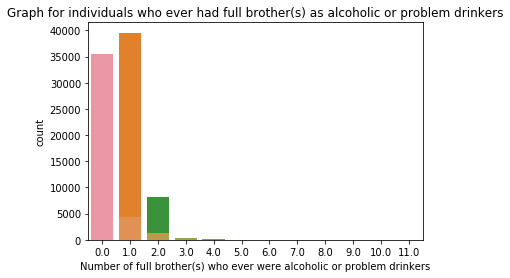
Week#04 DMV Assignment#04
Program:
""" author: vikramaditya pratap singh research question: how much the family history affects the alcohol consumption/alcohol dependence of an individual """ # S2AQ1 --> DRANK ATLEAST 1 ALCOHOLIC DRINK IN LIFE; Yes = 1, No = 2 # S2AQ2 --> DRANK ATLEAST 12 ALCOHOLIC DRINKS IN LAST 12 MONTHS; Yes = 1, No = 2, Unknown = 9 # S2AQ3 --> DRANK ATLEAST 1 ALCOHLIC DRINK IN LAST 12 MONTHS; Yes = 1, No = 2, Unknown = 9 # CONSUMER --> DRINKING STATUS; Current drinker = 1, Ex-drinker = 2, Lifetime Abstainer = 3 # S2DQ1 --> BLOOD/NATURAL FATHER EVER AN ALCOHOLIC OR PROBLEM DRINKER; Yes = 1, No = 2, Unknown = 9 # S2DQ2 --> BLOOD/NATURAL MOTHER EVER AN ALCOHOLIC OR PROBLEM DRINKER; Yes = 1, No = 2, Unknown = 9 # S2DQ3C1 --> NUMBER OF FULL BROTHERS WHO WERE EVER ALCOHOLICS OR PROBLEM DRINKERS; Full Brother(s) = 0-11, Unknown = 99 # S2DQ4C1 --> NUMBER OF FULL SISTERS WHO WERE EVER ALCOHOLICS OR PROBLEM DRINKERS; Full Sister(s) = 0-9, Unknown = 99 import pandas as pd import numpy as np import seaborn as sb import matplotlib.pyplot as plt # loading up the data frame being used dataFrame = pd.read_csv('nesarc_pds.csv', low_memory = False) totalObservation = len(dataFrame) totalVariable = len(dataFrame.columns) print("Total number of observations/rows =", totalObservation) print("Total number of variables/columns =", totalVariable) # converting each variable to numeric data type dataFrame['S2AQ1'] = pd.to_numeric(dataFrame['S2AQ1']) dataFrame['S2AQ2'] = pd.to_numeric(dataFrame['S2AQ2']) dataFrame['S2AQ3'] = pd.to_numeric(dataFrame['S2AQ3']) dataFrame['CONSUMER'] = pd.to_numeric(dataFrame['CONSUMER']) dataFrame['S2DQ1'] = pd.to_numeric(dataFrame['S2DQ1']) dataFrame['S2DQ2'] = pd.to_numeric(dataFrame['S2DQ2']) dataFrame['S2DQ3C1'] = pd.to_numeric(dataFrame['S2DQ3C1']) dataFrame['S2DQ4C1'] = pd.to_numeric(dataFrame['S2DQ4C1']) # setting the "Unknown" data as NaN from variables S2AQ2, S2AQ3, S2DQ1, S2DQ2, S2DQ3C1, S2DQ4C1 dataFrame['S2AQ2'] = dataFrame['S2AQ2'].replace(9, np.nan) dataFrame['S2AQ3'] = dataFrame['S2AQ3'].replace(9, np.nan) dataFrame['S2DQ1'] = dataFrame['S2DQ1'].replace(9, np.nan) dataFrame['S2DQ2'] = dataFrame['S2DQ2'].replace(9, np.nan) dataFrame['S2DQ3C1'] = dataFrame['S2DQ3C1'].replace(99, np.nan) dataFrame['S2DQ4C1'] = dataFrame['S2DQ4C1'].replace(99, np.nan) # count and frequency distribution for I variable print("COUNT FOR: DRANK ATLEAST 1 ALCOHOLIC DRINK IN LIFE; Yes = 1, No = 2") count1 = dataFrame['S2AQ1'].value_counts(sort = False, dropna = False) print(count1) print("%AGE FOR: DRANK ATLEAST 1 ALCOHOLIC DRINK IN LIFE; Yes = 1, No = 2") perc1 = dataFrame['S2AQ1'].value_counts(sort = False, normalize = True, dropna = False) print(perc1) # count and frequency distribution for II variable print("COUNT FOR: DRANK ATLEAST 12 ALCOHOLIC DRINKS IN LAST 12 MONTHS; Yes = 1, No = 2, Unknown = 9") count2 = dataFrame['S2AQ2'].value_counts(sort = False, dropna = False) print(count2) print("%AGE FOR: DRANK ATLEAST 12 ALCOHOLIC DRINKS IN LAST 12 MONTHS; Yes = 1, No = 2, Unknown = 9") perc2 = dataFrame['S2AQ2'].value_counts(sort = False, normalize = True, dropna = False) print(perc2) # count and frequency distribution for III variable print("COUNT FOR: DRANK ATLEAST 1 ALCOHOLIC DRINK IN LAST 12 MONTHS; Yes = 1, No = 2, Unknown = 9") count3 = dataFrame['S2AQ3'].value_counts(sort = False, dropna = False) print(count3) print("%AGE FOR: DRANK ATLEAST 1 ALCOHOLIC DRINK IN LAST 12 MONTHS; Yes = 1, No = 2, Unknown = 9") perc3 = dataFrame['S2AQ3'].value_counts(sort = False, normalize = True, dropna = False) print(perc3) # count and frequency distribution for IV variable print("COUNT FOR: DRINKING STATUS; Current drinker = 1, Ex-drinker = 2, Lifetime Abstainer = 3") count4 = dataFrame['CONSUMER'].value_counts(sort = False, dropna = False) print(count4) print("%AGE FOR: DRINKING STATUS; Current drinker = 1, Ex-drinker = 2, Lifetime Abstainer = 3") perc4 = dataFrame['CONSUMER'].value_counts(sort = False, normalize = True, dropna = False) print(perc4) # count and frequency distribution for V variable print("COUNT FOR: BLOOD/NATURAL FATHER EVER AN ALCOHOLIC OR PROBLEM DRINKER; Yes = 1, No = 2, Unknown = 9") count5 = dataFrame['S2DQ1'].value_counts(sort = False, dropna = False) print(count5) print("%AGE FOR: BLOOD/NATURAL FATHER EVER AN ALCOHOLIC OR PROBLEM DRINKER; Yes = 1, No = 2, Unknown = 9") perc5 = dataFrame['S2DQ1'].value_counts(sort = False, normalize = True, dropna = False) print(perc5) # count and frequency distribution for VI variable print("COUNT FOR: BLOOD/NATURAL MOTHER EVER AN ALCOHOLIC OR PROBLEM DRINKER; Yes = 1, No = 2, Unknown = 9") count6 = dataFrame['S2DQ2'].value_counts(sort = False, dropna = False) print(count6) print("%AGE FOR: BLOOD/NATURAL MOTHER EVER AN ALCOHOLIC OR PROBLEM DRINKER; Yes = 1, No = 2, Unknown = 9") perc6 = dataFrame['S2DQ2'].value_counts(sort = False, normalize = True, dropna = False) print(perc6) # count and frequency distribution for VII variable print("COUNT FOR: NUMBER OF FULL BROTHERS WHO WERE EVER ALCOHOLICS OR PROBLEM DRINKERS; Full Brother(s) = 0-11, Unknown = 99") count7 = dataFrame['S2DQ3C1'].value_counts(sort = False, dropna = False) print(count7) print("%AGE FOR: NUMBER OF FULL BROTHERS WHO WERE EVER ALCOHOLICS OR PROBLEM DRINKERS; Full Brother(s) = 0-11, Unknown = 99") perc7 = dataFrame['S2DQ3C1'].value_counts(sort = False, normalize = True, dropna = False) print(perc7) # count and frequency distribution for VIII variable print("COUNT FOR: NUMBER OF FULL SISTERS WHO WERE EVER ALCOHOLICS OR PROBLEM DRINKERS; Full Sister(s) = 0-9, Unknown = 99") count8 = dataFrame['S2DQ4C1'].value_counts(sort = False, dropna = False) print(count8) print("%AGE FOR: NUMBER OF FULL SISTERS WHO WERE EVER ALCOHOLICS OR PROBLEM DRINKERS; Full Sister(s) = 0-9, Unknown = 99") perc8 = dataFrame['S2DQ4C1'].value_counts(sort = False, normalize = True, dropna = False) print(perc8) # changing format from numeric to categorical dataFrame['S2AQ1'] = dataFrame['S2AQ1'].astype('category') dataFrame['S2AQ2'] = dataFrame['S2AQ2'].astype('category') dataFrame['S2AQ3'] = dataFrame['S2AQ3'].astype('category') dataFrame['CONSUMER'] = dataFrame['CONSUMER'].astype('category') dataFrame['S2DQ1'] = dataFrame['S2DQ1'].astype('category') dataFrame['S2DQ2'] = dataFrame['S2DQ2'].astype('category') dataFrame['S2DQ3C1'] = dataFrame['S2DQ3C1'].astype('category') dataFrame['S2DQ4C1'] = dataFrame['S2DQ4C1'].astype('category') # graphing a univariate graph for each variable # univariate graph for I variable sb.countplot(x = "S2AQ1", data = dataFrame) plt.xlabel('Drank atleast 1 alcoholic drink in life') plt.title('Graph for Individuals who drank atleast 1 alcoholic drink in life.') # univariate graph for II variable sb.countplot(x = 'S2AQ2', data = dataFrame) plt.xlabel('Drank atleast 12 alcoholic drinks in 12 months') plt.title('Graph for Individuals who drank atleast 12 alcoholic drinks in 12 months.') # univariate graph for III variable sb.countplot(x = 'S2AQ3', data = dataFrame) plt.xlabel('Drank atleast 1 alcoholic drink in last 12 months.') plt.title('Graph for Individuals who drank atleast 1 alcoholic drinks in last 12 months.') # univariate graph for IV variable sb.countplot(x = 'CONSUMER', data = dataFrame) plt.xlabel('Drinking Status') plt.title('Graph of drinking status of individuals') # univariate graph for V variable sb.countplot(x = 'S2DQ1', data = dataFrame) plt.xlabel('Blood/Natural father ever an alcoholic or problem drinker') plt.title('Graph for individuals who ever had blood/natural father an alcoholic or problem drinker') # univariate graph for VI variable sb.countplot(x = 'S2DQ2', data = dataFrame) plt.xlabel('Blood/Natural mother ever an alcoholic or problem drinker') plt.title('Graph for individuals who ever had blood/natural mother ever an alcoholic or problem drinker') # univariate graph for VII variable sb.countplot(x = 'S2DQ3C1', data = dataFrame) plt.xlabel('Number of full brother(s) who ever were alcoholic or problem drinkers') plt.title('Graph for individuals who ever had full brother(s) as alcoholic or problem drinkers') # univariate graph for VIII variable sb.countplot('S2DQ4C1', data = dataFrame) plt.xlabel('Number of full sister(s) who ever were alcoholic or problem drinkers') plt.title('Graph for individuals who ever had full sister(s) as alcoholic or problem drinkers') # summary of each variable # description of I variable print('Description of Individuals who drank atleast 1 alcoholic drink in life') desc1 = dataFrame['S2AQ1'].describe() print(desc1) # description of II variable print('Description of Individuals who drank atleast 12 alcoholic drinks in last 12 months') desc2 = dataFrame['S2AQ2'].describe() print(desc2) # description of III variable print('Description of Individuals who drank atleast 1 alcoholic drink in last 12 months') desc3 = dataFrame['S2AQ3'].describe() print(desc3) # description of IV variable print('Description of drinking status of individuals') desc4 = dataFrame['CONSUMER'].describe() print(desc4) # description of V variable print('Description of individuals who ever had a blood/natural father an alcoholic or problem drinker') desc5 = dataFrame['S2DQ1'].describe() print(desc5) # description of VI variable print('Description of individuals who ever had a blood/natural mother an alcoholic or problem drinker') desc6 = dataFrame['S2DQ2'].describe() print(desc6) # description of VII variable print('Description of individuals who ever had a full brother(s) an alcoholic or problem drinker') desc7 = dataFrame['S2DQ3C1'].describe() print(desc7) # description of VIII variable print('Description of individuals who ever had a full sister(s) an alcoholic or problem drinker') desc8 = dataFrame['S2DQ4C1'].describe() print(desc8) # converting 1 variable to numeric before a bivariate graph dataFrame['S2DQ1'] = pd.to_numeric(dataFrame['S2DQ1']) # bivariate graph to get the association in drinking status and alcoholic situation of father sb.catplot(x = 'S2DQ1', y = 'CONSUMER', data = dataFrame, kind = 'bar', ci = None) plt.xlabel('Blood/Natural Father ever an alcoholic or problem drinker') plt.ylabel('Drinking status')
Output:
runfile('E:/data_management_and_visualization/script#01.py', wdir='E:/data_management_and_visualization') Total number of observations/rows = 43093 Total number of variables/columns = 3010 COUNT FOR: DRANK ATLEAST 1 ALCOHOLIC DRINK IN LIFE; Yes = 1, No = 2 1 34827 2 8266 Name: S2AQ1, dtype: int64 %AGE FOR: DRANK ATLEAST 1 ALCOHOLIC DRINK IN LIFE; Yes = 1, No = 2 1 0.808182 2 0.191818 Name: S2AQ1, dtype: float64 COUNT FOR: DRANK ATLEAST 12 ALCOHOLIC DRINKS IN LAST 12 MONTHS; Yes = 1, No = 2, Unknown = 9 2.0 22225 1.0 20836 NaN 32 Name: S2AQ2, dtype: int64 %AGE FOR: DRANK ATLEAST 12 ALCOHOLIC DRINKS IN LAST 12 MONTHS; Yes = 1, No = 2, Unknown = 9 2.0 0.515745 1.0 0.483512 NaN 0.000743 Name: S2AQ2, dtype: float64 COUNT FOR: DRANK ATLEAST 1 ALCOHOLIC DRINK IN LAST 12 MONTHS; Yes = 1, No = 2, Unknown = 9 2.0 16116 1.0 26946 NaN 31 Name: S2AQ3, dtype: int64 %AGE FOR: DRANK ATLEAST 1 ALCOHOLIC DRINK IN LAST 12 MONTHS; Yes = 1, No = 2, Unknown = 9 2.0 0.373982 1.0 0.625299 NaN 0.000719 Name: S2AQ3, dtype: float64 COUNT FOR: DRINKING STATUS; Current drinker = 1, Ex-drinker = 2, Lifetime Abstainer = 3 1 26946 2 7881 3 8266 Name: CONSUMER, dtype: int64 %AGE FOR: DRINKING STATUS; Current drinker = 1, Ex-drinker = 2, Lifetime Abstainer = 3 1 0.625299 2 0.182884 3 0.191818 Name: CONSUMER, dtype: float64 COUNT FOR: BLOOD/NATURAL FATHER EVER AN ALCOHOLIC OR PROBLEM DRINKER; Yes = 1, No = 2, Unknown = 9 1.0 8124 2.0 32445 NaN 2524 Name: S2DQ1, dtype: int64 %AGE FOR: BLOOD/NATURAL FATHER EVER AN ALCOHOLIC OR PROBLEM DRINKER; Yes = 1, No = 2, Unknown = 9 1.0 0.188522 2.0 0.752907 NaN 0.058571 Name: S2DQ1, dtype: float64 COUNT FOR: BLOOD/NATURAL MOTHER EVER AN ALCOHOLIC OR PROBLEM DRINKER; Yes = 1, No = 2, Unknown = 9 2.0 39553 1.0 2311 NaN 1229 Name: S2DQ2, dtype: int64 %AGE FOR: BLOOD/NATURAL MOTHER EVER AN ALCOHOLIC OR PROBLEM DRINKER; Yes = 1, No = 2, Unknown = 9 2.0 0.917852 1.0 0.053628 NaN 0.028520 Name: S2DQ2, dtype: float64 COUNT FOR: NUMBER OF FULL BROTHERS WHO WERE EVER ALCOHOLICS OR PROBLEM DRINKERS; Full Brother(s) = 0-11, Unknown = 99 5.0 44 0.0 35428 1.0 4408 2.0 1278 4.0 126 8.0 2 9.0 3 10.0 1 11.0 1 NaN 1464 3.0 283 6.0 42 7.0 13 Name: S2DQ3C1, dtype: int64 %AGE FOR: NUMBER OF FULL BROTHERS WHO WERE EVER ALCOHOLICS OR PROBLEM DRINKERS; Full Brother(s) = 0-11, Unknown = 99 5.0 0.001021 0.0 0.822129 1.0 0.102290 2.0 0.029657 4.0 0.002924 8.0 0.000046 9.0 0.000070 10.0 0.000023 11.0 0.000023 NaN 0.033973 3.0 0.006567 6.0 0.000975 7.0 0.000302 Name: S2DQ3C1, dtype: float64 COUNT FOR: NUMBER OF FULL SISTERS WHO WERE EVER ALCOHOLICS OR PROBLEM DRINKERS; Full Sister(s) = 0-9, Unknown = 99 0.0 39090 2.0 708 1.0 1847 4.0 43 6.0 4 8.0 1 9.0 1 5.0 13 NaN 1298 3.0 83 7.0 5 Name: S2DQ4C1, dtype: int64 %AGE FOR: NUMBER OF FULL SISTERS WHO WERE EVER ALCOHOLICS OR PROBLEM DRINKERS; Full Sister(s) = 0-9, Unknown = 99 0.0 0.907108 2.0 0.016430 1.0 0.042861 4.0 0.000998 6.0 0.000093 8.0 0.000023 9.0 0.000023 5.0 0.000302 NaN 0.030121 3.0 0.001926 7.0 0.000116 Name: S2DQ4C1, dtype: float64 Description of Individuals who drank atleast 1 alcoholic drink in life count 43093 unique 2 top 1 freq 34827 Name: S2AQ1, dtype: int64 Description of Individuals who drank atleast 12 alcoholic drinks in last 12 months count 43061.0 unique 2.0 top 2.0 freq 22225.0 Name: S2AQ2, dtype: float64 Description of Individuals who drank atleast 1 alcoholic drink in last 12 months count 43062.0 unique 2.0 top 1.0 freq 26946.0 Name: S2AQ3, dtype: float64 Description of drinking status of individuals count 43093 unique 3 top 1 freq 26946 Name: CONSUMER, dtype: int64 Description of individuals who ever had a blood/natural father an alcoholic or problem drinker count 40569.0 unique 2.0 top 2.0 freq 32445.0 Name: S2DQ1, dtype: float64 Description of individuals who ever had a blood/natural mother an alcoholic or problem drinker count 41864.0 unique 2.0 top 2.0 freq 39553.0 Name: S2DQ2, dtype: float64 Description of individuals who ever had a full brother(s) an alcoholic or problem drinker count 41629.0 unique 12.0 top 0.0 freq 35428.0 Name: S2DQ3C1, dtype: float64 Description of individuals who ever had a full sister(s) an alcoholic or problem drinker count 41795.0 unique 10.0 top 0.0 freq 39090.0 Name: S2DQ4C1, dtype: float64
Graphs/Plots:


Summary:
As my variables were categorical it was not useful to do a quantitative analysis hence all the graphs are of categorical analysis. The "Graphs/Plots" section includes all the univariate and bivariate graphs.
0 notes
Text
Micro-Learning Market by Manufacturers, Type and Application, Regions, Segmentation and Forecast to 2023
Market Overview
The global micro-learning market 2020 was worth USD 1.09 Billion in 2019, reveals Market Research Future (MRFR). After careful analysis, MRFR concludes that the market can achieve a growth rate of 14.6% during the forecast period (2018 to 2025).
Prominent Companies
Some of the significant growth influencers in the global market for Micro-Learning are SwissVBS (Canada), iSpring Solutions (US), mLevel (US), Crossknowledge (US), Qstream (US), IBM Corporation (US), Bigtincan (US), Saba Software (US), Mindtree (US), Count5 (US), Pryor Learning Solutions (US), Cornerstone OnDemand (US), Epignosis (US), Gnowbe (Singapore), Axonify (Canada), and others.
Get Free Sample of Report @ https://www.marketresearchfuture.com/sample_request/8688
Top Drivers and Primary Barriers
Corporate training programs have undergone a massive change with respect to learning methodologies. The conventional form of classroom training is now being replaced by online learning, allowing flexibility to the learners. Organizations around the world are now more focused on offering an enhanced learning experience to their employees via innovative learning as well as development activities that are highly interactive and much more interesting. Keeping in mind the skill and understanding of the learner, more and more companies are adopting online training methods that can fulfill the learning objective.
Some of the prime growth boosters in the market are the mounting demand for deskless training coupled with the increasingly mobile workforce across different industries. Also, the soaring demand for skill-based as well as result-oriented training can lead the market to a better position in the following years.
A lucrative opportunity for the micro-learning solution vendors can be in the form of gamification of training and education. The rising use of advanced technologies like VR, AR, ML, AI, as well as mobile technology is another aspect that can be tapped into by the renowned players in the market.
Market Segmentation
The global market for micro-learning has been segmented with regard to Component, Deployment, Organization Size, and Vertical.
Component-wise, the micro-learning market has been considered for solutions and services. The services segment has been split into consulting and implementation, as well as support and maintenance.
Deployment-based market segments are cloud and on-premise.
The organization sizes studied in the report are small-and-medium-sized enterprises (SME) along with large enterprises.
The verticals covered in the MRFR report are healthcare and life sciences, manufacturing and logistics, retail, BFSI, telecom and IT, and others. In the healthcare and life sciences industry, microlearning is widely deployed in laboratories, research labs and hospitals to facilitate learning on the go. The manufacturing and logistics industry makes a strong demand for microlearning since it is used to elevate the efficiency of workers, in addition to maintaining and enhancing the quality along with ensuring the compliance of safety policies.
Get Full Report @ https://www.marketresearchfuture.com/reports/micro-learning-market-8688
Regional Outlook
The market for micro-learning seems to be progressing at a striking rate and can achieve great success during the forecast period. MRFR experts anticipate that the micro-learning market can note significant growth in the primary regions of Europe, North America, Asia Pacific (APAC), the Middle East & Africa (MEA), as well as South America.
North America spearheads the global market for microlearning, backed by the increasing use of eLearning tools, paired with the high adoption rate of handheld devices. Some of the popular handheld devices in the region are tablets and mobile phones. The United States (US) is the leading market in the region, thanks to a large number of technological innovations in learning methodologies compared to other countries like Mexico and Canada. A number of organizations in the region are striving to elevate their return on investment in employee training as well as skill development, with the aim to improve their productivity in the long run.
Europe has claimed the second spot in the global market for microlearning, on account of the enterprises increasingly making use of handheld devices, given the convenience of use. The presence of a large number of well-known players, coupled with numerous startups that offer advanced microlearning solutions, also propel the market growth in the region.
APAC can race ahead at the fastest rate in the years to follow, led by emerging countries like Japan and China. The rising need for skill-based, as well as result-oriented training among enterprises, is believed to be one of the chief factors promoting market growth in APAC. Apart from this, the growing use of eLearning tools, surging adoption of handheld devices, like tablets and mobile phones, and the surge in technological development in learning methodologies seem to be helping the market progress at a striking pace in the region.
About Market Research Future:
At Market Research Future (MRFR), we enable our customers to unravel the complexity of various industries through our Cooked Research Report (CRR), Half-Cooked Research Reports (HCRR), Raw Research Reports (3R), Continuous-Feed Research (CFR), and Market Research & Consulting Services.
Contact:
Market Research Future
+1 646 845 9312
Email: [email protected]
0 notes
Text
Microlearning Market Size, Growth, Statistics & Forecast Research Report 2021-2024
According to a research report "Microlearning Market by Component (Solution and Services), Organization Size, Deployment Type, Industry (Retail, Manufacturing and Logistics, BFSI, Telecom and IT, Healthcare and Life Sciences), and Region - Global Forecast to 2024", published by MarketsandMarkets, the global microlearning market size is expected to grow from USD 1.5 billion in 2019 to USD 2.7 billion by 2024, at a Compound Annual Growth Rate (CAGR) of 13.2% during the forecast period. Increasing demand for training deskless and mobile workers across industries and growing need for skills-based and result-oriented training among enterprises are the major factors driving the growth of the microlearning market.
Download PDF Brochure @ https://www.marketsandmarkets.com/pdfdownloadNew.asp?id=127184631
The solutions segment of microlearning to hold the highest market share during the forecast period
Corporate training programs are undergoing a transformation in their learning methodologies. Traditional methods of classroom training are steadily overtaken by online methods of learning that offer flexibility to learners. Enterprises are focusing on offering enhanced learning experience to employees through various learning and development activities, which are more interesting and engaging. Hence, businesses are keen on adopting training methods that are directly inclined toward a learning objective, which focuses on particular skills or understanding of compliance. The microlearning solution providers are competing with each other to increase their market coverage and expand their presence in newer markets.
Healthcare and life sciences to grow at a significant CAGR during the forecast period
In the healthcare industry, microlearning is used in hospitals, laboratories, and research labs to enable on-the-go learning. Medical practitioners need to update their knowledge and skills to provide the latest treatment to customers/patients. Keeping employees updated about new medical devices and pharmaceutical products is another key aspect of the training and development module in the healthcare industry. The growing demand for advanced eLearning technologies, such as 3D images of internal organs and live interaction with experts, is expected to drive the demand for microlearning solution and services in the healthcare industry, accounting for its highest share among all the industries.
North America to hold the highest market share during the forecast period
The increase in use of eLearning tools, growth in adoption of handheld devices, such as tablets and mobile phones, and technological advancements in learning methodologies have boosted the growth of the microlearning market in North America. In this region, enterprises have become more dependent on handheld devices for better results and convenience of use. With the help of mobile devices, multiple employees, even if they are geographically dispersed, can simultaneously be trained. This capability has drastically helped the corporate sector cut down expenses for the training of employees, and is one of the major factors encouraging corporates to adopt microlearning over the traditional training methods.
The major vendors in the microlearning market are Saba Software (US), Mindtree (India), Axonify (Canada), IBM (US), Bigtincan (US), SwissVBS (Canada), iSpring Solutions (US), Epignosis (US), Cornerstone OnDemand (US), Qstream (US), Pryor Learning Solutions (US), count5 (US), mLevel (US), Gnowbe (US), Trivantis (US), SweetRush (US), Multiversity (India), and Neovation Learning Solutions (Canada).
Browse in-depth TOC on Complete Report @ https://www.marketsandmarkets.com/Market-Reports/microlearning-market-127184631.html
0 notes
Text
DATA VISUALIZATION: WK 3 CODE
# -*- coding: utf-8 -*- """ Created on Sat May 2 14:35:08 2020
@author: 302016160 """
import pandas import numpy import matplotlib.pyplot as plt
# any additional libraries would be imported here
data = pandas.read_csv('marscrater_pds_study.csv', low_memory=False)
Frq1 = data['MORPHOLOGY_EJECTA_1'].value_counts(sort=False)
pandas.set_option('display.float_format', lambda x:'%f'%x)
## My data has a few Blank Spaces in data['MORPHOLOGY_EJECTA_1'] # Also filters data for NE Zone
sub1=data[(data['MORPHOLOGY_EJECTA_1']!=' ')&(data['LATITUDE_CIRCLE_IMAGE']>=0) & (data['LONGITUDE_CIRCLE_IMAGE']>=0)]
sub1['DIAMETER']=pandas.qcut(sub1.DIAM_CIRCLE_IMAGE, 5, labels=["1=0%tile","2=20%tile","3=40%tile","4=60%tile","5=80%tile"]) c4 = sub1['DIAMETER'].value_counts(sort=False, dropna=True) c4p = sub1['DIAMETER'].value_counts(sort=False, normalize=True) print(c4) print(c4p)
sub1['DIA_GROUP'] = pandas.cut(sub1.DIAM_CIRCLE_IMAGE, [0.001,5, 10, 50,100, 200,400]) c5 = sub1['DIA_GROUP'].value_counts(sort=False, dropna=True) c5p = sub1['DIA_GROUP'].value_counts(sort=False, normalize=True) print(c5) print(c5p)
#crosstabs evaluating which ages were put into which DIA_GROUP print (pandas.crosstab(sub1['DIA_GROUP'], sub1['DIAM_CIRCLE_IMAGE']))
LAT_min = sub1['LATITUDE_CIRCLE_IMAGE'].min() LAT_max = sub1['LATITUDE_CIRCLE_IMAGE'].max() LON_min = sub1['LONGITUDE_CIRCLE_IMAGE'].min() LON_max = sub1['LONGITUDE_CIRCLE_IMAGE'].max()
LAT_RANGE = numpy.zeros((5)) LON_RANGE = numpy.zeros((5))
for i in range(5): LAT_RANGE[i] = LAT_min + i*(LAT_max-LAT_min)/4 LON_RANGE[i] = LON_min + i*(LON_max-LON_min)/4
sub1['LAT_GROUP'] = pandas.cut(sub1.LATITUDE_CIRCLE_IMAGE, list(LAT_RANGE)) c6 = sub1['LAT_GROUP'].value_counts(sort=False, dropna=True) c6p = sub1['LAT_GROUP'].value_counts(sort=False, normalize=True) print(c6) print(c6p)
sub1['LON_GROUP'] = pandas.cut(sub1.LONGITUDE_CIRCLE_IMAGE, list(LON_RANGE)) c7 = sub1['LON_GROUP'].value_counts(sort=False, dropna=True) c7p = sub1['LON_GROUP'].value_counts(sort=False, normalize=True) print(c7) print(c7p)
def LOC_NE_Zone (row): if row['LONGITUDE_CIRCLE_IMAGE'] > 0.0 and row['LONGITUDE_CIRCLE_IMAGE'] <= 44.998: return 1 elif row['LONGITUDE_CIRCLE_IMAGE'] > 44.998 and row['LONGITUDE_CIRCLE_IMAGE'] <= 89.996: return 2 elif row['LONGITUDE_CIRCLE_IMAGE'] > 89.996 and row['LONGITUDE_CIRCLE_IMAGE'] <= 134.993: return 3 elif row['LONGITUDE_CIRCLE_IMAGE'] > 134.993 and row['LONGITUDE_CIRCLE_IMAGE'] <= 179.991: return 4 else: return 5
def LAT_NE_Zone (row): if row['LATITUDE_CIRCLE_IMAGE'] > 0.0 and row['LATITUDE_CIRCLE_IMAGE'] <= 20.45: return 1 elif row['LATITUDE_CIRCLE_IMAGE'] > 20.45 and row['LATITUDE_CIRCLE_IMAGE'] <= 40.901: return 2 elif row['LATITUDE_CIRCLE_IMAGE'] > 40.901 and row['LATITUDE_CIRCLE_IMAGE'] <= 61.351: return 3 elif row['LATITUDE_CIRCLE_IMAGE'] > 61.351 and row['LATITUDE_CIRCLE_IMAGE'] <= 81.802: return 4 else: return 5
def MORP_NE_Zone (row): if row['MORPHOLOGY_EJECTA_1'] == 'Rd': return 'Rd' elif row['MORPHOLOGY_EJECTA_1'] == 'SLERS': return 'SLERS' elif row['MORPHOLOGY_EJECTA_1'] == 'SLEPS': return 'SLEPS' else: return 'OTHERS'
sub1['LAT_GROUP_NUM'] = sub1.apply (lambda row: LAT_NE_Zone (row),axis=1) sub1['LOC_GROUP_NUM'] = sub1.apply (lambda row: LOC_NE_Zone (row),axis=1) sub1['MORPH_TYPE'] = sub1.apply (lambda row: MORP_NE_Zone (row),axis=1)
sub3 = sub1.set_index(['LAT_GROUP_NUM', 'LOC_GROUP_NUM'])['DIAM_CIRCLE_IMAGE']
COUNT = sub1.groupby(['LAT_GROUP_NUM', 'LOC_GROUP_NUM'])['DIAM_CIRCLE_IMAGE'].mean() COUNT1 = sub1.groupby(['LAT_GROUP', 'LON_GROUP'])['DIAM_CIRCLE_IMAGE'].mean() COUNT2 = sub1.groupby(['LAT_GROUP', 'LON_GROUP'])['DIAM_CIRCLE_IMAGE'].max() COUNT3 = sub1.groupby(['LAT_GROUP', 'LON_GROUP'])['DIAM_CIRCLE_IMAGE'].min() COUNT4 = sub1.groupby(['LAT_GROUP', 'LON_GROUP'])['DIAM_CIRCLE_IMAGE'].count() COUNT41 = sub1.groupby(['LAT_GROUP', 'LON_GROUP'])['DIAM_CIRCLE_IMAGE'].std()
COUNT2 = sub1.groupby(['LAT_GROUP', 'LON_GROUP'])['DIAM_CIRCLE_IMAGE'].max() COUNT3 = sub1.groupby(['LAT_GROUP', 'LON_GROUP'])['DIAM_CIRCLE_IMAGE'].min() COUNT5 = sub1.groupby(['LAT_GROUP', 'LON_GROUP','MORPH_TYPE'])['DIAM_CIRCLE_IMAGE'].count()
0 notes
Text
Microlearning Industry 2021 COVID-19 Pandemic Impact, Regional Analysis and Growth by Forecast to 2027
Global Micro-learning Market Synopsis
According to MRFR, the Global Micro-learning Market size was valued at USD 1.09 Billion in 2019 and is poised to record a CAGR of 14.6% during the review period.
There is increasing demand for less training desk and mobile workers across verticals which is a major factor responsible for market growth. Apart from that, another main factor driving the global micro-learning market is the increasing need for skill-based and result-oriented training among companies. Nonetheless, corporations' reluctance to invest an immense amount on turning existing training content into microcontent is expected to curb market growth. The biggest incentive for the providers of micro-learning solutions is to gamify training and education. The use of advanced technologies such as AR , VR, AI, ML and mobile technology is growing, which is another sector for key players to tap into.
Get Free Sample Copy at: https://www.marketresearchfuture.com/sample_request/8688
Market Segmentation
The Global Micro-Learning Market has been segmented based on Vertical, Deployment, Component, Organization Size, and Region.
The global demand for micro-learning has been divided by Component into products and services. The division of resources was further broken down into two segments: consultation and implementing, and support and maintenance.
The Global Micro-Learning Market was broken down into cloud and on-premise by implementation. Over the forecast period, the on-site microlearning solution had a greater market share as these solutions allow companies to develop, store and deliver business-critical data on the server of the company and track access to training programs.
The global micro-learning market was divided into small and medium-sized enterprises ( SMEs) and large companies, depending on the size of the organizations. During the forecast period the broad enterprise segment is projected to hold the largest market share. The SME group, however, is also expected to hold a larger market over a number of verticals as opposed to its previous share.
The global micro-learning market was divided up vertically into retail, manufacturing and logistics, finance, financial services and insurance, telecommunications and IT, healthcare and life sciences, and others.
Regional Outlook
The geographic overivew of the global micro-learning market has been done for the Middle East & Africa, North America, Europe, Asia-Pacific, and South America.
Thanks to the ever-increasing use of eLearning devices, North America has the highest market share as well as the rise of handheld computer adoption. Such tools include cell phones and tablets. Owing to the greater number of technical advancements in learning methodologies compared to Canada and Mexico, the US dominates the market in North America.
In the study era, Europe is projected to be the second-largest market, as businesses use handheld devices on a wide scale across verticals due to ease of usage. Workers located at different locations can be trained concurrently with the help of mobile devices by which the enterprises can save the expenditures for training employees. Because of these benefits, the firms are increasingly adopting microlearning over the region's traditional methods of training. In the forecast period Asia-Pacific is projected to be the fastest-growing segment on the global micro-learning market. The demand is expected to expand at a rapid pace in countries such as China and Japan in the coming years. The the need for skill-based and result-oriented training between companies is a key driver of market growth in Asia-Pacific.
Competitive Dashboard
The Key Players are Bigtincan (US), Count5 (US), SwissVBS (Canada), Pryor Learning Solutions (US), Gnowbe (Singapore), Crossknowledge (US), mLevel (US), Saba Software (US), Axonify (Canada), iSpring Solutions (US), Mindtree (US), Epignosis (US), IBM Corporation (US), Cornerstone OnDemand (US) and Qstream (US). The major strategies implemented by most of the players are agreements, partnerships, and collaborations.
The other players in the market are Multiversity (India), Gameffective (US), EdApp (Australia), Grovo (US), SweetRush (US), Trivantis (US), Neovation Learning Solutions (Canada) among others.
Get Complete Report Details at: https://www.marketresearchfuture.com/reports/micro-learning-market-8688
About Market Research Future:
At Market Research Future (MRFR), we enable our customers to unravel the complexity of various industries through our Cooked Research Report (CRR), Half-Cooked Research Reports (HCRR), Raw Research Reports (3R), Continuous-Feed Research (CFR), and Market Research & Consulting Services.
Contact:
Market Research Future
+1 646 845 9312
Email: [email protected]
0 notes
Link
Many Sunscreens Are Toxic and Only Half as Effective as Claimed Dr. Mercola By Dr. Mercola While regular, consistent, sensible sun exposure is vital for optimal health and well-being — having many benefits beyond vitamin D production — overexposure can result in skin damage that could raise your risk of skin cancer. This means if you’re spending the day at the beach or engaging in outdoor activities for hours at a stretch, you likely need to bring some form of sun protection. While clothing is an ideal choice, most people opt for sunscreen, which can have a number of adverse ramifications. Not only do many sunscreens contain toxic ingredients, many are also only half as effective as claimed. Consumer Reports recently issued its 2018 Sunscreen Buying Guide,1 which notes that testing reveals more than 70 sunscreen products do not provide the level of UVB protection stated on the label. As a result, you may end up getting sunburned anyway. The report also found that only a dozen or so products offered decent protection against both UVA and UVB rays. Can You Trust the Sun Protection Factor? Sun protection factor (SPF) is a measure of how long the product will prevent your skin from burning when exposed to UVB rays. “For example, assuming you apply — and reapply — the sunscreen correctly, if you'd normally burn after 20 minutes in the sun, an SPF 30 protects for about 10 hours,” Consumer Reports explains. However, it’s important to realize that the SPF applies to UVB rays only, and not UVA, which are actually responsible for most of the UV damage. To protect against UVA, you need to look for a broad-spectrum product that specifies protecting against UVA. Unless specified, it’s safe to assume it does not protect against UVA. It’s also important to realize that no sunscreen is capable of blocking 100 percent of UVB or UVA. As a general guideline: SPF 30 blocks 97 percent of UVB SPF 50 blocks 98 percent of UVB SPF 100 blocks 99 percent of UVB As in previous years, recent testing again reveals many products overstate their SPF. In this round of testing, 24 of the 73 products evaluated2 offered less than half of the protection promised by their stated SPF. What this means is if a product is labeled SPF 30, it may only offer SPF 15 protection or less, which could lead to overexposure and burning. This finding echoes the results of other investigators as well. For example, A JAMA Dermatology study published last year found nearly half of the top-rated sunscreen products tested failed to meet the standards set by the American Academy of Dermatology3 An analysis by Consumer Reports earlier this year found many sunscreens tested failed to meet SPF standards; 40 percent worked at less than half the SPF indicated on the label4 Oxybenzone — Just One of Several Toxic Sunscreen Ingredients Research by the Centers for Disease Control and Prevention shows 96 percent of the U.S. population has oxybenzone in their bodies — a known endocrine disruptor linked to reduced sperm count5 in men and endometriosis6 in women. The main source of this chemical? Sunscreens. Oxybenzone is also lethal to certain sea creatures, including horseshoe crab eggs, and researchers warn the widespread use of oxybenzone-containing sunscreens pose a serious threat to coral reefs and sea life.7 In fact, Hawaiian lawmakers recently approved a ban on the sale of sunscreens containing oxybenzone and oxtinoxate, both of which have been linked to severe coral damage. Estimates suggest sunscreen-wearing beachgoers introduce as much as 6,000 metric tons of sunscreen into the world’s oceans each year.8 As reported by Hawaii News Now:9 “At a science class at Kaimuki Middle School, students learn to make homemade sunscreen. It includes bees wax, shea butter, a mix of oils and non nano zinc oxide for sun protection. ‘I think it's really cool because I know it doesn't have oxybenzone so when I use it. I won't think it hurt the coral reefs,’ said Lochlan Ajimine, a 6th grade student in Nicole Ross' science class. The husband and wife founders of organic sunscreen maker, Little Hands Hawaii, have been teaching their techniques and advocating for a ban on the sale of sunscreen with oxybenzone and octinoxate, two common chemicals which some studies show harm coral reefs. ‘I think it's both very important for our bodies and for the environment and also for the keiki. They are so little and they need good stuff going on to them,’ said Rosalyn Ardoin, co-founder of Little Hands Hawaii.” Other Harmful Sunscreen Ingredients Disturbingly, at least nine of the sunscreen ingredients approved by the U.S. Food and Drug Administration (FDA) are known to disrupt human endocrine function.10 Aside from oxybenzone — which is found in 70 percent of sunscreens — other commonly used chemicals that can enter your bloodstream and can cause toxic side effects, including hormone disruption, include but are not limited to:11,12 Octyl methoxycinnamate (OMC) Para-aminobenzoic acid (PABA) Octyl salicylate Phenylbenzimidazole Octocrylene Octisalate Dioxybenzone Menthyl anthranilate Homosalate Octinoxate Cinoxate Parabens Unfortunately, the health risks of these chemicals are typically ignored entirely, and many still recommend13 looking for products containing these toxic ingredients. Many sunscreens also contain vitamin A and/or its derivatives, retinol and retinyl palmitate, which have been linked to an increased risk of skin cancer by increasing the speed at which malignant cells develop and spread. Researchers Warn of Neurotoxicity Research published last year also warns that some sunscreen ingredients are neurotoxic, posing a hazard to brain health. The authors noted that since sunscreens need to be applied in significant amounts all over the body, calculations suggest the total amount of a given compound being absorbed from a single application could be as high as 200 milligrams. Studies also show these chemicals are found in blood, urine and breast milk following application, in some cases within as little as two hours. Here, the scientists reviewed the neurotoxicity of octyl methoxycinnamate, benzophenone-3 and −4, 4-methylbenzylidene camphor, 3-benzylidene camphor and octocrylene — chemical sunscreens that scatter and reflect UV rays — as well as zinc oxide and titanium dioxide, which prevent burning by acting as physical filters. These minerals have a minimal absorption rate (unless nanosized particles are used), which adds to their safety profile. According to the authors: “[W]hile sunscreens have been effective in protecting against a variety of UV-related pathologies … growing popularity and thus, possibility for exposure questions their safety in environment and human health … The endocrine disruptive and developmental toxicity of many organic UV filters in experimental models is well established; these filters seem to be associated with altered estrogen, androgen and progesterone activity, reproductive and developmental toxicity and impaired functioning of the thyroid, liver or kidneys … Since many of UV filters were shown to cross the blood-brain barrier, the risk for neurotoxicity also occurs … [S]ince it is known that other chemicals classified as endocrine disruptors can impair neuronal transmission, synaptic plasticity and produce neurotoxic effects, chemical filters might potentially produce similar effect.” Indeed, studies included in the review show a number of neurotoxic effects. For example, octyl methoxycinnamate has been found to decrease motor activity in female rats and alter the release of a number of different neurotransmitters. Benzophenone-3 has been found to decrease cell viability of neurons, and upregulate estrogenic-related genes in male animals. The chemical 4-methylbenzylidene camphor also decreased cell viability, and impaired neuronal development in lab animals, while octocrylene impaired expression of genes related to brain development and brain metabolism. The authors also stress that simultaneous application of insect repellents such as DEET enhances the penetration of the compounds, thereby multiplying their potential toxicity. The Problem With Nanoparticles Then there’s the issue of nanoparticles.14 Despite their general safety, when zinc oxide and titanium dioxide are nanosized, such as in spray-on sunscreens,15 they too can pose a significant health hazard by irritating lung tissues.16 Animal research has shown that inhaled nanoparticles can reach all areas of your respiratory tract and, since your lungs have difficulty clearing small particles, they may end up passing into your bloodstream and crossing your blood-brain barrier. If allowed to enter your lungs or penetrate your skin, nanoparticles therefore have the potential to cause widespread damage to your cells and organs, immune system, nervous system, heart and brain.17 The International Agency for Research on Cancer has even classified ultrafine titanium dioxide particles as a “possible carcinogen” when inhaled in high doses, noting that:18 “Titanium dioxide causes varying degrees of inflammation and associated pulmonary effects including lung epithelial cell injury, cholesterol granulomas and fibrosis. Rodents experience stronger pulmonary effects after exposure to ultrafine titanium dioxide particles compared with fine particles on a mass basis.” Concerns about nanoparticles have also prompted the FDA to issue a warning to parents, urging them to avoid spray-on sunscreens.19 Some scientists postulate the toxic effects of nanoparticles relate to their size being in the range of a virus, which may trigger your body’s immune response.20 Sunscreens Contribute to Vitamin D Deficiency Aside from the problem of toxicity, excessive use of sunscreen also contributes to vitamin D deficiency, which in turn increases your risk for a wide array of chronic diseases, including diabetes, heart disease, osteoporosis and cancer, just to name a few. According to a clinical review21 published in The Journal of the American Osteopathic Association last year concluded overzealous sunscreen use is one of the reasons why this deficiency has gotten so widespread. Coauthor Dr. Kim Pfotenhauer, assistant professor at Touro University, stated:22 “People are spending less time outside and, when they do go out, they’re typically wearing sunscreen, which essentially nullifies the body’s ability to produce vitamin D. While we want people to protect themselves against skin cancer, there are healthy, moderate levels of unprotected sun exposure that can be very helpful in boosting vitamin D … Science has been trying to find a one-to-one correspondence between vitamin D levels and specific diseases. Given vitamin D’s ubiquitous role in the body, I believe sufficient vitamin D is more about overall health.” According to this study, about 1 billion people worldwide have insufficient vitamin D levels for health, defined here as a vitamin D level below 30 ng/mL. African-Americans are disproportionally affected, primarily due to the fact that dark-skinned people need far more sun exposure to achieve ideal levels. The findings presented here suggest a staggering 95 percent of African-American adults have insufficient or deficient levels of vitamin D. If you decide you want to avoid all sun exposure, you’ll need to be extra vigilant about tracking your vitamin D level year-round and optimize your level by taking an oral vitamin D supplement, making sure you balance your vitamin D3 with your intake of vitamin K2, magnesium and calcium. Just keep in mind that oral vitamin D cannot provide all of the benefits of sunlight exposure, so it’s not a perfect workaround. Supplementation is better than nothing though. How Much Unprotected Sun Exposure Do You Need? Caucasians and others with paler skin will hit an “equilibrium point” after about 20 minutes of exposure to UVB light, at which point vitamin D will no longer be produced. You can tell you’ve reached your optimal exposure for the day when your skin turns a very light shade of pink. After that you’re only increasing your chances of getting burned, which is something you definitely want to avoid. There appears to be no additional benefit to staying in the sun beyond this point. You only risk damage. If you have darker skin, reaching this equilibrium point can take two to six times longer (or up to an hour or two), depending on your pigmentation. Now, while those living in tropical regions have an abundance of sunshine, there are individuals who hardly have exposure, especially in most of the continental U.S. It doesn’t make much sense to expose your skin to the sun when the temperature is lower than 50 degrees F, which has a scarcity of UVB rays. This occurs a lot in most regions in the U.S., especially those who experience four seasons. The charts below display the likelihood of vitamin D synthesis across the U.S. by month. For more information about how to optimize your vitamin D from sensible sun exposure, see my vitamin D resource page. Safest Sunscreens Getting back to sunscreen, your absolute best bet is to cover up with clothing once you’ve reached your ideal sun exposure time. If you absolutely want to use a sunscreen lotion or cream, your safest bet is to use topical zinc oxide or titanium dioxide product that does not contain nanosized particles. As noted by the Environmental Working Group (EWG), which also issues an annual sunscreen guide:23 “Almost three-fourths of the products we examined offer inferior sun protection or contain worrisome ingredients like oxybenzone, a hormone disruptor, or retinyl palmitate, a form of vitamin A that may harm skin. And despite scant evidence,24 the government still allows most sunscreens to claim they help prevent skin cancer … Sunscreens using zinc oxide and titanium dioxide tend to rate well in our analysis: They are stable in sunlight, offer a good balance between protection from the two types of ultraviolet radiation — UVA and UVB — and don’t often contain potentially harmful additives.” Last year, my Mercola SPF 50 Sunscreen topped the list of EWG’s top picks of highly recommended sunscreens. The EWG has not yet released its picks for this year. Other recommended products included True Natural Neutral Unscented Sunscreen SPF 50; Loving Naturals Adorable Baby Sunscreen stick SPF 30+; Blue Lizard Australian Sensitive Sunscreen SPF 30 and Burnout Ocean Tested Physical Sunscreen SPF 30. Fourteen of the worst-scoring sunscreens for kids included several popular brands, including two Banana Boat products, seven Coppertone products, a CVS branded sunscreen and two Neutrogena products.
0 notes
Text
Wrestling the Python
My first python program follows - At the end of the output you will see two warning messages stating that the convert_objects function covered in the tutorial is deprecated. I was unable to find a way to suppress this but will keep trying.
The program examines optimism versus pessimism in the minds of Liberal and Conservative voters based on the Outlook on Life Surveys (2012, Belinda Robnett, University of California-Irvine; Katherine Tate, Brown University)
To define Political Affiliation I reduced the data chosen by creating 2 subsets of the original code set (question W1_C2: We hear a lot of talk these days about liberals and conservatives. Where would you place YOURSELF on this 7 point scale?) - it had values from 1(very liberal) to 7(very conservative) and -1 (missing). I decided to define Liberal was using values 1-3. I removed 4 as it was right in the middle leaning neither one way or the other and -1 as that signified missing data. Subset 2 was conservative where values 5-7 defined the set.
I then split the results based on Optimism - (question W2_QE1 - When you think about your future, are you generally 1.optimistic, 2.pessimistic, o 3.neither optimistic nor pessimistic?) I used only 1 and 2 selecting only those folks who aligned with one or the other.
The results were interesting - while the population was evenly split between Liberal and Conservative there is a definite leaning toward pessimism in the Conservative camp.However, there is a propensity for Optimism in the overall group with more than 75% feeling optimistic.
Data Point Count Distribution ========== ===== ============ Overall Population
Total Number of People: 717 100 % Total who are Optimistic: 544 76.0 % Total who are Pessimistic: 173 24.0 %
Affiliation Populations
Total Number of People: 717 100 % Total lean Liberal 351 49.0 % Total lean Conservative: 366 51.0 %
Total Number of Optimists: 544 100 % Liberals who are Optimistic: 314 58.0 % Conservatives who are Optimistic: 230 42.0 %
Total Number of Pessimists: 173 100 % Liberals who are Pessimistic: 37 21.0 % Conservatives who are Pessimistic: 136 79.0 %
PROGRAM LISTING
# -*- coding: utf-8 -*- """ Spyder Editor
This is a temporary script file. """ import pandas import numpy
data = pandas.read_csv('ool_pds.csv', low_memory=False)
#convert fields of interest to numberic type #Can optimism and political affiliation be linked?
#ARE YOU OPTIMISTIC? data["W2_QE1"] = data["W2_QE1"].convert_objects(convert_numeric=True) #PERSONAL BELIEF - CONSRVATIVE or LIBERAL data["W1_C2"] = data["W1_C2"].convert_objects(convert_numeric=True)
#lowercase data.columns = map(str.upper, data.columns)
#how much data is there? responses = (len(data)) print (" ") print ('Number of Responses: ',(responses)) print (" ") print ('Assumptions') print (" ") print ('Liberals - those with a rating of 1-3 on Scale of 1-7 where 1 is very Liberal and 7 is very Conservative') print ('Conservative - those with a rating of 1-3 on Scale of 1-7 where 1 is very Liberal and 7 is very Conservative') print (" ") print (" ") #Sample - we reduced the sample by aligning liiberal and conservative as follows #SUBSET 1: Optimists who are Liberal (Assumes 1-3 on scale of 1-8) sub1=data[(data['W2_QE1']==1) & (data['W1_C2']>0) & (data['W1_C2']<=3)] #SUBSET 2: Optimists who are Conservative sub2=data[(data['W2_QE1']==1) & (data['W1_C2']>=5)] #SUBSET 3: Pessimists who are Liberal (Assumes 1-3 on scale of 1-8) sub3=data[(data['W2_QE1']==2) & (data['W1_C2']>0) & (data['W1_C2']<=3)] #SUBSET 4: Pessimists who are Conservative sub4=data[(data['W2_QE1']==2) & (data['W1_C2']>=5)]
#Lets do some math on the responses c9 = sub1["W1_C2"].value_counts(sort=False) c10 = sub2["W1_C2"].value_counts(sort=False) c11 = sub3["W2_QE1"].value_counts(sort=False) c12 = sub4["W2_QE1"].value_counts(sort=False) #Percentages p9 = sub1["W1_C2"].value_counts(sort=False, normalize=True) p10 = sub2["W1_C2"].value_counts(sort=False, normalize=True) p11 = sub3["W2_QE1"].value_counts(sort=False, normalize=True) p12 = sub4["W2_QE1"].value_counts(sort=False, normalize=True)
#who is optimistic and pessimistic - count1 = (sum(c9) + sum(c10)) count2 = (sum(c11) + sum(c12)) count3 = (count1)+(count2) #Who is Liberal and Conservative count4 = (sum(c9) + sum(c11)) count5 = (sum(c10) + sum(c12)) count6 = (count4)+(count5) #Liberal Optimists #who is optimistic and pessimistic - Distributions countp1l = round(((sum(c9))/(count1)) * (100)) countp1c = round(((sum(c10))/(count1)) * (100)) countp2 = round((count1/count3) * (100)) countp2l = round(((sum(c11))/(count2)) * (100)) countp2c = round(((sum(c12))/(count2)) * (100)) countp3 = round((count2/count3) * (100)) countp4 = round((count4/count6) * (100)) countp5 = round((count5/count6) * (100))
# Print out print ("Data Point Count Distribution") print ("========== ===== ============") print ("Overall Population ") print (" ") print (("Total Number of People: "),(count3),(100),("%")) print (("Total who are Optimistic: "),(count1),(countp2),("%")) print (("Total who are Pessimistic: "),(count2),(countp3),("%")) print (" ") print ("Affiliation Populations") print (" ") print (("Total Number of People: "),(count3),(100),("%")) print (("Total lean Liberal "),(count4),(countp4),("%")) print (("Total lean Conservative: "),(count5),(countp5),("%")) print (" ") print (("Total Number of Optimists: "),(count1),(100),("%")) print (("Liberals who are Optimistic: "),(sum(c9)),(countp1l),("%")) print (("Conservatives who are Optimistic: "),(sum(c10)),(countp1c),("%")) print (" ") print (("Total Number of Pessimists: "),(count2),(100),("%")) print (("Liberals who are Pessimistic: "),(sum(c11)),(countp2l),("%")) print (("Conservatives who are Pessimistic: "),(sum(c12)),(countp2c),("%")) print (" ") print (" ")
#End
PROGRAM OUTPUT
runfile('C:/Users/a248959/Documents/Study/Python Work/ool_script_v4.py', wdir='C:/Users/a248959/Documents/Study/Python Work')
Number of Responses: 2294
Assumptions
Liberals - those with a rating of 1-3 on Scale of 1-7 where 1 is very Liberal and 7 is very Conservative Conservative - those with a rating of 1-3 on Scale of 1-7 where 1 is very Liberal and 7 is very Conservative
Data Point Count Distribution ========== ===== ============ Overall Population
Total Number of People: 717 100 % Total who are Optimistic: 544 76.0 % Total who are Pessimistic: 173 24.0 %
Affiliation Populations
Total Number of People: 717 100 % Total lean Liberal 351 49.0 % Total lean Conservative: 366 51.0 %
Total Number of Optimists: 544 100 % Liberals who are Optimistic: 314 58.0 % Conservatives who are Optimistic: 230 42.0 %
Total Number of Pessimists: 173 100 % Liberals who are Pessimistic: 37 21.0 % Conservatives who are Pessimistic: 136 79.0 %
C:/Users/a248959/Documents/Study/Python Work/ool_script_v4.py:17: FutureWarning: convert_objects is deprecated. Use the data-type specific converters pd.to_datetime, pd.to_timedelta and pd.to_numeric. data["W2_QE1"] = data["W2_QE1"].convert_objects(convert_numeric=True) C:/Users/a248959/Documents/Study/Python Work/ool_script_v4.py:19: FutureWarning: convert_objects is deprecated. Use the data-type specific converters pd.to_datetime, pd.to_timedelta and pd.to_numeric. data["W1_C2"] = data["W1_C2"].convert_objects(convert_numeric=True)
0 notes
Text
Week#02 DMV Assignment#02
Program:
""" author: vikramaditya pratap singh research question: how much the family history affects the alcohol consumption/alcohol dependence of an individual """ # S2AQ1 --> DRANK ATLEAST 1 ALCOHOLIC DRINK IN LIFE; Yes = 1, No = 2 # S2AQ2 --> DRANK ATLEAST 12 ALCOHOLIC DRINKS IN LAST 12 MONTHS; Yes = 1, No = 2, Unknown = 9 # S2AQ3 --> DRANK ATLEAST 1 ALCOHLIC DRINK IN LAST 12 MONTHS; Yes = 1, No = 2, Unknown = 9 # CONSUMER --> DRINKING STATUS; Current drinker = 1, Ex-drinker = 2, Lifetime Abstainer = 3 # S2DQ1 --> BLOOD/NATURAL FATHER EVER AN ALCOHOLIC OR PROBLEM DRINKER; Yes = 1, No = 2, Unknown = 9 # S2DQ2 --> BLOOD/NATURAL MOTHER EVER AN ALCOHOLIC OR PROBLEM DRINKER; Yes = 1, No = 2, Unknown = 9 # S2DQ3C1 --> NUMBER OF FULL BROTHERS WHO WERE EVER ALCOHOLICS OR PROBLEM DRINKERS; Full Brother(s) = 0-11, Unknown = 99 # S2DQ4C1 --> NUMBER OF FULL SISTERS WHO WERE EVER ALCOHOLICS OR PROBLEM DRINKERS; Full Sister(s) = 0-9, Unknown = 99 import pandas as pd import numpy as np # loading up the data frame being used dataFrame = pd.read_csv('nesarc_pds.csv', low_memory = False) totalObservation = len(dataFrame) totalVariable = len(dataFrame.columns) print("Total number of observations/rows =", totalObservation) print("Total number of variables/columns =", totalVariable) # converting each variable to numeric data type dataFrame['S2AQ1'] = pd.to_numeric(dataFrame['S2AQ1']) dataFrame['S2AQ2'] = pd.to_numeric(dataFrame['S2AQ2']) dataFrame['S2AQ3'] = pd.to_numeric(dataFrame['S2AQ3']) dataFrame['CONSUMER'] = pd.to_numeric(dataFrame['CONSUMER']) dataFrame['S2DQ1'] = pd.to_numeric(dataFrame['S2DQ1']) dataFrame['S2DQ2'] = pd.to_numeric(dataFrame['S2DQ2']) dataFrame['S2DQ3C1'] = pd.to_numeric(dataFrame['S2DQ3C1']) dataFrame['S2DQ4C1'] = pd.to_numeric(dataFrame['S2DQ4C1']) # count and frequency distribution for I variable print("COUNT FOR: DRANK ATLEAST 1 ALCOHOLIC DRINK IN LIFE; Yes = 1, No = 2") count1 = dataFrame['S2AQ1'].value_counts(sort = False, dropna = False) print(count1) print("%AGE FOR: DRANK ATLEAST 1 ALCOHOLIC DRINK IN LIFE; Yes = 1, No = 2") perc1 = dataFrame['S2AQ1'].value_counts(sort = False, normalize = True, dropna = False) print(perc1) # count and frequency distribution for II variable print("COUNT FOR: DRANK ATLEAST 12 ALCOHOLIC DRINKS IN LAST 12 MONTHS; Yes = 1, No = 2, Unknown = 9") count2 = dataFrame['S2AQ2'].value_counts(sort = False, dropna = False) print(count2) print("%AGE FOR: DRANK ATLEAST 12 ALCOHOLIC DRINKS IN LAST 12 MONTHS; Yes = 1, No = 2, Unknown = 9") perc2 = dataFrame['S2AQ2'].value_counts(sort = False, normalize = True, dropna = False) print(perc2) # count and frequency distribution for III variable print("COUNT FOR: DRANK ATLEAST 1 ALCOHOLIC DRINK IN LAST 12 MONTHS; Yes = 1, No = 2, Unknown = 9") count3 = dataFrame['S2AQ3'].value_counts(sort = False, dropna = False) print(count3) print("%AGE FOR: DRANK ATLEAST 1 ALCOHOLIC DRINK IN LAST 12 MONTHS; Yes = 1, No = 2, Unknown = 9") perc3 = dataFrame['S2AQ3'].value_counts(sort = False, normalize = True, dropna = False) print(perc3) # count and frequency distribution for IV variable print("COUNT FOR: DRINKING STATUS; Current drinker = 1, Ex-drinker = 2, Lifetime Abstainer = 3") count4 = dataFrame['CONSUMER'].value_counts(sort = False, dropna = False) print(count4) print("%AGE FOR: DRINKING STATUS; Current drinker = 1, Ex-drinker = 2, Lifetime Abstainer = 3") perc4 = dataFrame['CONSUMER'].value_counts(sort = False, normalize = True, dropna = False) print(perc4) # count and frequency distribution for V variable print("COUNT FOR: BLOOD/NATURAL FATHER EVER AN ALCOHOLIC OR PROBLEM DRINKER; Yes = 1, No = 2, Unknown = 9") count5 = dataFrame['S2DQ1'].value_counts(sort = False, dropna = False) print(count5) print("%AGE FOR: BLOOD/NATURAL FATHER EVER AN ALCOHOLIC OR PROBLEM DRINKER; Yes = 1, No = 2, Unknown = 9") perc5 = dataFrame['S2DQ1'].value_counts(sort = False, normalize = True, dropna = False) print(perc5) # count and frequency distribution for VI variable print("COUNT FOR: BLOOD/NATURAL MOTHER EVER AN ALCOHOLIC OR PROBLEM DRINKER; Yes = 1, No = 2, Unknown = 9") count6 = dataFrame['S2DQ2'].value_counts(sort = False, dropna = False) print(count6) print("%AGE FOR: BLOOD/NATURAL MOTHER EVER AN ALCOHOLIC OR PROBLEM DRINKER; Yes = 1, No = 2, Unknown = 9") perc6 = dataFrame['S2DQ2'].value_counts(sort = False, normalize = True, dropna = False) print(perc6) # count and frequency distribution for VII variable print("COUNT FOR: NUMBER OF FULL BROTHERS WHO WERE EVER ALCOHOLICS OR PROBLEM DRINKERS; Full Brother(s) = 0-11, Unknown = 99") count7 = dataFrame['S2DQ3C1'].value_counts(sort = False, dropna = False) print(count7) print("%AGE FOR: NUMBER OF FULL BROTHERS WHO WERE EVER ALCOHOLICS OR PROBLEM DRINKERS; Full Brother(s) = 0-11, Unknown = 99") perc7 = dataFrame['S2DQ3C1'].value_counts(sort = False, normalize = True, dropna = False) print(perc7) # count and frequency distribution for VIII variable print("COUNT FOR: NUMBER OF FULL SISTERS WHO WERE EVER ALCOHOLICS OR PROBLEM DRINKERS; Full Sister(s) = 0-9, Unknown = 99") count8 = dataFrame['S2DQ4C1'].value_counts(sort = False, dropna = False) print(count8) print("%AGE FOR: NUMBER OF FULL SISTERS WHO WERE EVER ALCOHOLICS OR PROBLEM DRINKERS; Full Sister(s) = 0-9, Unknown = 99") perc8 = dataFrame['S2DQ4C1'].value_counts(sort = False, normalize = True, dropna = False) print(perc8)
Output:
runfile('E:/data_management_and_visualization/script#01.py', wdir='E:/data_management_and_visualization') Total number of observations/rows = 43093 Total number of variables/columns = 3010 COUNT FOR: DRANK ATLEAST 1 ALCOHOLIC DRINK IN LIFE; Yes = 1, No = 2 1 34827 2 8266 Name: S2AQ1, dtype: int64 %AGE FOR: DRANK ATLEAST 1 ALCOHOLIC DRINK IN LIFE; Yes = 1, No = 2 1 0.808182 2 0.191818 Name: S2AQ1, dtype: float64 COUNT FOR: DRANK ATLEAST 12 ALCOHOLIC DRINKS IN LAST 12 MONTHS; Yes = 1, No = 2, Unknown = 9 1 20836 2 22225 9 32 Name: S2AQ2, dtype: int64 %AGE FOR: DRANK ATLEAST 12 ALCOHOLIC DRINKS IN LAST 12 MONTHS; Yes = 1, No = 2, Unknown = 9 1 0.483512 2 0.515745 9 0.000743 Name: S2AQ2, dtype: float64 COUNT FOR: DRANK ATLEAST 1 ALCOHOLIC DRINK IN LAST 12 MONTHS; Yes = 1, No = 2, Unknown = 9 1 26946 2 16116 9 31 Name: S2AQ3, dtype: int64 %AGE FOR: DRANK ATLEAST 1 ALCOHOLIC DRINK IN LAST 12 MONTHS; Yes = 1, No = 2, Unknown = 9 1 0.625299 2 0.373982 9 0.000719 Name: S2AQ3, dtype: float64 COUNT FOR: DRINKING STATUS; Current drinker = 1, Ex-drinker = 2, Lifetime Abstainer = 3 1 26946 2 7881 3 8266 Name: CONSUMER, dtype: int64 %AGE FOR: DRINKING STATUS; Current drinker = 1, Ex-drinker = 2, Lifetime Abstainer = 3 1 0.625299 2 0.182884 3 0.191818 Name: CONSUMER, dtype: float64 COUNT FOR: BLOOD/NATURAL FATHER EVER AN ALCOHOLIC OR PROBLEM DRINKER; Yes = 1, No = 2, Unknown = 9 1 8124 2 32445 9 2524 Name: S2DQ1, dtype: int64 %AGE FOR: BLOOD/NATURAL FATHER EVER AN ALCOHOLIC OR PROBLEM DRINKER; Yes = 1, No = 2, Unknown = 9 1 0.188522 2 0.752907 9 0.058571 Name: S2DQ1, dtype: float64 COUNT FOR: BLOOD/NATURAL MOTHER EVER AN ALCOHOLIC OR PROBLEM DRINKER; Yes = 1, No = 2, Unknown = 9 1 2311 2 39553 9 1229 Name: S2DQ2, dtype: int64 %AGE FOR: BLOOD/NATURAL MOTHER EVER AN ALCOHOLIC OR PROBLEM DRINKER; Yes = 1, No = 2, Unknown = 9 1 0.053628 2 0.917852 9 0.028520 Name: S2DQ2, dtype: float64 COUNT FOR: NUMBER OF FULL BROTHERS WHO WERE EVER ALCOHOLICS OR PROBLEM DRINKERS; Full Brother(s) = 0-11, Unknown = 99 0 35428 1 4408 2 1278 3 283 99 1464 4 126 5 44 6 42 7 13 8 2 9 3 10 1 11 1 Name: S2DQ3C1, dtype: int64 %AGE FOR: NUMBER OF FULL BROTHERS WHO WERE EVER ALCOHOLICS OR PROBLEM DRINKERS; Full Brother(s) = 0-11, Unknown = 99 0 0.822129 1 0.102290 2 0.029657 3 0.006567 99 0.033973 4 0.002924 5 0.001021 6 0.000975 7 0.000302 8 0.000046 9 0.000070 10 0.000023 11 0.000023 Name: S2DQ3C1, dtype: float64 COUNT FOR: NUMBER OF FULL SISTERS WHO WERE EVER ALCOHOLICS OR PROBLEM DRINKERS; Full Sister(s) = 0-9, Unknown = 99 0 39090 1 1847 2 708 3 83 99 1298 4 43 5 13 6 4 7 5 8 1 9 1 Name: S2DQ4C1, dtype: int64 %AGE FOR: NUMBER OF FULL SISTERS WHO WERE EVER ALCOHOLICS OR PROBLEM DRINKERS; Full Sister(s) = 0-9, Unknown = 99 0 0.907108 1 0.042861 2 0.016430 3 0.001926 99 0.030121 4 0.000998 5 0.000302 6 0.000093 7 0.000116 8 0.000023 9 0.000023 Name: S2DQ4C1, dtype: float64
Summary:
Above are the program and output showing the count and frequency distribution for the variables I considered for my reasearch which is, alcohol consumption/alcohol dependence in an individual with a family history of alcoholism. I have not considered any specific condition for my program and/or research as I am interested in all the variables being used in my research.
0 notes