#getContext
Explore tagged Tumblr posts
Visit Tumblr Blog
Explore Tumblr blogs with no restrictions, modern design and the best experience.
Last Seen Tumblr Blogs


Fun Fact
28.6 is the average number of monthly visits per US mobile user.
Text
HarmonyOS NEXT Practical: Awakening the Camera
Objective: To evoke camera photography and recording, and display the captured images and videos.
The application can call CameraPicker to take photos or record videos without applying for camera permissions.
The camera interactive interface of CameraPicker is provided by the system. After the user clicks the capture and confirmation button, the application of CameraPicker is called to obtain the corresponding photos or videos.
If application developers only need to obtain real-time photos or videos, they can easily use CameraPicker capabilities to achieve this.
Due to the fact that the shooting and confirmation of photos are actively confirmed by users, application developers do not need to apply for relevant permissions to operate the camera.
cameraPicker.pick interface [code] pick(context: Context, mediaTypes: Array, pickerProfile: PickerProfile): Promise [/code]
Pull up the camera selector and enter the corresponding mode according to the media type. The operation ends and the result is obtained in the form of a Promise.
PickerProfile: Configuration information for the camera selector. PickerProfile attribute
cameraPosition: The position of the camera.
saveUri: The URI used to save configuration information. Please refer to the file URI for the default value.
VideoDuration: The maximum duration of recording in seconds.
describe
The saveUri of PickerProfile is an optional parameter. If this option is not configured, the photos and videos taken will be saved to the media library by default.
If you do not want to store photos and videos in the media library, please configure the file path in the application sandbox by yourself.
The file in the application sandbox must be an existing and writable file. After passing the URI of this file into the picker interface, it is equivalent to granting the system camera read and write permissions for the file. After the system camera finishes shooting, it will overwrite and write this file.
PickerResult: The processing result of the camera selector. PickerResult attribute
resultCode: The processed result returns 0 for success and -1 for failure.
resultUri: The returned URI address. If saveUri is empty, resultUri is the public media path. If saveUri is not empty and has write permission, resultUri is the same as saveUri. If saveUri is not empty and does not have write permission, the resultUri cannot be obtained.
mediaType: The returned media type.
Actual combat: CameraPickerPage [code] import { camera, cameraPicker as picker } from '@kit.CameraKit' import { fileIo, fileUri } from '@kit.CoreFileKit'
@Entry @Component struct CameraPickerPage { @State imgSrc: string = ''; @State videoSrc: string = ''; @State isShowImage: boolean = false
build() { Column({ space: 10 }) { Text('CameraPicker Demo') Row({ space: 10 }){ Button('拍照') .onClick(async () => { let pathDir = getContext().filesDir; let fileName = `${new Date().getTime()}` let filePath = pathDir + `/${fileName}.tmp` fileIo.createRandomAccessFileSync(filePath, fileIo.OpenMode.CREATE); let uri = fileUri.getUriFromPath(filePath); let pickerProfile: picker.PickerProfile = { cameraPosition: camera.CameraPosition.CAMERA_POSITION_BACK, saveUri: uri }; let result: picker.PickerResult = await picker.pick(getContext(), [picker.PickerMediaType.PHOTO], pickerProfile); console.info(`picker resultCode: ${result.resultCode},resultUri: ${result.resultUri},mediaType: ${result.mediaType}`); if (result.resultCode == 0) { if (result.mediaType === picker.PickerMediaType.PHOTO) { this.imgSrc = result.resultUri; this.isShowImage = true } else { this.videoSrc = result.resultUri; } } }) Button('录视频') .onClick(async () => { let pathDir = getContext().filesDir; let fileName = `${new Date().getTime()}` let filePath = pathDir + `/${fileName}.tmp` fileIo.createRandomAccessFileSync(filePath, fileIo.OpenMode.CREATE); let uri = fileUri.getUriFromPath(filePath); let pickerProfile: picker.PickerProfile = { cameraPosition: camera.CameraPosition.CAMERA_POSITION_BACK, saveUri: uri }; let result: picker.PickerResult = await picker.pick(getContext(), [ picker.PickerMediaType.VIDEO], pickerProfile); console.info(`picker resultCode: ${result.resultCode},resultUri: ${result.resultUri},mediaType: ${result.mediaType}`); if (result.resultCode == 0) { if (result.mediaType === picker.PickerMediaType.PHOTO) { this.imgSrc = result.resultUri; } else { this.videoSrc = result.resultUri; this.isShowImage = false } } }) } if (this.imgSrc != '' || this.videoSrc != '') { if (this.isShowImage) { Image(this.imgSrc).width(200).height(200).backgroundColor(Color.Black).margin(5); } else { Video({ src: this.videoSrc }).width(200).height(200).autoPlay(true); } } } .height('100%') .width('100%')
} } [/code]
0 notes
Text
실시간으로 업데이트되는 사이버 범죄 통계
서론
사이버 범죄는 현대 사회에서 날로 증가하는 문제입니다. 기술의 발전과 더불어 사이버 범죄의 형태도 다양해지고 있으며, 이에 따라 실시간으로 업데이트되는 사이버 범죄 통계에 대한 필요성이 점점 더 커지고 있습니다. 이 글에서는 최신 사이버 범죄 통계를 분석하고, 특히 몸캠사기와 같은 주요 범죄 몸캠���싱 유형에 대해 심층적으로 살펴보겠습니다.
실시간으로 업데이트되는 사이버 범죄 통계
사이버 범죄는 단순한 해킹을 넘어 다양한 형태의 사기, 데이터 유출, 그리고 개인 정보 침해를 포함합니다. 매년 수많은 사람들이 피해를 당하며, 그 수치는 갈수록 증가하고 있습니다. 최근 발표된 보고서에 따르면, 2023년에는 전 세계적으로 약 4억 건 이상의 사이버 공격이 발생했습니다. 이는 이전 연도 대비 약 30% 증가한 수치입니다.
사이버 범죄의 정의와 유형 해킹: 시스템이나 네트워크에 무단 접근하여 데이터를 탈취하거나 손상시키는 행위. 피싱: 사용자로 하여금 개인 정보를 입력하도록 유도하는 사기 행위. 몸캠사기: 피해자가 노출된 사진이나 영상을 사용하여 금전을 요구하는 사기. 랜섬웨어: 데이터를 암호화하여 접근을 차단하고 몸값을 요구하는 악성 프로그램. 사이버 범죄 통계 데이터 출처
다양한 기관에서 사이버 범죄 통계를 제공합니다. 여기에는 정부 기관, 보안 회사 및 연구소 등이 포함됩니다. 이러한 데이터는 정책 결정과 예방 대책 마련에 중요한 역할을 합니다.
주요 데이터 출처 국제 경찰 조직 INTERPOL 미국 연방 수사국 FBI 한국인터넷진흥원 KISA 2023년 사이버 범죄 통계 현황 전 세계적인 사이버 공격 현황
2023년에 들어서면서 전 세계적으로 발생한 사이버 공격의 수가 급증하고 있습니다. 특히 기업과 정부 기관이 주요 타겟이 되고 있으며, 이로 인해 막대한 경제적 손실이 발생하고 있습니다.
주요 국가별 사이버 공격 통계
| 국가 | 공격 건수 | 피해 규모 (USD) | |------------|-------------|------------------| | 미국 | 1억 건 이상 | 200억 달러 이상 | | 한국 | 5천만 건 | 10억 달러 이상 | | 일본 | 4천만 건 | 8억 달러 이상 |
몸캠사기 발생 현황
특히 눈여겨봐야 할 점은 몸캠사기의 급증입니다. 많은 피해자들이 자신의 민감한 정보가 노출될까 두려워 신고를 주저하는 경우가 많습니다.
몸캠사기 통계 요약 2022년 대비 몸캠사기 사건이 50% 증가함. 평균 피해 금액: 약 500만 원. 한국 내 사이버 범죄 동향 한국에서의 사이버 범죄 유형별 비율
한국에서도 다양한 형태의 사이버 범 crime이 발생하고 있으며, 그 중에서도 피싱과 몸캠사기가 큰 비중을 차지하고 있습니다.
범죄 유형 비율 그래프
var ctx = document.getElementById('crimeChart').getContext('2d'); var crimeChart = new Chart(ctx, type: 'pie', data: labels: ['피싱', '몸캠사기', '해킹', '랜섬웨어'], datasets: [ data: [40, 25, 20, 15], backgroundColor: ['red', 'blue', 'green', 'yellow'] ] ); 피해자의 연령대 분석
연령대별로 보면 젊은 층 특히 20대와 30대가 가장 많은 피해를 보고 있으며, 이는 인터넷 사용 빈도가 높기 때문입니다.
각종 사이버 범 crime 예방 팁 개인 정보 보호 방법 강력한 패스워드 사용 정기적인 소프트웨어 업데이트 의심스러운 이메일 열지 않기 몸캠사기에 주의하기 위한 팁 친숙하지 않은 사람과 영상통화를 삼가세요. 상대방에게 신뢰할 수 있는 인증 방법 요청하기. 의심스러운 상황에서는 즉시 종료하세요. 정부 및 기업의 대응 방안 정부의 정책 및 법률 강화
한국 정부는 최근 몇 년간 사이버 범 crime에 대한 법률을 강화하고 있으며, 이를 통해 피해자를 보호하려고 노력하고 있습니다.
주요 법률 개정 사항 개인정보 보호법 강화 전자상거래법 수정 기업의 보안 대책 강화 필요성
기업들도 내부 보안을 더욱 철저히 해야 합니다. 보안 교육 프로그램을 운영하거나 최신 보안 솔루션 도입이 필수적입니다.
FAQs Q1: 몸캠사기를 피하려면 어떻게 해야 하나요?
A1: 신뢰할 수 없는 사람과 영상통화를 하지 않고, 만약 의심스러운 상황이 생긴다면 즉시 대화를 종료해야 합니다.
Q2: 최근 가장 많이 발생하는 사이버 범 crime은 무엇인가요?
A2: 현재 피싱과 몸캠사기가 가장 많이 발생하는 주요 범 crime으로 알려져 있습니다.
Q3: 정부는 어떤 조치를 취하고 있나요?
A3: 정부는 관련 법률을 강화하고 피해자 보호 프로그램을 운영하며 예방 교육을 실시하고 있습니다.
Q4: 개인 정보 유출 시 어떻
0 notes
Text
プロトタイプベイズドな言語のコンストラクタ その2
ログを吐く代わ��に、this を置くのが正式みたい。 Canvas2DUtility は継承されるクラスだが、そうする必要がない場合は、この this を省いても問題ないみたい。 既存の「クラス」を拡張するのに goog.object.extend() ってのを使ってるけれど、他にやり方ないのかしらん? ;;===================
(defn Canvas2DUtility [canvas msg] (this-as this (set! (.-msg this) msg) (set! (.-canvasElement this) canvas) (set! (.-context2d this) (.getContext (.-canvasElement this) "2d")) ;; これがないとメソッド定義が有効にならない。バグ? ;; (.log js/console "constractor: Canvas2DUtility") this )) 【 中略 】 (set! (.. Canvas2DUtility -prototype -greeting) (fn [] (this-as this (js/alert (str (.-msg this) ", gima326" ))))) ;;=================== (:require [goog.object :as gobj]) (defn Canvas2DUtility2 [canvas] (this-as this (.call Canvas2DUtility this canvas "hello") this))
(gobj/extend (.-prototype Canvas2DUtility2) (.-prototype Canvas2DUtility) #js {:fncAdded (fn [] (this-as this (js/alert (.-msg this))))} )
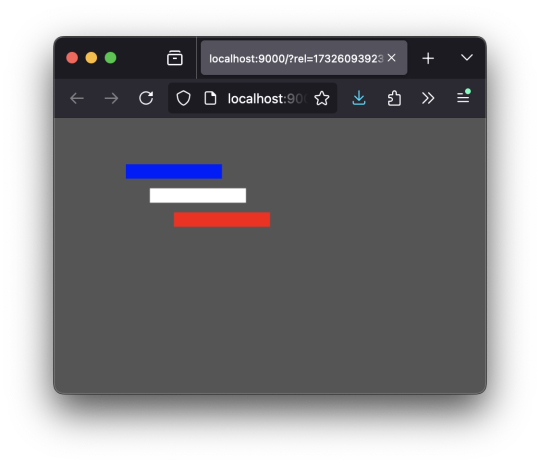
;;=================== (defn render [util] (let [util2 (Canvas2DUtility2. (.getCanvas util))] (.greeting util2) (.fncAdded util2) (.drawRect util "blue" 0 0 100 15) (.drawRect util2 "white" 25 25 100 15) (.drawRect util2 "red" 50 50 100 15) )) ;;=================== 参考にしたサイト [ https://stackoverflow.com/questions/61040644/clojurscript-extend-a-javascript-class ]
0 notes
Text
HTML APIs

HTML APIs (Application Programming Interfaces) provide a way for developers to interact with web browsers to perform various tasks, such as manipulating documents, handling multimedia, or managing user input. These APIs are built into modern browsers and allow you to enhance the functionality of your web applications.
Here are some commonly used HTML APIs:
1. Geolocation API
Purpose: The Geolocation API allows you to retrieve the geographic location of the user’s device (with their permission).
Key Methods:
navigator.geolocation.getCurrentPosition(): Gets the current position of the user.
navigator.geolocation.watchPosition(): Tracks the user’s location as it changes.
Example: Getting the user’s current location.<button onclick="getLocation()">Get Location</button> <p id="location"></p><script> function getLocation() { if (navigator.geolocation) { navigator.geolocation.getCurrentPosition(showPosition); } else { document.getElementById('location').innerHTML = "Geolocation is not supported by this browser."; } } function showPosition(position) { document.getElementById('location').innerHTML = "Latitude: " + position.coords.latitude + "<br>Longitude: " + position.coords.longitude; } </script>
2. Canvas API
Purpose: The Canvas API allows for dynamic, scriptable rendering of 2D shapes and bitmap images. It’s useful for creating graphics, games, and visualizations.
Key Methods:
getContext('2d'): Returns a drawing context on the canvas, or null if the context identifier is not supported.
fillRect(x, y, width, height): Draws a filled rectangle.
clearRect(x, y, width, height): Clears the specified rectangular area, making it fully transparent.
Example: Drawing a rectangle on a canvas.<canvas id="myCanvas" width="200" height="100"></canvas><script> var canvas = document.getElementById('myCanvas'); var ctx = canvas.getContext('2d'); ctx.fillStyle = "red"; ctx.fillRect(20, 20, 150, 100); </script>
3. Drag and Drop API
Purpose: The Drag and Drop API allows you to implement drag-and-drop functionality on web pages, which can be used for things like moving elements around or uploading files.
Key Methods:
draggable: An HTML attribute that makes an element draggable.
ondragstart: Event triggered when a drag operation starts.
ondrop: Event triggered when the dragged item is dropped.
Example: Simple drag and drop.<p>Drag the image into the box:</p> <img id="drag1" src="image.jpg" draggable="true" ondragstart="drag(event)" width="200"> <div id="dropzone" ondrop="drop(event)" ondragover="allowDrop(event)" style="width:350px;height:70px;padding:10px;border:1px solid #aaaaaa;"></div><script> function allowDrop(ev) { ev.preventDefault(); } function drag(ev) { ev.dataTransfer.setData("text", ev.target.id); } function drop(ev) { ev.preventDefault(); var data = ev.dataTransfer.getData("text"); ev.target.appendChild(document.getElementById(data)); } </script>
4. Web Storage API
Purpose: The Web Storage API allows you to store data in the browser for later use. It includes localStorage for persistent data and sessionStorage for data that is cleared when the page session ends.
Key Methods:
localStorage.setItem(key, value): Stores a key/value pair.
localStorage.getItem(key): Retrieves the value for a given key.
sessionStorage.setItem(key, value): Stores data for the duration of the page session.
Example: Storing and retrieving a value using localStorage.<button onclick="storeData()">Store Data</button> <button onclick="retrieveData()">Retrieve Data</button> <p id="output"></p><script> function storeData() { localStorage.setItem("name", "John Doe"); } function retrieveData() { var name = localStorage.getItem("name"); document.getElementById("output").innerHTML = name; } </script>
5. Fetch API
Purpose: The Fetch API provides a modern, promise-based interface for making HTTP requests. It replaces older techniques like XMLHttpRequest.
Key Methods:
fetch(url): Makes a network request to the specified URL and returns a promise that resolves to the response.
Example: Fetching data from an API.<button onclick="fetchData()">Fetch Data</button> <p id="data"></p><script> function fetchData() { fetch('https://jsonplaceholder.typicode.com/posts/1') .then(response => response.json()) .then(data => { document.getElementById('data').innerHTML = data.title; }); } </script>
6. Web Workers API
Purpose: The Web Workers API allows you to run scripts in background threads. This is useful for performing CPU-intensive tasks without blocking the user interface.
Key Methods:
new Worker('worker.js'): Creates a new web worker.
postMessage(data): Sends data to the worker.
onmessage: Event handler for receiving messages from the worker.
Example: Simple Web Worker.<script> if (window.Worker) { var myWorker = new Worker('worker.js'); myWorker.postMessage('Hello, worker!'); myWorker.onmessage = function(e) { document.getElementById('output').innerHTML = e.data; }; } </script> <p id="output"></p>
worker.js:onmessage = function(e) { postMessage('Worker says: ' + e.data); };
7. WebSocket API
Purpose: The WebSocket API allows for interactive communication sessions between the user’s browser and a server. This is useful for real-time applications like chat applications, live updates, etc.
Key Methods:
new WebSocket(url): Opens a WebSocket connection.
send(data): Sends data through the WebSocket connection.
onmessage: Event handler for receiving messages.
Example: Connecting to a WebSocket.<script> var socket = new WebSocket('wss://example.com/socket'); socket.onopen = function() { socket.send('Hello Server!'); }; socket.onmessage = function(event) { console.log('Message from server: ', event.data); }; </script>
8. Notifications API
Purpose: The Notifications API allows web applications to send notifications to the user, even when the web page is not in focus.
Key Methods:
Notification.requestPermission(): Requests permission from the user to send notifications.
new Notification(title, options): Creates and shows a notification.
Example: Sending a notification.<button onclick="sendNotification()">Notify Me</button><script> function sendNotification() { if (Notification.permission === 'granted') { new Notification('Hello! This is a notification.'); } else if (Notification.permission !== 'denied') { Notification.requestPermission().then(permission => { if (permission === 'granted') { new Notification('Hello! This is a notification.'); } }); } } </script>
HTML APIs allow you to build rich, interactive web applications by providing access to browser features and capabilities. These APIs are widely supported across modern browsers, making them a vital part of contemporary web development.
Read More…
0 notes
Link
original source : http://stackoverflow.com/questions/10641144/difference-between-getcontext-getapplicationcontext-getbasecontext-and
View.getContext(): Returns the context the view is currently running in. Usually the currently active Activity.
Activity.getApplicationContext(): Returns the context for the entire application (the process all the Activities are running inside of). Use this instead of the current Activity context if you need a context tied to the lifecycle of the entire application, not just the current Activity.
ContextWrapper.getBaseContext(): If you need access to a Context from within another context, you use a ContextWrapper. The Context referred to from inside that ContextWrapper is accessed via getBaseContext().
0 notes
Text
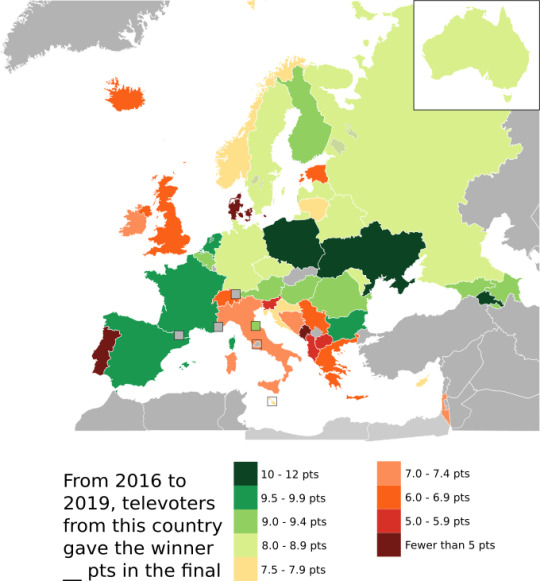
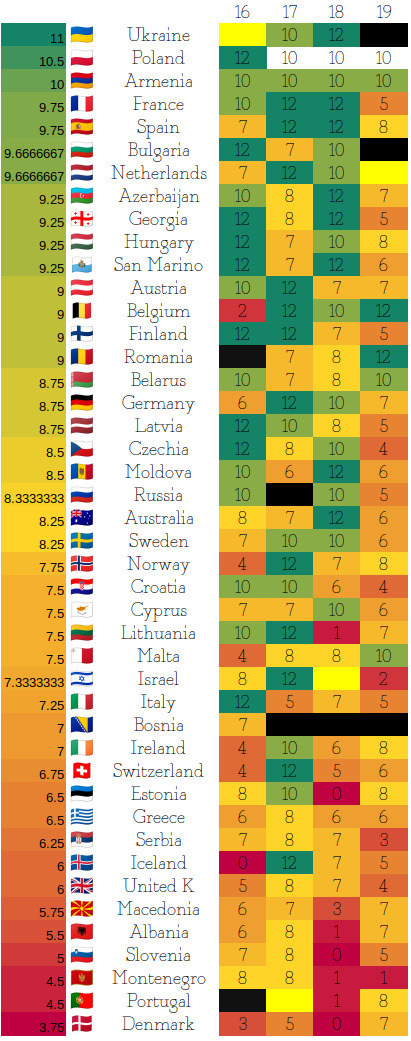
Good afternoon, folks, and welcome to today's statistical Eurovision map! A few days ago, we looked at the concept of bellwethers and whether any national jury was so in line with trends that their 12 could predict the winner - and the research revealed that that country is Israel, who gave their top points to all of the last 4 winners (except themselves xD). I was curious, could there be a country whose televote is similarly useful for predicting winners?
The answer is - there is no country that has a perfect track record in their televote for giving maximal points to the winners, but a few come close. Ukraine has the highest average of pts given to the winner, having given Toy 12 and APD 10, but two years is too few years to call them a bellwether.
I attribute firmer bellwether status to its neighbour Poland, who have given 10 or 12 to every winner in the past four years, or Armenia who have given 10 to each one. France and Spain are the next closest, with both having given 12 to APD and Toy - France gave 1944 near top marks (10) but only 5 to Arcade, whilst Spain gave top 4 marks (7 to 1944, 8 to Arcade) to both.
Generally, televoters are less likely to snub winning entries than jurors are - on average, each country's televoters gave 7.83 pts to winning songs, compared to 6.45 from juries. 18 countries' juries gave 6 or lower on average to winning songs; only 6 countries' televoters did. However, there are some countries whose televote is way out of whack with the rest of Europe, most significantly Denmark who have only given 3.75 pts on average to each winner. Montenegro, with its 4.5 pts on average from televoters and 0.0 pts average from juries, is the country whose combined pts to winning songs is the lowest of all. A full data table is available below!
var ctx = document.getElementById("canvas").getContext("2d"); // #g855 ctx.save(); ctx.transform(3.779530, 0.000000, 0.000000, 3.779530, -187.438000, -72.666000); ctx.restore();
#eurovision#maps#statistics#esc 2021#bellwether#ewan mcgregor#eurovision song contest#eurovision 2021
13 notes
·
View notes
Text
Day 7/30 : coding challenge


07 Oct 2021~
Hey, so it was a pretty okay day today. I'd some javascript practice in morning. Attended online classes, went on a walk. Even during oct it's still hot here. I also started express.js tutorial hopefully will be able to finish that next week. Then I decided to make a canvas kinda website, by using getContext() func, but I'm feeling kinda sleepy rn. I'll do that tomorrow. I feel like I'm learning a little slow, but who knows?🐢
Anyways hope everyone have a good Thursday, stay hydrated, stay smexy<3!
#coding#getting shit done#goal setting#motivation#positivity#study blog#study blr#study challenge#studyinspo#programming#university#motivateyourself
4 notes
·
View notes
Text
Animation in JavaScript
Introduction
There are three methods to create an animation.
By using the properly named CSS animations.
By using CSS transitions.
By writing code in JavaScript.
In this article, we will take a look at how to do some basic animations in JavaScript.
Description
Animation is pretty simple and easy.
Draw a varying scene many times per second.
We essential data about their location, size, shape, and so on when drawing ships and asteroids.
This data would be used to translate and rotate the context as a result all looks in the right place.
We update the data every frame and redraw the scene over and over as the data changes to animate a scene.
Importance of Animate Using
JavaScript
Our browser does a great deal of the actual animating for us when we are animating something in CSS using transitions or animations.
All we actually do is just define the starting state and the ending state for both transitions and animations.
We define a few intermediate states as well if our animation has keyframes.
We have random property values defined at certain points in the animation’s life.
It is the exclamation of the values between these points that are very vital to make the animation work.
It is precisely this outburst that our browser does for us.
We need to be pretty precise about our keyframes the many points in time we want our properties to have a certain value.
This accuracy makes animating a lot of realistic scenarios very difficult.
Using JavaScript, the door is wide open for us to create any type of animation we want without upsetting about technical feasibility as we have better control over all features of how our animation will behave.
For instance, creating rather like the falling snow effect without using JavaScript will be very problematic.
Handling an animation
Figures are drawn to the canvas by using the canvas methods directly and by calling custom functions.
We only realize these results look as if on the canvas when the script finishes performing in normal circumstances.
For example, it isn’t likely to do an animation from inside a for a loop.
It means we require a method to execute our drawing functions in excess of a period of time. There are two ways to control an animation like this.
Scheduled updates
For calling a specific function over a period of time, we use following functions;
setInterval(),
setTimeout(), and
requestAnimationFrame()
setInterval ()
Starts frequently performing the function stated by function every delay milliseconds.
setTimeout()
Performs the function stated by function in delay milliseconds.
requestAnimationFrame (callback)
Conveys the browser that we wish to execute an animation.
Requests that the browser calls a definite function to update an animation before the next repaint.
A Moving Circle
Let’s begin with a very simple scene as a single moving circle.
The circle has an x- and y-coordinates position on the canvas that we will move.
Create a new folder in the normal way.
Copy over the drawing.js library and stylesheet.
Make a new file exercise6.html with the below code.
<!doctype html> <html> <head> <title>Animation</title> <link rel="stylesheet" href="styles.css"> <script src="drawing.js"></script> </head> <body> <h1>Animation</h1> <canvas id="asteroids" width="300" height="300"></canvas> <script> var context = document.getElementById("asteroids"). getContext("2d"); context.strokeStyle = "white"; context.lineWidth = 1.5; var x = 0, y = context.canvas.height / 2; function frame() { context.clearRect(0, 0, context.canvas.width, context. canvas.height); draw(context); update(); } function update() { x += 1; } function draw(ctx) { draw_grid(ctx); ctx.beginPath(); ctx.arc(x, y, 40, 0, 2 * Math.PI); ctx.fill(); ctx.stroke(); } setInterval(frame, 1000.0/60.0); // 60 fps </script> </body> </html>
The code is generally acquainted, however, there are a few new things to notice.
Main, we’re keeping the x- and y-coordinates as global variables.
We’ve similarly updated our code into a sequence of functions as a frame, update, and draw.
The frame function prepares three separate things.
It frees the canvas using the context.clearRect method.
Formerly it calls the draw function that draws a circle at positions x, y.
It calls the update function that moves the x-coordinate one pixel to the right.
The last new thing is the call to setInterval that schedules the frame function to be called 60 times per second.
Each time the frame function is called as a result.
It clears the canvas, draws a grid, draws a circle at the current position, and moves the position to the right.
The call to setInterval passes in the function to be called frame
The time interval in milliseconds between calls is 1000.0 / 60.0.
Therefore, the frame function is called every sixtieth of a second.
The circle moves to the right at 60 pixels per second.
It’s not extended visible, then the value of x continues to increment once the circle moves beyond the end of the canvas.
For more details visit:https://www.technologiesinindustry4.com/2021/10/animation-in-javascript.html
0 notes
Link

Top 20 Android Interview questions you must prepare for Android
Android Application developers are in great demand in this modern era, and it is also one of the highest-paying career. As a result, many tech-savvy individuals are attempting to get into this field.
Many multinational corporations (MNCs) and small businesses offer tough interview questions.
This article contains a list of Android interview questions and answers that will be useful to both freshers and experienced professionals who seeking for Android career.

Android activity life cycle
1. Latest version of Android
Android 11- September 8, 2020 – API Level – 30
2. What are the different stages of the Activity life cycle in Android?
onCreate
onStart
onResume
onPause
onStop
onRestart
onDestroy
3. What are the types of intents in Android?
Two types of intent in Android .
Implicit Intent Implicit intent does not specify any components. It is used to invoke an actions.
Explicit Intent Explicit intents used to start an activity, send data between two activities.
4. What is the use of AndroidManifest.xml file in Android application?
AndroidManifest.xml file includes all components in an Android application such as the activities, services, content providers, broadcast receivers.
5. What is a Toast ?
Toast is a small piece of message displayed on the screen, similar to tooltips and popup notifications. We can define a time such as LENGTH_SHORT and LENGTH_LONG to specifying the duration of toast message to be displayed on the screen.
6. Why we need to use fragments is Android?
Fragments help to create UI rich design for the app, pass data between different screens, and we can split a single screen into multiple subdivisions to improve our app performance.
7. Why WebView?
WebView in Android used to display web page in the application. This can be done by using the loadUrl() and loadData() methods. The WebView can only display the online content to the particular Android activity.
8. What are the components in an Android project explorer?
The Android Studio project explorer contains all files needed to make up the project. There are two sub folders in the project explorer.
app – The app folder again have three sub folders such as manifest, java, res.
Gradle Scripts – The dependency file such as the java libraries, other plugins.
9. What are activities?
Activities in Android application are the screens that displayed on a device. An app can contain more than one activity, meaning one or more screens.
10. What is mean by screen orientation in Android?
Screen orientation is a property of activity to define the change from one state to another. There are various type of screen orientations they are portrait, landscape, sensor, unspecified etc.
11. Difference between activities and services?
Activities in Android application are the screens that displayed on a device. A Service in Android used to perform long-running operations in the background.
12. Use of bundle in Android?
Bundle in Android is used to pass data between Activities.
13. Different types of dialog boxes in Android?
There are four type of Android dialogs
Alert Dialog.
DatePicker Dialog.
TimePicker Dialog.
Custom Dialog.
14. Difference between compileSdkVersion and targetSdkVersion?
The compileSdkVersion that defines which Android SDK version will be used by Gradle to compile the application. The targetSdkVersion property specifies the Android version for which the app was built and tested.
15. apk stands for _____?
Android Application Package
16. What is an Adapter in Android?
The adapter is to act as a bridge between the adapter and its related data.
17. What is mean by Views in Android?
The UI elements in Android are called Views. Eg: EditText, Button, CheckBox, etc.
18. Difference between context menu and popup menu?
A context menu appears when user press long click on the view. A popup Menu is a list menu that appears vertically on the view.
19. Difference between getContext(), getApplicationContext(), getBaseContext()?
getContext() – Returns the context of current activity. getApplicationContext() – Used to return the context for the activities running in an application. getBaseContext() – Used to access context of one activity from another context.
20. What is a Resource File?
The res folder in Android project explorer have all type of resources such as image, video, logo icons and values for the application.
It is very important to take a training for Android to get a confidence to attend all interviews. So, you can plan to join for an android app development training in Kochi to know more in depth about the tips and tricks related to the development process. You can get the confidence to build your own app, along with the latest technologies that will help you improve your coding style. We are one of the android training center in Kochi, and we would be delighted to assist you in improving your Android career.
0 notes
Text
HarmonyOS NEXT Practical: Sandbox Tool
Objective: Encapsulate the sandbox tool to save files to the sandbox and clear sandbox files.
Knowledge points: Before using this function module to operate on files/directories, it is necessary to first obtain the application sandbox path, retrieval method, and interface:getContext().cacheDir
fs: Before using this function module to operate on files/directories, it is necessary to first obtain their application sandbox path. The string representing the sandbox path is called 'path'. Please refer to 'Application Context - Get Application File Path' for the retrieval method and interface usage. The string pointing to a resource is called a URI. For interfaces that only support path as an input parameter, the URI can be converted to path by constructing a fileUri object and obtaining its path property, and then using the file interface.
fs.open: Open the file and use Promise asynchronous callback. [code] open(path: string, mode?: number): Promise [/code] path: The application sandbox path or file URI of the file. mode: The option to open a file must specify one of the following options, which will be opened in read-only mode by default:
OpenMode. READ_ONLY(0o0): Read only open.
OpenMode. WRITE_ONLY(0o1): Only write open.
OpenMode. READ_WRITE(0o2): Read and write open. Given the following functional options, append them in a bitwise or manner, and no additional options are given by default:
OpenMode. CREATE(0o100): If the file does not exist, create the file.
OpenMode. TRUNC(0o1000): If the file exists and has write permission, crop its length to zero.
OpenMode. APPEND(0o2000): Open in append mode, and subsequent writes will be appended to the end of the file.
OpenMode. NONBLOCK(0o4000): If the path points to a FIFO, block special file, or character special file, then this open and subsequent IO operations will be non blocking.
OpenMode. DIR(0o200000): If the path does not point to a directory, an error occurs. Do not allow additional write permissions.
OpenMode. NOFOLLOW(0o400000): If the path points to a symbolic link, an error occurs.
OpenMode. SYNC(0o4010000): Open files in synchronous IO mode.
fs.access: Check if the current process can access a file and use Promise asynchronous callback. fs.mkdirSync: Create a directory using synchronous methods. fs.copyFile: Copy the file and use Promise asynchronous callback. fs.close: Close the file and use Promise asynchronous callback. fs.rmdir: Delete the entire directory and use Promise to return asynchronously. fs.listFileSync: List all file names in the folder synchronously. Support recursive listing of all file names (including subdirectories) and file filtering.
Actual combat: SandboxUtil [code] import fs from '@ohos.file.fs'; import { util } from '@kit.ArkTS'; import { BusinessError } from '@kit.BasicServicesKit';
/**
沙箱工具类 */ class SandboxUtil { private sandboxDir:string ='/sandbox' /**
保存文件到沙箱
@param src
@returns 沙箱地址 */ async saveToSandbox(src: string): Promise { let sandboxUri: string = '' for (let index = 0; index < src.length; index++) { const uri = src; try { const originalFile = await fs.open(uri) const targetFileDirPath = getContext().cacheDir + this.sandboxDir const fileName = util.generateRandomUUID() + uri.split("/").pop() ?? '' if (!fs.accessSync(targetFileDirPath)) { fs.mkdirSync(targetFileDirPath, true) } const targetFile = await fs.open(${targetFileDirPath}/${fileName}, fs.OpenMode.READ_WRITE | fs.OpenMode.CREATE) await fs.copyFile(originalFile.fd, targetFile.fd) await fs.close(originalFile.fd); await fs.close(targetFile.fd); sandboxUri=targetFile.path } catch (e) { const err = e as BusinessError console.error([log]MediaPicker saveToSandbox, err=${JSON.stringify(err)}); //err.code == 13900001 文件失效 } } return sandboxUri } /**
清除沙箱文件 */ clear() { const targetFileDirPath = getContext().cacheDir + this.sandboxDir fs.rmdir(targetFileDirPath); } /**
获取沙箱路径下所有文件名,支持递归列出所有文件名(包含子目录下),并以日志形式打印
用于检查沙箱情况 */ print() { const targetFileDir = getContext().cacheDir + this.sandboxDir if (fs.accessSync(targetFileDir)) { let listFile = fs.listFileSync(targetFileDir, { recursion: true }) let listFileStr = listFile.join('\n'); console.log([log]postVideoSandbox print, listFileStr=${JSON.stringify(listFileStr)}); } else { console.log([log]postVideoSandbox print, 目标文件不存在, targetFileDir=${JSON.stringify(targetFileDir)}); } } }
const sandboxUtil = new SandboxUtil()
export default sandboxUtil [/code] use [code] import sandboxUtil from './SandboxUtil';
@Entry @Component struct SandboxDemoPage { @State message: string = 'SandboxDemo';
build() { Column() { Text(this.message) .fontSize($r('app.float.page_text_font_size')) .fontWeight(FontWeight.Bold) Button('保存文件') .onClick(()=>{ sandboxUtil.saveToSandbox('fielPath') }) Button('删除文件') .onClick(()=>{ sandboxUtil.clear() }) } .height('100%') .width('100%') } } [/code]
0 notes
Text
Tạo hình nền điện thoại icon thương thương phát sáng

Hiệu ứng mới độc quyền trên taoanhdep.com để tạo hình nền điện thoại có icon Thương thương và các biểu tượng cảm xúc facebook khác phát sáng lơ lửng trên bàn tay. Hướng dẫn: - Nhấn nút chọn ảnh nền của bạn (Nên lựa hình cảnh buổi tối). - Nhấn nút Tạo ảnh - Nhấn nút Tải ảnh này hoặc giữ vào ảnh 3 giây để lưu ảnh.

Kiểu 1

Kiểu 2
$(document).ready(function(){$(".chonmau input").click(function(){$(".tad-main").removeClass("mau1");$(".tad-main").removeClass("mau2");$(".tad-main").addClass($("input:checked").val())}); $("#khungvienanh").click(function(){ $(".tad-main").toggleClass("bovien"); }); $("#maunen").click(function(){ $(".tad-main").toggleClass("bomau"); }); $("#botron").click(function(){ $(".anhdacat").toggleClass("botron"); }); });.xulyhinhanh img{margin:0!important}.chonanh-avt{width:38px;height:38px;float:left;border:1px solid #ddd;border-radius:5px;overflow:hidden;margin-right:10px}.img-preview{width:36px;height:36px;background:url(//2.bp.blogspot.com/-ZTMZs1MahXE/XqZq3WgQKDI/AAAAAAAAdRI/ib4MFhw49m82VLY9b2LzZBw5w3tItLSrQCK4BGAYYCw/s36/thumbnail-man.png);background-size:36px;background-position: center;}#chonanhModal{display:block!important}#chonanhModal:not(.show){opacity:0;visibility:hidden}.img-container,.img-preview{background-color:#f7f7f7;text-align:center;width:100%}.img-container{margin-bottom:1rem;max-height:300px;min-height:280px}.img-container>img{max-width:100%}.img-preview{margin: auto;margin-bottom:.5rem;margin-right:.5rem;overflow:hidden}.img-preview>img{max-width:100%} #temp{position:fixed;height:0;top:0;left:0;overflow:hidden}.tad-main { width: 1080px; height: 1920px; background: #333; position: relative; }.tad-main canvas { width: 1080px; height: 1920px; position: absolute; top: 0; left: 0; }.tad-tichxanh { background: url(https://2.bp.blogspot.com/-1tC_fjB32Qg/XrD09QNnthI/AAAAAAAAd2w/cLY--1dRZ3IB1RSVgFsmMCLY5i-586KAQCNcBGAsYHQ/s0/banquyen-taoanhdep-bg-1.png); width: 1080px; height: 1920px; position: absolute; z-index: 9; }.tad-main.mau2 .tad-tichxanh{ background: url(https://4.bp.blogspot.com/-1Ffi0W5oYgY/XrD09YAuGYI/AAAAAAAAd20/BtdHCxDn8J47JbL7POKof859g1vR_5YJgCNcBGAsYHQ/s0/banquyen-taoanhdep-bg-2.png); } Upload ảnh ( jpg, png,... )*
Chọn ảnh
Chọn ảnh từ thiết bị
×
Chọn ảnh
Cắt ảnh
Tạo ảnh
Loading...
Tải ảnh này
$('#taianhve')['hide'](); $('#btnScreenShot')['attr']('disabled', 'false'); $('#cropanh')['click'](function() { $('#btnScreenShot')['removeAttr']('disabled') }); $('#btnScreenShot')['click'](function() { $('#taianhve')['show']() }); var $btn = document['getElementById']('btnScreenShot'); var getimg = ''; $btn['addEventListener']('mousedown', onScreenShotClick); function onScreenShotClick(_0x67c5x4) { $('.load-anh')['show'](); html2canvas(document['querySelector']('.tad-main'), { useCORS: !0, scrollX: 0, scrollY: 0, width: 1080, height: 1920, scale: 1 })['then']((_0x67c5x5) => { var _0x67c5x6 = _0x67c5x5['toDataURL']('image/jpeg'); $('#img-out')['html']('<img src=\'' + _0x67c5x6 + '\' alt=\'\u1EA2nh instagram\' class=\'img-thumbnail\'>'); getimg = _0x67c5x6; $('.load-anh')['hide'](); $('#taianhve')['show']() }); $('#taianhve')['click'](function() { $(this)['attr']('download', 'taoanhdep_hinhnenthuongthuong.jpg')['attr']('href', getimg) }) } window['onload'] = function() { 'use strict'; var _0xa3dbx1 = window['Cropper']; var _0xa3dbx2 = window['URL'] || window['webkitURL']; var _0xa3dbx3 = document['querySelector']('.img-container'); var _0xa3dbx4 = _0xa3dbx3['getElementsByTagName']('img')['item'](0); var _0xa3dbx5 = document['getElementById']('download'); var _0xa3dbx6 = document['getElementById']('actions'); var _0xa3dbx7 = { aspectRatio: 9 / 16, viewMode: 1, preview: '.img-preview', autoCrop: true, strict: true, background: true, autoCropArea: 1 }; var _0xa3dbx8 = new _0xa3dbx1(_0xa3dbx4, _0xa3dbx7); var _0xa3dbx9 = _0xa3dbx4['src']; var _0xa3dbxa = 'image/jpeg'; var _0xa3dbxb; if (!document['createElement']('canvas')['getContext']) { $('button[data-method="getCroppedCanvas"]')['prop']('disabled', true) }; if (typeof document['createElement']('cropper')['style']['transition'] === 'undefined') { $('button[data-method="rotate"]')['prop']('disabled', true); $('button[data-method="scale"]')['prop']('disabled', true) }; _0xa3dbx6['querySelector']('.docs-buttons')['onclick'] = function(_0xa3dbxc) { var _0xa3dbxd = _0xa3dbxc || window['event']; var _0xa3dbxe = _0xa3dbxd['target'] || _0xa3dbxd['srcElement']; var _0xa3dbxf; var _0xa3dbx10; var _0xa3dbx11; var _0xa3dbx12; if (!_0xa3dbx8) { return }; while (_0xa3dbxe !== this) { if (_0xa3dbxe['getAttribute']('data-method')) { break }; _0xa3dbxe = _0xa3dbxe['parentNode'] }; if (_0xa3dbxe === this || _0xa3dbxe['disabled'] || _0xa3dbxe['className']['indexOf']('disabled') > -1) { return }; _0xa3dbx12 = { method: _0xa3dbxe['getAttribute']('data-method'), target: _0xa3dbxe['getAttribute']('data-target'), option: _0xa3dbxe['getAttribute']('data-option') || undefined, secondOption: _0xa3dbxe['getAttribute']('data-second-option') || undefined }; _0xa3dbxf = _0xa3dbx8['cropped']; if (_0xa3dbx12['method']) { if (typeof _0xa3dbx12['target'] !== 'undefined') { _0xa3dbx11 = document['querySelector'](_0xa3dbx12['target']); if (!_0xa3dbxe['hasAttribute']('data-option') && _0xa3dbx12['target'] && _0xa3dbx11) { try { _0xa3dbx12['option'] = JSON['parse'](_0xa3dbx11['value']) } catch (_0xa3dbxd) { console['log'](_0xa3dbxd['message']) } } }; switch (_0xa3dbx12['method']) { case 'rotate': if (_0xa3dbxf) { _0xa3dbx8['clear']() }; break; case 'getCroppedCanvas': try { _0xa3dbx12['option'] = JSON['parse'](_0xa3dbx12['option']) } catch (_0xa3dbxd) { console['log'](_0xa3dbxd['message']) }; if (_0xa3dbxa === 'image/jpeg') { if (!_0xa3dbx12['option']) { _0xa3dbx12['option'] = {} }; _0xa3dbx12['option']['fillColor'] = '#fff' }; break }; _0xa3dbx10 = _0xa3dbx8[_0xa3dbx12['method']](_0xa3dbx12['option'], _0xa3dbx12['secondOption']); switch (_0xa3dbx12['method']) { case 'rotate': if (_0xa3dbxf) { _0xa3dbx8['crop']() }; break; case 'scaleX': ; case 'scaleY': _0xa3dbxe['setAttribute']('data-option', -_0xa3dbx12['option']); break; case 'getCroppedCanvas': if (_0xa3dbx10) { $('.anhdacat')['html'](_0xa3dbx10); if (!_0xa3dbx5['disabled']) { _0xa3dbx5['href'] = _0xa3dbx10['toDataURL'](_0xa3dbxa) } }; break; case 'destroy': _0xa3dbx8 = null; if (_0xa3dbxb) { _0xa3dbx2['revokeObjectURL'](_0xa3dbxb); _0xa3dbxb = ''; _0xa3dbx4['src'] = _0xa3dbx9 }; break }; if (typeof _0xa3dbx10 === 'object' && _0xa3dbx10 !== _0xa3dbx8 && _0xa3dbx11) { try { _0xa3dbx11['value'] = JSON['stringify'](_0xa3dbx10) } catch (_0xa3dbxd) { console['log'](_0xa3dbxd['message']) } } } }; document['body']['onkeydown'] = function(_0xa3dbxc) { var _0xa3dbxd = _0xa3dbxc || window['event']; if (!_0xa3dbx8 || this['scrollTop'] > 300) { return }; switch (_0xa3dbxd['keyCode']) { case 37: _0xa3dbxd['preventDefault'](); _0xa3dbx8['move'](-1, 0); break; case 38: _0xa3dbxd['preventDefault'](); _0xa3dbx8['move'](0, -1); break; case 39: _0xa3dbxd['preventDefault'](); _0xa3dbx8['move'](1, 0); break; case 40: _0xa3dbxd['preventDefault'](); _0xa3dbx8['move'](0, 1); break } }; $('.cropanh-container')['hide'](); var _0xa3dbx13 = document['getElementById']('inputImage'); if (_0xa3dbx2) { _0xa3dbx13['onchange'] = function() { var _0xa3dbx14 = this['files']; var _0xa3dbx15; if (_0xa3dbx8 && _0xa3dbx14 && _0xa3dbx14['length']) { _0xa3dbx15 = _0xa3dbx14[0]; if (/^image\/\w+/ ['test'](_0xa3dbx15['type'])) { _0xa3dbxa = _0xa3dbx15['type']; if (_0xa3dbxb) { _0xa3dbx2['revokeObjectURL'](_0xa3dbxb) }; _0xa3dbx4['src'] = _0xa3dbxb = _0xa3dbx2['createObjectURL'](_0xa3dbx15); _0xa3dbx8['destroy'](); _0xa3dbx8 = new _0xa3dbx1(_0xa3dbx4, _0xa3dbx7); _0xa3dbx13['value'] = null; $('.cropanh-container')['show'](); $('.btn-upanh span,.btn-chonanh')['html']('<i class=\'fas fa-upload\'> Ch\u1ECDn \u1EA3nh kh\xE1c') } else { window['alert']('Please choose an image file.') } } } } else { _0xa3dbx13['disabled'] = true; _0xa3dbx13['parentNode']['className'] += ' disabled' } };
Nguồn: https://www.share123bloggertemplates.com/
from Template Blogspot Bán Hàng, Bất Động Sản Đẹp tại Share123 Blogger Templates https://www.share123bloggertemplates.com/2020/05/tao-hinh-nen-ien-thoai-icon-thuong.html via Nguồn: https://www.share123bloggertemplates.com/
0 notes
Text
プロトタイプベイズドな言語のコンストラクタ

ES2015 で JavaScript に追加されたという、class 構文��� ClojureScript で書いてみることに。 内部で保持する情報(canvasElement)が重たいためか、コンソールログを吐かないと、メソッド定義「drawRect」が有効にならない、という挙動がみられた。 greeting 処理(「こんにちは、〜さん」的な)に渡すような、文字列(名前)程度なら、保持させても問題なかったんだけど…)。 ;;=================== (defn Canvas2DUtility [canvas] (this-as this (set! (.-canvasElement this) canvas) (set! (.-context2d this) (.getContext (.-canvasElement this) "2d")) ;; これがないとメソッド定義が有効にならない。バグ? (.log js/console "constractor: Canvas2DUtility") )) (set! (.. Canvas2DUtility -prototype -drawRect) (fn [color x y width height] (this-as this (let [ctx (.-context2d this)] (set! (.-fillStyle ctx) color) (.fillRect ctx x y width height)) )))
;;=================== (defn initialize [] (let [canvas (.querySelector js/document.body "#main_canvas") util (Canvas2DUtility. canvas)]
(.drawRect util "white" 50 50 10 15) )) ;;=================== Inheritance in JavaScript & ClojureScript [ https://nextjournal.com/joe-loco/inheritance-js-cljs ]
0 notes
Link
This blog post is Part 2 of the blog post series on Building Real-Time TV Dashboards with Salesforce Data, Platform Events & a Raspberry Pi. Part 1 – The Intro Part 2 – Salesforce Setup Part 3 – Raspberry Pi Setup Let’s get started with the Raspberry Pi setup. The idea is to have the Dashboard running on the Pi. This can be done in various different ways but for the sake for this project we will be hosting and running the dashboard on the Raspberry Pi. We will be building the Dashboard using the LWC OSS (Lightning Web Components Open Source) Framework. Pro Tip (Optional but totally worth trying out): Setup SSH and VNC on the Pi for super easy remote development and remote control. Step 0: Install the OS (Skip this step if you already have the OS installed) I am using Raspbian OS on my Pi and I set it up using NOOBS – New Out Of the Box Software and it makes the installation very easy. Here is a comprehensive step by step guid on installing the OS using NOOBS – https://www.raspberrypi.org/help/noobs-setup/2/ Step 1: Disable the Screensaver This is an important step because by default the PI’s screen keeps blanking out every 15 mins. As we will be having a standalone realtime dashboard running on the PI, we need to have our screensaver disabled. Easiest way to get this done is by installing xscreensaver. In the Terminal, run the following command to install it. This might take a few minutes $ sudo apt-get install xscreensaver Once installed, go to Preferences option in the main desktop menu. You should find the screen saver application. Launch it and search for the option to disable it completely. Step 2: Install Node.js Run the following commands in the Terminal Update your system package list sudo apt-get update Upgrade all your installed packages to their latest version sudo apt-get dist-upgrade Download the latest version of Node.js curl -sL https://deb.nodesource.com/setup_12.x | sudo -E bash - Install it sudo apt-get install -y nodejs To check if the installation was successful, run the following command and it should return the version number of Node.js node -v Step 3: Create LWC App The Dashboard Interface is an LWC App. So, the goal is to have an LWC App running on the Raspberry Pi and it is totally up to you on how and where you build the LWC app. As long as there is an LWC App to be run on the Pi, you can either develop it on the Pi or develop it somewhere else(like your local machine) and migrate it to the Pi. For example, I developed it on my local machine and pushed it to the Pi via version control(bitbucket) so that I could maintain a backup and also sync code changes between my system and the pi. Feel free choose which ever way you are comfortable with and make sure you have Node.js installed as it is required to develop and run LWC Apps. 3.1 Create tv-dashboard LWC App On the command line/terminal, run command: npx create-lwc-app tv-dashboard When prompted about the application details, fill in the details as following Package name for npm: Press Enter to accept the default Description: Type the app description or press Enter to accept the default Author: Type your name or press Enter to accept the default Version: Press Enter to accept the default License: Press Enter to accept the default Who is the GitHub owner of the repository ( https://github.com/OWNER/repo): Type in your GitHub owner name or leave it blank and press Enter What is the GitHub name of the repository ( https://github.com/owner/REPO): Type in your GitHub repo name or Press Enter to accept the default Select a package manager: Use your arrow keys to select npm press Enter Use TypeScript or JavaScript: Use your arrow keys to select JavaScript press Enter Use custom Express server configuration: Enter y to install the server and press Enter Once the application is created, you will see the following message: Created conference-app in /YOUR/FILE/STRUCTURE/tv-dashboard. Checkout the `scripts` section of your `package.json` to get started. 3.2 Install A Few Packages Open command line/terminal Navigate to the directory containing the tv-dashboard application cd tv-dashboard Run the following command: npm install jsforce dotenv socket.io chart.js @salesforce-ux/design-system But, what are these applications and why do we need them? jsforce – JavaScript library to interact with Salesforce Orgs and APIs dotenv – To store our Salesforce credentials as environment variables in a .env file and reference them in or app socket.io – JavaScript library that enables real-time bidirectional event-based communication. We are using this to communicate our platform events from the LWC Server to LWC Frontend(charts). Works in a pub-sub model. chart.js – JavaScript library to create simple and beautiful HTML5 charts using canvas elements @salesforce-ux/design-system – Salesforce Lightning Design System (SLDS) – CSS framework to make our app beautiful 3.3 Create the .env file and declare our salesforce credentials as environment variables Open the tv-dashboard application folder Create a file with .env (with a leading period) as file name. Make sure that you are creating this folder in the root folder i.e., tv-dashboard Add the following the content into the .env file .env SF_LOGIN_URL=https://login.salesforce.com SF_USERNAME=YOUR_USERNAME SF_PASSWORD=YOUR_PASSWORD SF_TOKEN=YOUR_SECURITY_TOKEN Make sure to update the above placeholder values with your data SF_USERNAME: Your Salesforce Org’s username. SF_PASSWORD: Your Salesforce Org’s password. SF_TOKEN: Your Salesforce Org’s security token. 3.4 Update lwc-services.config.js to use the Lightning Design System SLDS In the tv-dashboard application folder, open the scr folder Open the file lwc-services.config.js Add the following in the resources section of your config { from: 'node_modules/@salesforce-ux/design-system/assets', to: 'dist/resources/assets' } 3.5 Add LWC Express Server Code In the tv-dashboard application folder, open folder server Open the file index.js Add the following code at the beginning of the file (before the line module.exports) src/server/index.js console.log(`Running server on port ${PORT}`)); // Start backend server server.listen(PORT, openDashboard); function openDashboard() { console.log(`Running socket server on port ${PORT}`); if (npm_lifecycle_event === 'serve') { console.log('Launching Dashboard!!'); exec( 'chromium-browser --noerrdialogs --kiosk http://0.0.0.0:3002 --incognito --disable-translate' ); } } 3.6 EDIT Client INDEX.html to add SLDS Stylesheet In the tv-dashboard application folder, open folder client Open the file index.html Replace the file content with the following code /src/client/index.html 3.7 Edit Client INDEX.js to use Synthetic Shadow DOM for the app and components to be able to use SLDS In the tv-dashboard application folder, open folder client Open the file index.js Add the following code at the beginning of the file content import '@lwc/synthetic-shadow'; 3.8 Create LWC Chart Component for visualising Opportunity Count By their Stage In the tv-dashboard application folder, open the folder my Create a folder named opportunitiesByStage Inside opportunitiesByStage folder, create a file opportunitiesByStage.html with the following content /src/client/modules/my/opportunitiesByStage.html Inside opportunitiesByStage folder, create a file opportunitiesByStage.js with the following content /src/client/modules/my/opportunitiesByStage.js import { LightningElement, api, track } from 'lwc'; export default class opportunitiesByStage extends LightningElement { @api sobject = ''; @api socket; @track socketInitialized = false; @track chartInitialized = false; chart; //object to keep track of the number of opportunities per stage chartData = {}; chartConfig = { type: 'doughnut', data: { datasets: [ { data: [], backgroundColor: [ '#3296ED', '#9D53F2', '#E287B2', '#26ABA4', '#77B9F2', '#C398F5', '#4ED4CD' ] } ], labels: [] }, options: { responsive: true, elements: { arc: { borderWidth: 0 } }, legend: { position: 'right', labels: { usePointStyle: true } }, animation: { animateScale: true, animateRotate: true } } }; async renderedCallback() { if (!this.socketInitialized && this.socket) { this.initializeSocket(); } if (!this.chartInitialized && this.socketInitialized) { await this.initializeChart(); } } initializeSocket() { //bind the onSocketEvent method to the 'cdc' socket event to update the chart with new incoming data this.socket.on('cdc', this.onSocketEvent.bind(this)); this.socketInitialized = true; } //initialize chart with chart.js async initializeChart() { await require('chart.js'); const ctx = this.template .querySelector('canvas.chart') .getContext('2d'); this.chart = new window.Chart(ctx, this.chartConfig); this.chartInitialized = true; } onSocketEvent(data) { const { changeType, entityName } = data.ChangeEventHeader; // check to make sure the change event is for the configured sobject and the record event is CREATE if ( this.sobject.toLowerCase() !== entityName.toLowerCase() || changeType !== 'CREATE' ) { return; } //update the chartData to increment the corresponding opportunity stage counter this.chartData[data.StageName] = this.chartData[data.StageName] + 1 || 1; //sort chartData in descending order let sortable = Object.entries(this.chartData); sortable.sort(function(a, b) { return b[1] - a[1]; }); //update chartData with sorted data this.chartData = Object.fromEntries(sortable); //add the updated data to the chart object this.chart.data.labels = Object.keys(this.chartData); this.chart.data.datasets[0].data = Object.values(this.chartData); //update the chart to reflect latest data this.chart.update(); } } 3.9 Create an LWC Component to view Chatter Announcements In the tv-dashboard application folder, open the folder my Create a folder named chatterAnnouncement Inside chatterAnnouncement folder, create a file chatterAnnouncement.html with the following content /src/client/modules/my/chatterAnnouncement.html Inside chatterAnnouncement folder, create a file chatterAnnouncement.html with the following content /src/client/modules/my/chatterAnnouncement.js 12 ? hour - 12 : hour; hour = this.formatNumber(hour); min = this.formatNumber(min); sec = this.formatNumber(sec); this.time = `${hour}:${min} ${ap}`; const months = [ 'January', 'February', 'March', 'April', 'May', 'June', 'July', 'August', 'September', 'October', 'November', 'December' ]; const days = [ 'Sunday', 'Monday', 'Tuesday', 'Wednesday', 'Thursday', 'Friday', 'Saturday' ]; const curWeekDay = days[today.getDay()]; const curDay = today.getDate(); const curMonth = months[today.getMonth()]; const curYear = today.getFullYear(); this.date = `${curWeekDay}, ${curDay} ${curMonth}, ${curYear}`; this.dateTime = `${this.date} • ${this.time}`; } formatNumber(num) { return num < 10 ? '0' + num : num; } } 3.10 Edit the App Component to add the Chart and the Chatter Announcements Components and also subscribe to our Socket.io server In the tv-dashboard application folder, open the folder app Open the file app.html and replace its content with the following /src/client/modules/my/app.html Open the file app.js and replace its content with the following code to initialise and subscribe to the backend socket server /src/client/modules/my/app.js { console.log('socket connected!'); this.socketReady = true; }); } async closeSocket() { this.socket.close(); this.socket = null; } } Step 4: Run The Dashboard We run the dashboard on chromium in kiosk mode, this helps show the in dashboard full screen. You can run the dashboard using the following command npm run build && npm run serve If you are developing, making code changes and would like for them to reflecting in real time, use the command npm run watch Note: Only the npm run serve command launches the Dashboard automatically. When using the npm run watch command, you would need manually view the app in the browser. Once you run the dashboard, start creating some Opportunities and Chatter Announcements in your org and you will see the Dashboard update in real-time! Step 5 (Optional): Auto Launch the Dashboard on Raspberry Pi Startup 5.1 Change the LWC Dashboard App Folder Permissions This wouldn’t be necessary if you are created everything on the pi. But when I used Git to sync code, I came across a the EACCESS Permission error and this following terminal command took care of the error. sudo chown -R pi:pi ABSOLUTE_PATH_TO_LWC_APP_FOLDER Make sure to replace the ABSOLUTE_PATH_TO_LWC_APP_FOLDER with the actual absolute path of your Dashboard LWC App folder. To get the absolute path, right click your Dashboard LWC App folder and Select Copy Path(s) 5.2 Create a executable shell script file Open the tv-dashboard folder Create a file with name run.sh and add the below as its content run.sh #!/bin/bash cd ABSOLUTE_PATH_TO_LWC_APP_FOLDER npm run build && npm run serve Make sure to replace the ABSOLUTE_PATH_TO_LWC_APP_FOLDER with the actual absolute path of your Dashboard LWC App folder. To get the absolute path, right click your Dashboard LWC App and Select Copy Path(s) 5.3 Edit the Raspberry Pi Autostart Script Open Terminal Run the following command sudo nano /etc/xdg/lxsession/LXDE-pi/autostart Add the following line to the file @lxterminal --command "ABSOLUTE_PATH_TO_SHELL_SCRIPT_FILE" Make sure to replace the ABSOLUTE_PATH_TO_SHELL_SCRIPT_FILE with the actual absolute path of the shell script created(in the previous step) inside the Dashboard LWC App folder. To get the absolute path, right click the shell script file that you created(in the pervious step) inside the Dashboard LWC App and Select Copy Path(s) Hit Control+S to Save Then Control+X to Exit the editor And… that is it! We learnt how to go about Build Real-Time TV Dashboards with Salesforce Data, Platform Events & a Raspberry Pi. We’ve scratched the surface with just 2 components and here is the tv-dashforce GitHub Project that not only contains the components created in this blog post but also different chart components along with Twitter Live Stream, Clock, Weather and Holidays. Make sure to check it out! GitHub Project- https://github.com/Minerva18/tv-dashforce This can also be done in another way where, we can host the Dashboard LWC App on the cloud like Heroku/AWS/Google etc. and use the URL to show the Dashboard LWC app via chromium kiosk mode on the Raspberry Pi. Raspberry Pi Resources https://www.raspberrypi.org/ What is a Raspberry Pi? https://www.raspberrypi.org/help/what-%20is-a-raspberry-pi/ Raspberry Pi Documentation and Setup Guides https://www.raspberrypi.org/documentation/ Installing OS https://www.raspberrypi.org/documentation/installation/noobs.md SSH Setup Guide https://www.raspberrypi.org/documentation/remote-access/ssh/ VNC Setup Guide https://www.raspberrypi.org/documentation/remote-access/vnc/ Screensaver https://www.raspberrypi.org/documentation/configuration/screensaver.md Securing your Raspberry Pi https://www.raspberrypi.org/documentation/configuration/security.md LED warning flash codes https://www.raspberrypi.org/documentation/configuration/led_blink_warnings.md The post Build Real-Time TV Dashboards with Salesforce Data, Platform Events & a Raspberry Pi – Part 3 – Raspberry Pi Setup appeared first on Minerva18.
0 notes
Text
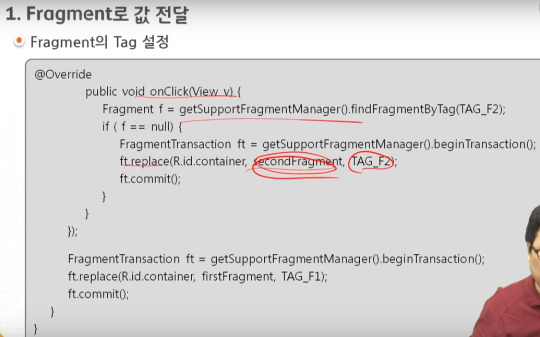
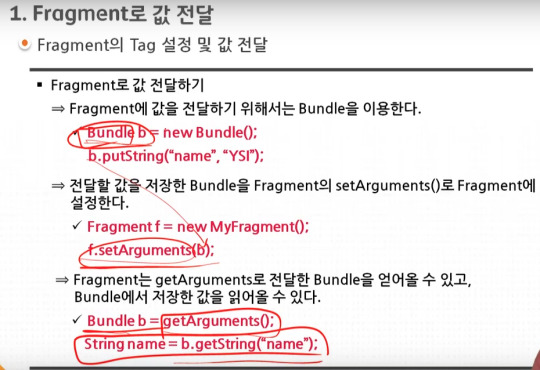
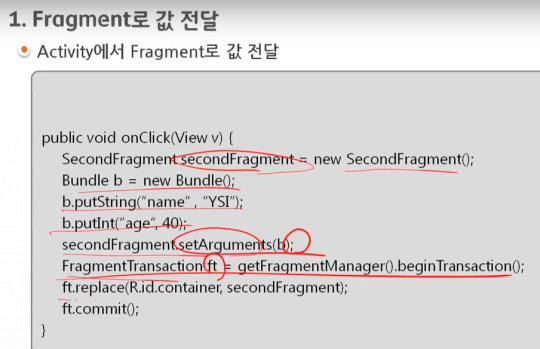
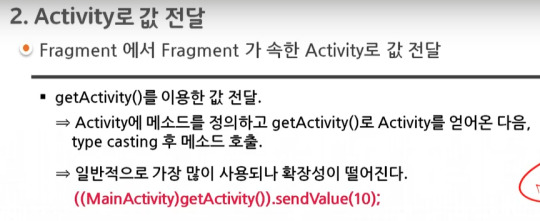
android 초급 29강 Fragment 2 tacademy
original source : https://youtu.be/6YZY5S7XvtM

add, replace에만 tag를 정의 할수 있다. 더해지는 fragment에 tag를 정의하고 나중에 접근 가능하게 한다.
===========================================================..
.
.
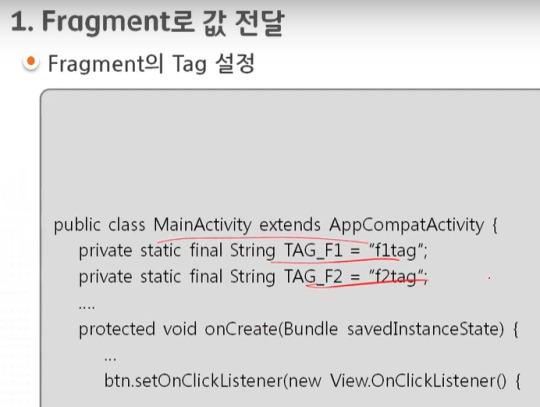
tag를 상수로 정의해서 사용하는 것이 편리하다.
===========================================================..
.
.
===========================================================..
.
.
===========================================================..
.
.

위의 코드에서는 b bundle이 실제 있는지 확인하고 작업을 수행하는 것을 추천한다.
===========================================================..
.
.
===========================================================..
.
.

===========================================================..
.
.
===========================================================..
.
.

===========================================================..
.
.
===========================================================..
.
.
===========================================================..
.
.
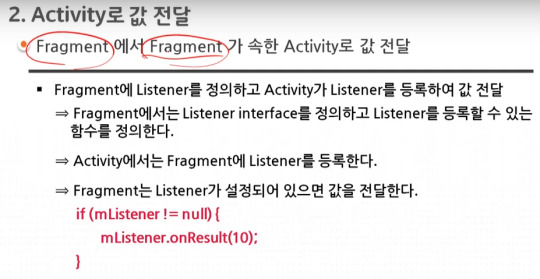
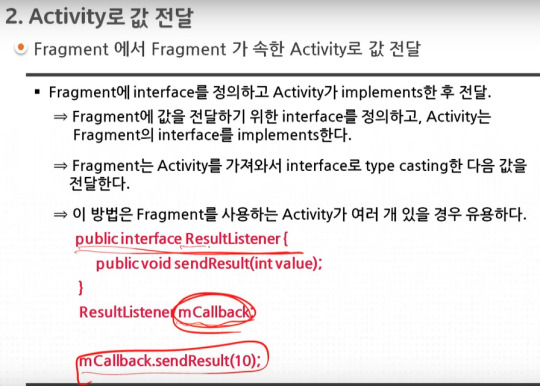
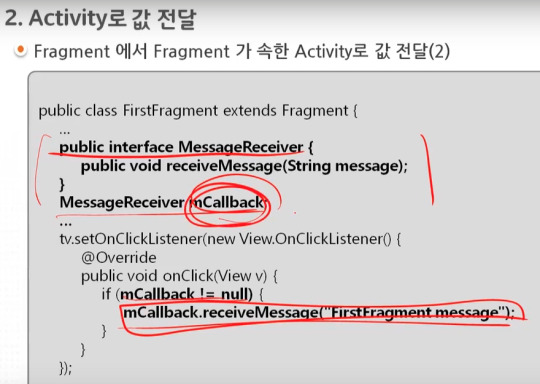
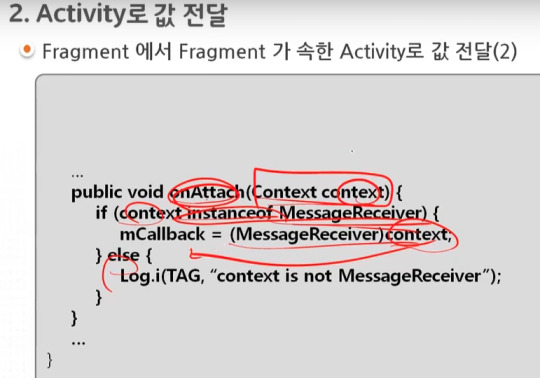
fragment안에 fragment가 있는경우 겹겹으로 listener를 만들어 activity에 정보를 제공할수 있다.
===========================================================..
.
.

===========================================================..
.
.

===========================================================..
.
.

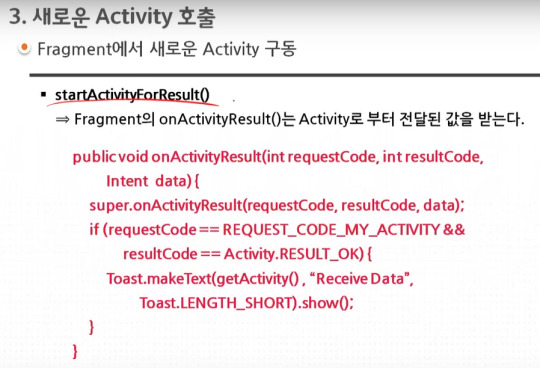
startActivityForResult()의 사용법은 activity의 것과 유사하다. 단 REQUEST_CODE가 2바이트 크기가 된다.
fragment안의 fragment에서는 startActivityForResult 를 사용할수 없다.
===========================================================..
.
.
===========================================================..
.
.
===========================================================..
.
.
===========================================================..
.
.

===========================================================..
.
.

getActivity()를 사용해도 되고 getContext()를 사용해도 된다.
0 notes
Text
How to Create a JavaScript Chart with Chart.js
If you have an information-rich website or application, you might want to visualize your data so that users can better make sense of it. Although tables can be quite useful in certain cases such as pricing and feature comparison tables, other kind of information is easier to process with the help of some kind of data visualization. JavaScript libraries such as Chart.js let you generate different types of HTML5 charts such as line, bar, pie, doughnut, and area charts.
Chart.js is a versatile library that let you create JavaScript charts in a couple of minutes. It has many options with which you can configure all aspects of your charts. In this tutorial, we will look into how to set up the Chart.js library, what your options are, and what you can achieve with it. We will also create two charts: a bar chart showing life expectancy in six countries and a doughnut/pie chart showing the recommended daily diet.

Add Chart.js to Your HTML Page
You can install Chart.js in different ways. If you want to store the entire library locally, you can install it with the npm package manager using the following command:
npm install chart.js --save
When the module is installed, add the minified version to the bottom of your HTML page, before the closing </body> tag in the following way:
<body> <!-- HTML content --> <script src="node_modules/chart.js/dist/Chart.bundle.min.js"></script> <script src="script.js"></script> </body>
Your custom script will go into the script.js file. Alternatively, you can also add the scripts to your page using module loaders such as CommonJS or Webpack.
If you don’t want to store the Chart.js library locally, you can add it from CDN using the following code:
<body> <!-- HTML content --> <script src="https://cdnjs.cloudflare.com/ajax/libs/Chart.js/2.8.0/Chart.bundle.min.js"></script> <script src="script.js"></script> </body>
Or, you can clone the latest version of Chart.js right from the GitHub repo. However, note that the GitHub repo doesn’t come with a pre-built release version, so you need to build the library into a single file by yourself.
Set Up the HTML
With Chart.js, you can add JavaScript charts to your HTML page using the <canvas> element. In your HTML file, add the following code inside the <body> tag (above the <script> tags):
<div class="container"> <canvas id="myChart" width="600" height="400"></canvas> </div>
Chart.js will place your chart inside the <canvas> element. Although the chart will be created with JavaScript, it will appear on your page as a PNG image file.
Now, you need to add your custom configuration to the script.js file. Below, we will show you how to create two kinds of charts: a vertical bar chart and a full-circle doughnut (or pie) chart. However, you can use the same logic with any other chart types. In the Chart.js docs, you can check out all the chart types you have access to.

Create a Bar Chart with JavaScript
Our bar chart will display the life expectancy by country dataset from the World Population Review. It will show six countries with the highest life expectancy, as follows:
CountryLife expectancy (years)Hong Kong84.308Macau84.188Japan84.118Switzerland 83.706Spain 83.5Singapore83.468
We will create a vertical bar chart with interactive tooltips that will show the exact data when the user hovers the bars. However, note that it’s also possible to create a horizontal bar chart with Chart.js. On the gif demo below, you can see how our chart will look like:

Chart.js requires two variables: one that captures the HTML element (ctx in the example below) and one that holds the custom Chart object (myChart below). We need to add the names of the countries as the value of the labels property. And, we define the data (life expectancy in years) as the value of the data property of the datasets array.
The following code goes into the custom script.js file:
// Vertical bar chart var ctx = document.getElementById('myChart').getContext('2d'); var myChart = new Chart(ctx, { type: 'bar', data: { labels: ['Hong Kong', 'Macau', 'Japan', 'Switzerland', 'Spain', 'Singapore'], datasets: [{ label: 'Life expectancy', data: [84.308, 84.188, 84.118, 83.706, 83.5, 83.468], backgroundColor: [ 'rgba(216, 27, 96, 0.6)', 'rgba(3, 169, 244, 0.6)', 'rgba(255, 152, 0, 0.6)', 'rgba(29, 233, 182, 0.6)', 'rgba(156, 39, 176, 0.6)', 'rgba(84, 110, 122, 0.6)' ], borderColor: [ 'rgba(216, 27, 96, 1)', 'rgba(3, 169, 244, 1)', 'rgba(255, 152, 0, 1)', 'rgba(29, 233, 182, 1)', 'rgba(156, 39, 176, 1)', 'rgba(84, 110, 122, 1)' ], borderWidth: 1 }] }, options: { legend: { display: false }, title: { display: true, text: 'Life Expectancy by Country', position: 'top', fontSize: 16, padding: 20 }, scales: { yAxes: [{ ticks: { min: 75 } }] } } });
The documentation of Chart.js is really good, so you can find all the options we have used above (backgroundColor, borderColor, borderWidth, etc.) on the Bar page.
Create a Doughnut Chart with JavaScript
Now, let’s create a doughnut chart with the Chart.js library. It will show the distribution of the recommended daily diet according to the following StatCrunch dataset:
Dairy27.92%Fruits17.53%Lean meats14.94%Vegetables26.62%Whole grains12.99%
Here, we don’t want to show an interactive tooltip but display the data labels and values on top of the chart in the following way:

Install the Data Labels Plugin
As Chart.js doesn’t have an option for displaying labels on top of the charts, we need to use the Chart.js Data Labels plugin. Chart.js allows developers to extend the default functionality by creating plugins. Currently, there are five Chart.js plugins available on GitHub for the following functionalities:
data labels (we will use this one),
zoom,
annotation,
financial charting,
deferring initial chart updates.
The Chart.js Data Labels plugin has a pretty good documentation; you can find everything you might need. You can either install it with the npm package manager using the command below or add the latest version of the library from CDN.
npm install chartjs-plugin-datalabels --save
Add the Custom JavaScript
The JavaScript uses the same <canvas> element as before, or, if you want to keep both charts, you can add a new canvas to the HTML with a different ID:
<div class="container"> <canvas id="myChart" width="600" height="400"></canvas> </div>
In the JavaScript, we now define the chart type as doughnut. The rest of the code follows the same logic as before. We add the data as values of the labels and dataset properties of the data object.
// Doughnut chart var ctx = document.getElementById('myChart').getContext('2d'); var myChart = new Chart(ctx, { type: 'doughnut', data: { labels: ['Dairy', 'Fruits', 'Lean meats', 'Vegetables', 'Whole grains'], datasets: [{ data: [27.92, 17.53, 14.94, 26.62, 12.99], backgroundColor: ['#e91e63', '#00e676', '#ff5722', '#1e88e5', '#ffd600'], borderWidth: 0.5 , borderColor: '#ddd' }] }, options: { title: { display: true, text: 'Recommended Daily Diet', position: 'top', fontSize: 16, fontColor: '#111', padding: 20 }, legend: { display: true, position: 'bottom', labels: { boxWidth: 20, fontColor: '#111', padding: 15 } }, tooltips: { enabled: false }, plugins: { datalabels: { color: '#111', textAlign: 'center', font: { lineHeight: 1.6 }, formatter: function(value, ctx) { return ctx.chart.data.labels[ctx.dataIndex] + '\n' + value + '%'; } } } } });
As you can see above, we have added the settings of the Data Labels plugins to the options.plugin property of the doughnut chart. The formatter() method places the data labels (e.g. “Whole grains 12.99%”) on top of our chart.
Create a Pie Chart of the Same Data Set
As Chart.js is a really versatile plugin, you can easily turn the above dataset into a pie chart. Doughnut and pie charts are both for the presentation of data distribution, so they come with the same settings. The only thing you have to change in the code is the type of the chart:
// Pie chart var myChart = new Chart(ctx, { type: 'pie', /* rest of the code stays the same */ });
This is the same dataset presented as a pie chart:

You can also opt for showing only the percentages by editing the formatter() method as follows:
formatter: function(value) { return value + '%'; }

Create Other Types of Charts
With Chart.js, you can create many other chart types as well such as line, radar, polar area, bubble, scatter, area, and mixed charts. The documentation also has a Samples page where you can find live examples of all chart types.
Although you can’t directly grab the JavaScript code of the samples, you can access it using your browser’s developer tools (in most browsers you need to hit the F12 key). Note, however, that the live samples use different variables from what we have used in the article (which is recommended by the official docs), so you need to tinker a bit with the code:

Wrapping Up
Adding data visualizations to your HTML page can help users understand your content. This can be especially useful on educational websites, admin dashboards, and landing pages.
In this tutorial, we have showed you how to create different kinds of charts, namely bar, doughnut, and pie charts, using the Chart.js library. If you want to learn more about data visualization, take a look at our article about how to create a data table in Vue.js, too.
How to Create a JavaScript Chart with Chart.js published first on http://7elementswd.tumblr.com/
0 notes
Text
How to Create a JavaScript Chart with Chart.js
If you have an information-rich website or application, you might want to visualize your data so that users can better make sense of it. Although tables can be quite useful in certain cases such as pricing and feature comparison tables, other kind of information is easier to process with the help of some kind of data visualization. JavaScript libraries such as Chart.js let you generate different types of HTML5 charts such as line, bar, pie, doughnut, and area charts.
Chart.js is a versatile library that let you create JavaScript charts in a couple of minutes. It has many options with which you can configure all aspects of your charts. In this tutorial, we will look into how to set up the Chart.js library, what your options are, and what you can achieve with it. We will also create two charts: a bar chart showing life expectancy in six countries and a doughnut/pie chart showing the recommended daily diet.

Add Chart.js to Your HTML Page
You can install Chart.js in different ways. If you want to store the entire library locally, you can install it with the npm package manager using the following command:
npm install chart.js --save
When the module is installed, add the minified version to the bottom of your HTML page, before the closing </body> tag in the following way:
<body> <!-- HTML content --> <script src="node_modules/chart.js/dist/Chart.bundle.min.js"></script> <script src="script.js"></script> </body>
Your custom script will go into the script.js file. Alternatively, you can also add the scripts to your page using module loaders such as CommonJS or Webpack.
If you don’t want to store the Chart.js library locally, you can add it from CDN using the following code:
<body> <!-- HTML content --> <script src="https://cdnjs.cloudflare.com/ajax/libs/Chart.js/2.8.0/Chart.bundle.min.js"></script> <script src="script.js"></script> </body>
Or, you can clone the latest version of Chart.js right from the GitHub repo. However, note that the GitHub repo doesn’t come with a pre-built release version, so you need to build the library into a single file by yourself.
Set Up the HTML
With Chart.js, you can add JavaScript charts to your HTML page using the <canvas> element. In your HTML file, add the following code inside the <body> tag (above the <script> tags):
<div class="container"> <canvas id="myChart" width="600" height="400"></canvas> </div>
Chart.js will place your chart inside the <canvas> element. Although the chart will be created with JavaScript, it will appear on your page as a PNG image file.
Now, you need to add your custom configuration to the script.js file. Below, we will show you how to create two kinds of charts: a vertical bar chart and a full-circle doughnut (or pie) chart. However, you can use the same logic with any other chart types. In the Chart.js docs, you can check out all the chart types you have access to.

Create a Bar Chart with JavaScript
Our bar chart will display the life expectancy by country dataset from the World Population Review. It will show six countries with the highest life expectancy, as follows:
CountryLife expectancy (years)Hong Kong84.308Macau84.188Japan84.118Switzerland 83.706Spain 83.5Singapore83.468
We will create a vertical bar chart with interactive tooltips that will show the exact data when the user hovers the bars. However, note that it’s also possible to create a horizontal bar chart with Chart.js. On the gif demo below, you can see how our chart will look like:

Chart.js requires two variables: one that captures the HTML element (ctx in the example below) and one that holds the custom Chart object (myChart below). We need to add the names of the countries as the value of the labels property. And, we define the data (life expectancy in years) as the value of the data property of the datasets array.
The following code goes into the custom script.js file:
// Vertical bar chart var ctx = document.getElementById('myChart').getContext('2d'); var myChart = new Chart(ctx, { type: 'bar', data: { labels: ['Hong Kong', 'Macau', 'Japan', 'Switzerland', 'Spain', 'Singapore'], datasets: [{ label: 'Life expectancy', data: [84.308, 84.188, 84.118, 83.706, 83.5, 83.468], backgroundColor: [ 'rgba(216, 27, 96, 0.6)', 'rgba(3, 169, 244, 0.6)', 'rgba(255, 152, 0, 0.6)', 'rgba(29, 233, 182, 0.6)', 'rgba(156, 39, 176, 0.6)', 'rgba(84, 110, 122, 0.6)' ], borderColor: [ 'rgba(216, 27, 96, 1)', 'rgba(3, 169, 244, 1)', 'rgba(255, 152, 0, 1)', 'rgba(29, 233, 182, 1)', 'rgba(156, 39, 176, 1)', 'rgba(84, 110, 122, 1)' ], borderWidth: 1 }] }, options: { legend: { display: false }, title: { display: true, text: 'Life Expectancy by Country', position: 'top', fontSize: 16, padding: 20 }, scales: { yAxes: [{ ticks: { min: 75 } }] } } });
The documentation of Chart.js is really good, so you can find all the options we have used above (backgroundColor, borderColor, borderWidth, etc.) on the Bar page.
Create a Doughnut Chart with JavaScript
Now, let’s create a doughnut chart with the Chart.js library. It will show the distribution of the recommended daily diet according to the following StatCrunch dataset:
Dairy27.92%Fruits17.53%Lean meats14.94%Vegetables26.62%Whole grains12.99%
Here, we don’t want to show an interactive tooltip but display the data labels and values on top of the chart in the following way:

Install the Data Labels Plugin
As Chart.js doesn’t have an option for displaying labels on top of the charts, we need to use the Chart.js Data Labels plugin. Chart.js allows developers to extend the default functionality by creating plugins. Currently, there are five Chart.js plugins available on GitHub for the following functionalities:
data labels (we will use this one),
zoom,
annotation,
financial charting,
deferring initial chart updates.
The Chart.js Data Labels plugin has a pretty good documentation; you can find everything you might need. You can either install it with the npm package manager using the command below or add the latest version of the library from CDN.
npm install chartjs-plugin-datalabels --save
Add the Custom JavaScript
The JavaScript uses the same <canvas> element as before, or, if you want to keep both charts, you can add a new canvas to the HTML with a different ID:
<div class="container"> <canvas id="myChart" width="600" height="400"></canvas> </div>
In the JavaScript, we now define the chart type as doughnut. The rest of the code follows the same logic as before. We add the data as values of the labels and dataset properties of the data object.
// Doughnut chart var ctx = document.getElementById('myChart').getContext('2d'); var myChart = new Chart(ctx, { type: 'doughnut', data: { labels: ['Dairy', 'Fruits', 'Lean meats', 'Vegetables', 'Whole grains'], datasets: [{ data: [27.92, 17.53, 14.94, 26.62, 12.99], backgroundColor: ['#e91e63', '#00e676', '#ff5722', '#1e88e5', '#ffd600'], borderWidth: 0.5 , borderColor: '#ddd' }] }, options: { title: { display: true, text: 'Recommended Daily Diet', position: 'top', fontSize: 16, fontColor: '#111', padding: 20 }, legend: { display: true, position: 'bottom', labels: { boxWidth: 20, fontColor: '#111', padding: 15 } }, tooltips: { enabled: false }, plugins: { datalabels: { color: '#111', textAlign: 'center', font: { lineHeight: 1.6 }, formatter: function(value, ctx) { return ctx.chart.data.labels[ctx.dataIndex] + '\n' + value + '%'; } } } } });
As you can see above, we have added the settings of the Data Labels plugins to the options.plugin property of the doughnut chart. The formatter() method places the data labels (e.g. “Whole grains 12.99%”) on top of our chart.
Create a Pie Chart of the Same Data Set
As Chart.js is a really versatile plugin, you can easily turn the above dataset into a pie chart. Doughnut and pie charts are both for the presentation of data distribution, so they come with the same settings. The only thing you have to change in the code is the type of the chart:
// Pie chart var myChart = new Chart(ctx, { type: 'pie', /* rest of the code stays the same */ });
This is the same dataset presented as a pie chart:

You can also opt for showing only the percentages by editing the formatter() method as follows:
formatter: function(value) { return value + '%'; }

Create Other Types of Charts
With Chart.js, you can create many other chart types as well such as line, radar, polar area, bubble, scatter, area, and mixed charts. The documentation also has a Samples page where you can find live examples of all chart types.
Although you can’t directly grab the JavaScript code of the samples, you can access it using your browser’s developer tools (in most browsers you need to hit the F12 key). Note, however, that the live samples use different variables from what we have used in the article (which is recommended by the official docs), so you need to tinker a bit with the code:

Wrapping Up
Adding data visualizations to your HTML page can help users understand your content. This can be especially useful on educational websites, admin dashboards, and landing pages.
In this tutorial, we have showed you how to create different kinds of charts, namely bar, doughnut, and pie charts, using the Chart.js library. If you want to learn more about data visualization, take a look at our article about how to create a data table in Vue.js, too.
How to Create a JavaScript Chart with Chart.js published first on https://deskbysnafu.tumblr.com/
0 notes