#graphing exponential functions
Explore tagged Tumblr posts
Visit Tumblr Blog
Explore Tumblr blogs with no restrictions, modern design and the best experience.
Last Seen Tumblr Blogs


Fun Fact
In February 2021, Tumblr had 518.6 million blog accounts.
Text
<— Unit 23 — Unit 24: G & D — Unit 25 —>
Unit 24: Growth & Decay
Part 1 —>
Review: Basic exponential
Basics

b^+ functions

Key point: (0,1)
Common pivot point
Important to know when shifting
.
Discrete Compound Interest


Related terms:
Quarterly = compounded 4 times per year
Semiannually = compounded 2 times year
Biannually = compounded 2 times per year
Continuous Growth
Compound Continuous interest

Page 63
#aapc1u24#exponential growth#exponential decay#exponential function#exponential functions#graphing exponential functions#discrete compound interest#compound interest#continuous compound interest#continuous growth
2 notes
·
View notes
Text
Domain and Range

Application Problem

Solve for Equation

S4 Eq 2

Decay and Growth

2 notes
·
View notes
Text
my brother, making fun of me complaining about graphs: haha graphs are easy its just lines
me, ready and prepared to make him attempt an exponential function: ok bet
#he failed#i hate exponential functions#i wish i could go back to equations those are fun#i am a graph hater
0 notes
Text
Voltron characters as algebraic expressions/distributions:
PIDGE: the binomial distribution
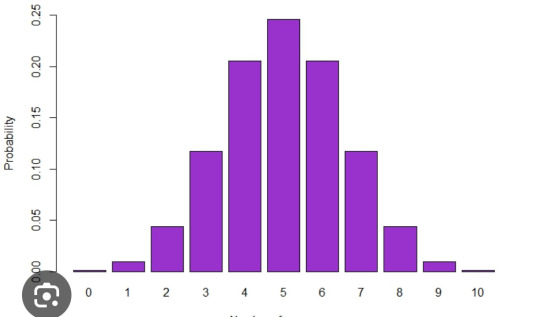
Binomial distributions display probabilities for a set number of binary trials (only two choices) within an experiment. I feel like this represents her because of her experimental nature as well as the two choices she was faced with in s1: saving the universe or leaving to save matt and her dad.
LANCE: sine function
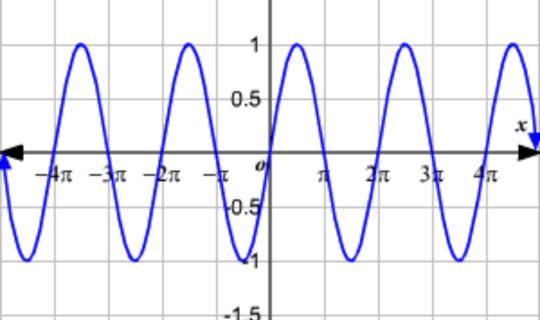
IT'S ALL ABOUT THE WAVES!! Bro is smooth and bro swings both ways. Also, a sine wave is a periodic function, meaning it repeats the same pattern again and again. This can represent how while Lance is moving forward, he feels like is isn't growing or isn't more, but is rather stuck, bouncing between highs and lows.
KEITH: cosecant function
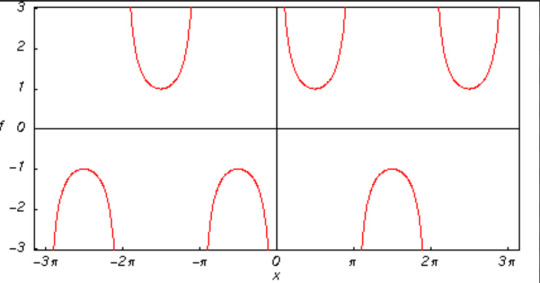
cosecant functions are the reciprocals of sin function (csc=1/sin), so this shows how Keith "reflects" or mirrors Lance. Additionally, the periods of csc functions start at positive or negative infinity and then stray towards the origin, but never quite reach it. This represents how Keith is so far away, and how everytime he comes back he leaves again, and how "home" always feels out of reach for him (csc function approaches horizontal asymptote but never truly gets there)
ALLURA: exponential function
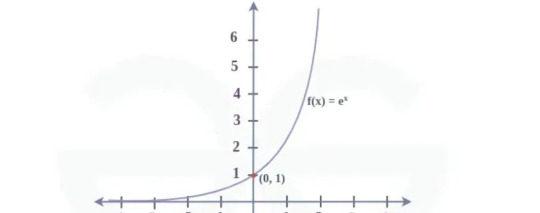
The exponential function starts at an infintessimally small value that is nearly zero, and then rises drastically. The "flatter" values of the graph represent her comatose, and the sudden increase of values reflect her increased power, fight, and drive. It continues to increase forever, which I think can represent her death in canon. She transcends a barrier that the others cannot reach.
CORAN: uniform distribution
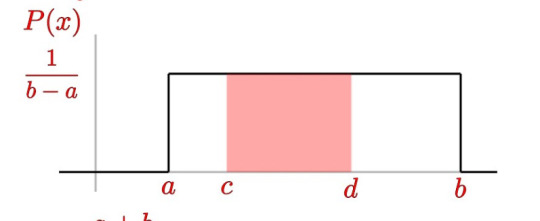
MY BOY Coran is the most unwavering support ever. The key aspect of a uniform distribution is that it is always the same value wherever it exists. It doesn't change or shift, just like how Coran has always, ALWAYS been able to constantly be there for the team and the universe.
HUNK: step function
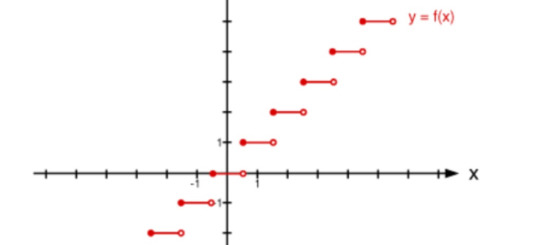
While canon does him dirty, Hunk rises in both confidence and skill throughout the show. He's very methodic and is also a backbone to the team, which is why I gave him a function that's broken so evenly and is still rising. He is the type of character who climbs up. Also, I first used step functions in an engineering class!
SHIRO: hyperbolic function
OMG YALL ALR KNOW!! Not all hyperbolic functions map this way fyi, but THESE particular ones are sooooo Shiro. There is two parts of the graph, one positive and one negative. They never touch but they mirror each other identically and they're mapped by the same function. This represents Kuron and Shiro. They're both made from the same DNA, appear identical, but they have different minds and goals (the same way both parts of this function approach different values as x approaches infinity!)
#voltron#voltron brainrot#guys what am I doing#vld#voltron legendary defenders#pidge holt#pidge#pidge gunderson#Lance mcclain#keith kogane#klance#allura#coran#hunk garrett#takashi shirogane#vld headcanons#voltron headcanons#asterikamay#voltron as math functions#incase anyone is fucking looking that up lmao#math functions#probability distributions#so sorry to whoever is looking through math tags for studying or smth and they see VOLTRON#although...why are you studying from tumblr help
104 notes
·
View notes
Text
The McLaren drivers dilemma
Alright, I wanted to explore the comparison between Lando and Oscar in term of where each of them is in their career to understand better how McLaren should manage them this year. This is gonna be a long post because I love deep dives so buckle up, and if you do wanna go through it I’d love to read your opinion on this matter.
So, let’s start this off by a simple graph representing someone’s hypothetical development in function of the time they’ve spent practising a certain activity. This relation works because the more time you spend working on something, the more time you have to develop it. Here is our control line :

This will be our control, the starting point is (0;0), since if you spent no time on something you don’t develop it at all, and our finish point is an imaginary limit, because you time is limited wether it is through death or in case of formula 1 racing retirement. Thus, your development will also reach an end-point.
Now when we look at Lando and Oscar, an important factor is that they don’t have the same amount of time spent in formula 1. Oscar is ˜2 years along and Lando is ˜6 years along. We can represent it on our graph like this :

If we were to consider development through time as a linear function, the comparison would end here and there wouldn’t be much of interest to it. However, the function ISN’T linear. When you start practising an activity you tend to learn more then because there are low-hanging fruits in comparison to when you have been practising for a long time, because you’ve already discovered the easy improvements and the next ones are more difficult to identify and could imply that you need to modify what you’ve already trained yourself to do. The function would probably be more of an exponential one like that:

You improve really fast at the start and then start trending towards a plateau, which represents the most that you can achieve before your time of development is up. Another important factor to note is that not everybody develops at the same rate, some will learn faster and some slower. Let’s consider the red curve our standard function, and the one which Lando has been following through his career to make the comparison easier. Here are 3 scenarios that could represent the situation when both drivers reach towards the same end point but with different development rates :


Depending on Oscar’s rate of development, we can observe that his gap to Lando varies from barely anything to quite noticeable. But no matter how fast he develops, in this situation Lando will always be further ahead and thus closer to the end-point. Where the comparison gets interesting is when we recognize that not everyone has the same end-point.
Despite all development being limited by a certain time-frame, the maximum development is naturally higher or lower from one person to another. Maybe one has sharper reflexes or a metabolism that produces important hormones when it comes to their focus more efficiently, the point is that naturally some will have advantages and disadvantages in comparison to others which cannot be diminished through practice of the activity.


And now the question is where do McLaren situate Oscar in comparison to Lando when it comes to his end-point. Because at this point in time it is pretty clear that Lando still has the edge, he usually pulls a tenth-ish over Oscar in qualifying and despite being beaten from time to time, he still generally has the better tire management. But does McLaren think Oscar has the yellow or purple curve of development?
The question is complicated, because you need to identify what is an upward trajectory and what is probably a plateau. When it comes to Lando, his weakness at race starts has been pretty consistent throughout his formula 1 career, and even in the junior series. Over such a long stretch of time, it can be assumed that he has reached a sort of plateau in that regard. This is not a dig at him or anything, just a fact. When you haven’t improved in a decade of practising, it probably indicates that you’ve trained yourself to do something a certain way and are incapable of teaching yourself to do it differently, or that you simply only have incremental gains left.
On the other hand, an upward trend can be observed when we look at Oscar’s tire management. At the start of the year, such as in Australia, Japan and China, the weakness was very obvious especially when in similar conditions to Lando. But the improvement has been noticeable, Spa especially has been clear since both were on two-stoppers and in dirty air, but he’s also been solid in Monza, Hungary and Silverstone. Looking at the tracks he has improved the most on the ones on which he has raced in junior categories, and lacks the most on the ones he hasn’t. Thus we can assume that the more experience he gains on tracks he is relatively unfamiliar with, the more his tire management will improve there.
McLaren’s problem is that at this moment in time, they need to create a hierarchy between their drivers to give them the best chance to clinch a driver’s championship. However, the situation is different from the Max/Checo one, because when Checo came in both were experienced drivers with a few years under their belt, the potential gains to be made were marginal and thus it was easier to determine a first and second driver assuming they were reaching their plateau.
For McLaren, Lando is a relatively experienced driver with a few year under his belt, so a known quantity with an approximate development curve established. But Oscar is a developing driver, we haven’t seen enough of him yet to determine what his development curve should look like. You can’t assume someone’s development rate when they haven’t raced more than once or twice on a given circuit in their career, I’d say once you have 5 data sets it is reasonable to establish what the curve looks like (because you can’t make a curve with two dots, it could be as much of a linear function as an exponential one).
The issue is that they don’t know what to think of Oscar yet. To name him as second driver would be clipping his wings, and you don’t want that. You want your developing drivers to learn and explore, to discover those low-hanging fruits and to improve as fast as they can. By pushing a role onto them you risk stopping this development to the limits you impose. However, right now Lando is in a potential championship fight, and he’d need a second driver to support him throughout the next few gps in order to maximize his chances of winning.
The question is, do they bet on Lando’s chances as of now at the extent of limiting Oscar’s growth, or do they gamble on Oscar’s potential at the extent of reducing Lando’s chances? How long do they want to keep them on the team, would it be better long-term to let Oscar develop into a complete racing driver but to sacrifice some of Lando’s faith in the team, or to alienate Oscar so soon in his career to guarantee Lando’s loyalty? Are they supposed to be teammates for the next decade, or only for the next year? How would forcing Oscar into a second driver role affect his relation to Lando and how the team views him, would they start naturally giving Lando the better strategies at the expense of expressing his full talent? Would keeping them on an equal standing annoy Lando and sour his relation with the team, would he get impatient and jump ship in order to get the first driver status he would deserve if both him and Oscar were at the same point on the time axis? Do they believe they’ll still be competitive in the next few years and thus can afford to sacrifice the 2024 Lando driver’s championship shout, or is this a once in a lifetime opportunity and it is worth confining Oscar to a limiting role in order to get Lando’s championship?
So many factors, so many variables, the McLaren lineup is certainly an interesting pair. It must be headache-inducing to decide how to deal with them, because of these different points in their career they both are at. The dilemma of whether a hierarchy should be established between the drivers is a complex thing, but I’ll still offer my conclusion here.
I’d say considering the drivers are signed until 2026 a minima each, and that they both have similar preferences when it comes to the direction of development of the car (we’ve seen with Lando and Daniel for example, who both have very different preferences, that having to compromise will always leave a driver performing worse than what he is capable of), that it is in McLaren’s best interest to maintain this lineup.
The best course of action in my opinion would be to not establish a first and second driver, because Oscar does noticeably better on tracks he is familiar with. Tracks he is not familiar with are coming up, so that means he should naturally be lacking a bit more there than Lando. Thus, he should naturally fall into a role of rear gunner, without McLaren having to confirm he is their second driver. This way, Oscar doesn’t feel alienated and limited to a second driver role pushed onto him, and Lando still gets the best chance for the driver’s championship. The only downside would be that McLaren don’t acknowledge publicly that Lando is the number one driver, and thus Lando could feel annoyed to publicly be put on the same footing as his less experienced teammate when he has more of a chance at a championship. However, if the team intends on keeping this lineup long term, this feels like the best solution in my mind, as long as the assumption that Oscar will perform at a lower level in unfamiliar tracks is correct.
That’s my piece on the matter, feel free to tell me if you don’t agree with anything I said because I’d love to see different perspectives which are not straight bashing of drivers because GOD I’m tired of seeing underdeveloped takes on the situation at McLaren.
49 notes
·
View notes
Text
Calculating the theoretical downfall of my shrambling empire
We can do this using a little algebra! :3
First to get the equation for the balance of our shrambing empire balance, this is just a compound interest problem since each bet is 3% of our current balance! We started the season with $1000, but we've since had some wins and losses affect our balance since them, we'll just start with our balance before the first loss of this streak as our principal amount: $955.86 on 2025 Jan 14! (Georgiev's 2nd win as a Shark and the 3rd (and final) game in the Pickles win streak!) (also keeping in mind i forgot to bet on that Boston game ;-; but maybe for the better because they lost that one too lol)
We can pop this into the compound interest formula and get the equation "y = 955.85 * 0.97^x", where "y" = the balance after "x" games played. But for anyone following along who happens to not know this formula we can easily derive it like so:
Let y0 represent the initial balance before any given game and let y1 represent the balance after any given game
y1 is equal to y0, minus the amount of our shrambling bet
The amount of our shrambling bet is 3% of our y0, or "0.03 * y0"
Therefore "y1 = y0 - (0.03 * y0)"
We can rewrite this using the distributive and identity properties as "y1 = (1 * y0) - (0.03 * y0)" -> "y1 = (1 - 0.03) * y0"
Simplify to "y1 = 0.97 * y0" -> here is our recursive function! :D we can use this to get the balance before or after a bet, given we are always betting the max on the sharks and know either the amount before or after!
Since each consecutive balance is the previous one multiplied by 0.97, we can get any balance by multiplying the initial balance (our $955.85) by 0.97, one time per each game played (assuming the loss streak continues) since then!
We can write this rule as a function to make an explicit function for our account balance after any # of games: "y = 955.85 * 0.97^x". ta-daaaa :3 all done!
Here's our function graphed on Desmos, plus a table of some key points on the graph! + a bonus graph of our permitted bet amount (3% of our account balance!)

This model will predict our balance values a little low btw, because our max possible bet has to be rounded down to the nearest cent on NHL66. But I think that the rounding error is negligible for our purposes here
As can be seen in the notes of this post, the people clamor for the downfall of my shrambling empire.... so let's see exactly when we would hit these milestones, assuming the Sharks loss streak continues! :D
Scenario #1: net loss of $500 via @puckpocketed
We can just calculate this from our "y = 955.85 * 0.97^x" equation! Substitute the $500 balance into y, then solve for x games played by dividing the $500 balance by 955.85, then taking the log base 0.97 of 500 divided by 955.85....or convert to log base 10's if your calculator doesn't just have a log base 0.97 function lying around lol
Anyways! Our solution (to the thousandth) is 21.274 losses, and obviously we can't have fractions of games played in terms of bets which are discrete/only counted per whole game played. Thus, we can see on our table that we will have lost $500 (in fact, $510.93!) after 22 games lost in a row! This is possible, as we have bet on 4 losses already, so we need to lose only 18 more bets in a row! :) There are currently 31 games left in the season! :)
Scenario #2: negative balance via @proceedwcandy
Due to the 3% cap on our bets, as our balance gets smaller, so too will our bets.... we will cannot enter shrebt (sharks debt) by this model :(. (We can verify this by attempting to take the x-axis intercept, where y = 0 or any negative value, the same way we did for scenario #1 and we will get an undefined value. Plus we can see from the graph that even if we kept zooming out it would never go to a negative value.... Sad! Such is the nature of an exponential function with no vertical shift down.... u_u)
However! There is a stipulation in NHL66 rules where once the maximum bet amount reaches $2, it will stay there. We can find the balance at which we reach this minimum cap—$2 is 3% of $66.666... going on forever, but we'll round up to the nearest cent at $66.67. We would reach this amount after 87.423 losses, and again we must round up, so after betting on 88 losses in a row (or 84 losses from now) our max bet from then on will be $2!
After that the scenario is represented by a linear function, "y = -2x + 65.51" (65.51 is our balance after this, rounded up to the nearest cent), so we can find the point at which we would go into shrebt! If we have y = $0 and solve for x, we get 32.755 more losses (on top of the 88 losses to get to this threshold) to get to $0, or 33 more losses to get a negative balance! (not that NHL66 will actually let me do this, they'd just cap that last bet at however much I have left :P but we'll ignore that for this hypothetical)
Tl;dr: It would take 121 losses in a row (or 117 more losses) to get a negative balance! We. um. Well, we do not have that many games left in the season to lose! ^_^" but, well.... who am i to doubt the prowess of the psiionic warriors manifesting my downfall...... ">_>
13 notes
·
View notes
Text
Effortpost registry
Kernels and Injectivity; 19 jun 2025
The Topology Game; 2 apr 2025
Graphs as presheaves 4: coverages; 13 feb 2025
The general linear group as a Hopf algebra; 31 oct 2024
Zariski topologies; 14 oct 2024
On integer multiplication and endomorphism algebras; 2 sep 2024
Recommendations for learning category theory; 28 mar 2024
The hairy ball theorem and stably free modules; 11 feb 2024
Topological connectedness and generalized paths; 24 nov 2023
Graphs as presheaves 3: subobject classifiers; 19 oct 2023
Effortpost registry; 18 oct 2023
Graphs as presheaves 2: limits and colimits; 11 oct 2023
Hydrogen bomb vs. coughing baby: graphs and the Yoneda embedding; 7 oct 2023
Extending the D ⊣ U ⊣ I adjunction sequence; 23 sep 2023
The Riemann rearrangement theorem and net convergence; 18 sep 2023
Thoughts on the axiom of choice; 18 feb 2023
Topological spaces and simple graphs as neighbourhood spaces; 15 feb 2023
What is a space?; 10 jan 2023
The exponential function applied to sets; 24 dec 2022
On nilpotent eigenvalues; 23 dec 2022
But IS the empty space connected?; 11 nov 2022
Monads monads monads; 8 nov 2022
Calculating what the triangle identities mean for a bunch of adjunctions and being amazed when it works every time; 7 nov 2022
Defining the Lebesgue integral as a net limit; 27 jul 2022
Rambles about describable sets; 28 oct 2021
Functions with cycling derivatives; 30 aug 2021
Why the rationals have zero length; 31 may 2021
An infinite cardinal valued random variable; 30 may 2021
A field-based functor; 20 mar 2021
Generalized sides; 13 mar 2021
Rambles about metric convexity; 22 feb 2021
Wiggle function convergence; 28 jan 2021
Rambles about infinity; 5 sep 2020
Generalized golf; 24 jun 2020
Rambles about continuousifying series; 10 may 2020
Rambles about being closed under exponentiation; 7 may 2020
Rambles about the groups that come with fields; 3 may 2020
A compilation of donutified functions; 17 mar 2020
Rambles about arithmetic functions; 24 jan 2020
Graphing real functions on a torus >:); 29 nov 2019
78 notes
·
View notes
Text

Tuesday, January 28, 2025
I hope everyone is having a wonderful week! I may or may not be able to post tomorrow, so if not, I will do my best to post again on Thursday. 🦄
Tasks Completed:
Algebra 2 - Reviewed graphing exponential functions + read about logarithmic functions + read about natural logarithmic functions + practice
American Literature - Copied vocabulary terms + read chapter 10 of To Kill a Mockingbird by Harper Lee + answered discussion questions + worked on my sentence outline
Spanish 3 - Reviewed vocabulary
Bible 2 - Read Nehemiah 9
Early American History - Read about the development of transportation + answered critical thinking questions + read Chapter 14 of Oregon Trail: Sketches of Prairie and Rocky-Mountain Life by Francis Parkman
Earth Science with Lab - Read about Galileo from two different perspectives
Art Appreciation - Completed daily critiquing assignment on The Crucifixion by Matthias Grünewald
Khan Academy - Completed Algebra 2 Unit 8 Test + completed U.S. History Unit 4: Lesson 1.11
Duolingo - Studied for approximately 15 minutes (Spanish + French + Chinese) + completed daily quests
Piano - Piano lesson + practiced for two hours
Reading - Read pages 177-212 of This Dark Descent by Kalyn Josephson
Chores - Laundry + took trash and recycling out
Activities of the Day:
Personal Bible Study (Psalm 127)
Group Bible Study + Devotional (Genesis 46-47)
Ballet
Pointe
Journal/Mindfulness
#study blog#study inspiration#study motivation#studyblr#studyblr community#study community#study-with-aura
8 notes
·
View notes
Text
<— Unit 24: Part 2 —>
Exponential Function
Shifts


Reflection


Page 64
#aapc1u24#exponential functions#exponential function#shifts#graphing#graphing exponential functions#graphing exponential function#translations#stretch & compress
0 notes
Text
LOG TIME
Here’s some attempts I made to reteach myself how to graph logs and finding equations.
Graph—> equation

The idea was using the nearest whole number to the asymptote as the “key point” and then graphing from there.
If you’re a visual person when it comes to graphs, I’m sure it works great.
For me, I cannot for the life of me feel at ease around a graph. Something about visualizing it extremely hard and I usually prefer moving it via algebra — but only for logs lol.
. . . . . . . .
Equation —> graph
#1

This was my next idea. Idk why I thought less words would help. It made it harder to remember things since I wanted to make things simple in preparation for reflections (my mortal enemy).
. . . . .
#2

I’m using my old method! Logs are like magical unicorns and while I do understand when I concentrate how they work most of the time they’re unicorns. So I use exponential functions to figure out inputs and outputs since you just swap x & y and then you got a log to graph.
Thing is while I got a good method down I still couldn’t figure out how to put reflections in.
. . . .
#4 — Finalized method
Presenting: my method~
YAY! I CAN GRAPH LOGS AGAIN.

Interpreting graphs is so much easier folks. I get why my some profs just skip complicated reflections, so easy to forget or fuck it up if you don’t have a solid method.
. . .
Also this took me a solid 2 hours to figure out. I forgot about writing my story, reading, EVERYTHING. I was a math solving fanatic. I had a hunger, and it was for logs.
A hunger that would NOT be satiated until I could break a log and put it back together.
Omfg my brain is so fried 🥱😴
The hard part about logs is that my old method I use to crack the puzzle of most functions doesn’t work as well. Part of why linear, rational, exponential, and power functions are easier for me is because I can remember a few coordinate points or its easy af to figure out the math.
If I want to plot the points for a log graph, I got to use the change of base formula since my calculator only does logs with a base of ten TvT
My graphing calculator’s stuck in Test mode for the last 10 years. Never gave a shit to figure out how to get it out
Now that I got a new method, it’ll be interesting learning other methods so I can help tutor the kiddos. Cuz like I can try to do the more common method but I’ll have to pre-prep the problems or make sure to solve the base log with a change of base for the y-coordinate or I’m soooooo gonna fuck up. Lol.
I honestly do love math but math fuge is like my writing fuge.
So fun but exhausting af.
.
TIME TO FUCK UP THE REST OF PRECALC!!!
FUCK YEAAAAAAH!
6 notes
·
View notes
Quote
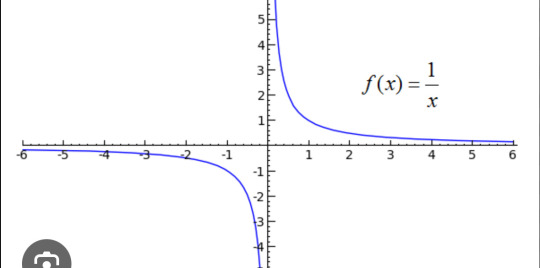
Exponential growth is radically counterintuitive. How much money do you think you’ll have after 30 years if you put $1 into an account that doubles in value every year? The answer: $1 billion. Thirty years after that, you’ll need exponents to render how much money you have. Think of exponential growth as a mathematical singularity, a value that approaches, but never quite reaches, infinity. In the function y=1/x, for example, as the value of x gets closer and closer to zero, the value of y explodes. You can plot y on a graph and watch it begin as a slowly rising horizontal line that accelerates upward before becoming a nearly vertical wall.
Something Like Fire
5 notes
·
View notes
Text
Threading the Needle

Less than a single day after launch over 30 million people have joined Threads, Instagram's version of Twitter. The app is very much a minimum-viable-product copycat of Elon Musk's bird site, but their version of an MVP is still significantly more feature-rich and ready for prime-time than most other recent challengers to the throne.
The big advantage here is the use of Instagram's social graph to boost Threads signups on day one. The onboarding flow is as easy as "tap on your Instagram profile, tap on a second button to follow everyone you already follow over there, and you're done" which takes about fifteen seconds and is a significantly simpler experience than Bluesky which requires a highly coveted invite code or Mastodon which requires a whole separate blog post to explain. I think most users will discover pretty quickly that the people you followed for their photos or life updates are absolutely not the same people you want short-form text updates from... but how much does that really matter to Mark Zuckerberg who gets to boast Threads is well on its way to being the fastest growing social app of all time? Whatever gets you on board, baybee!
The app's single home feed is currently algorithm-heavy, mixing very few posts from people you follow in with a majority of posts from random users, celebrities, and brands platform-wide. The ratio is clearly way off here, and users have been loudly clamoring for a change. Adam Mosseri, Instagram and Threads' lead within Meta, has already publicly stated a feed of people you follow is incoming. Beyond that there are a lot of basic social networking features that are surprisingly absent from Threads at launch: Hashtags, usable search, post editing, post translation, alt-text on images — the group of features Mosseri has described as "on the list" feels exponentially huge. You have to wonder what the priorities will be and how long it will take to see some of these features come to the platform. Threads has a huge advantage out of the gate by tapping into Instagram's userbase of over two billion people, but retaining those users by listening to community feedback is going to be as challenging as building the app in the first place.
So it's worth keeping in mind Instagram's track record here. It's 2023 and Instagram still doesn't have an iPad app because it's "just not a big enough group of people to be a priority." Meta, one of the largest tech companies in the world, can't allocate any of their resources towards creating a high quality tablet experience for their app built around sharing and viewing photo and video? It's nonsensical! If the entire iPad userbase doesn't represent "a big enough group" to make a dedicated experience worthwhile, what does that say about accessibility features or other niche-but-important requests?
Assuming the state of Threads as it stands today will remain the same for an extended period of time, I see the app taking on a different life from just being "new Twitter." At launch, Twitter featured a reverse-chronological feed with no algorithmic intrusion, making it a great news delivery mechanism if you followed the right people. Those first few months and years of the service established the norms and future of how Twitter and the social web at large evolved. Third-party apps like Tweetie invented the pull-to-refresh interaction we see in every app on every device today. Users of Twitter began implementing hashtags as a way to more easily find like-minded community members via search, a feature which eventually became core functionality for the experience. But it all started with the launch product and timely updates from friends and proto-influencers. Twitter as a product has never really strayed too far from everyone's initial impression (despite Elon's best efforts).
By comparison, Threads is establishing its own norms in lieu of the aforementioned missing features. Brands are scrambling to figure out the right post-cadence and tone. Is posting breaking news moot in the face of an algorithmic feed? If your Threads and Instagram followers are the same, will posting images to a text-based platform feel redundant? These are questions which will be answered without intervention from Mosseri and team, and instead be dictated by the early adopters and community members who find hacky ways to actualize new methods of interaction with the toolset that is currently available in 1.0.
Am I excited that Mark Zuckerberg's Twitter has the best shot at being "the next big thing" given the many viable alternatives? Absolutely not! But there's no denying that Threads will be a hit despite Meta's track record for lying, stealing, and knowingly upending society. In the face of this, the internet-obsessed kid inside of me who loved to text 40404 to tweet in 2007 is excited to witness the birth and evolution of something that is accidentally unique because of what's missing instead of mind-numbingly samey because of what's already there.
I'm brendonbigley on Threads.
Catch you later!
18 notes
·
View notes
Note
i see math major 👀 i have to take brief calculus in the fall after not taking a single math class in 5 years… any tips to not overwhelm myself??
hi! okay sorry for the late response, I was gearing up to respond throughout the week and drafting good advice. disclaimer: I wrote A LOT. I promise it's not very scary and if it feels overwhelming, please digest it in bits. I just yap a lot and I wanted to cover all my bases.
Five years is a long time without math and enough time to forget lots of things! It's good that you're getting a good head start so there's no need for you to worry.
I'd start by practicing basic algebra: systems of equations, algebraic expressions (solving for x and stuff), linear/quadratic/exponential equations, etc. I will say, even if you once knew how to do this and used to be very good at it, there is a chance that you forgot a lot and lost your touch. Do not be deterred by that. It is OKAY. I've taken many levels of calculus, didn't take any math for a year, and then completely forgot how to factor an equation. It just happens- math is something you have to work your way back into by making a habit of it.
Then you should review trigonometry, more advanced algebra topics, etc: this is algebra II/pre-calculus. In my opinion, it's just a more extended version of basic algebra. You can review matrices too (part of alg II), but it's not very relevant to calculus unless you're taking differential equations (calc 4). But definitely, DEFINITELY, review trigonometry (sin/cos/tan, triangles, rules for their equations, the UNIT CIRCLE).
I'd say that's a good summary of things to catch up on. Once again, it is okay if you mess up some ridiculously "easy" review problems. It's seriously so, so normal, and it doesn't mean that you're set back too far or have an arduous journey ahead of you. The more you get used to doing math, the more you'll get better at it!
Here's a quick overview of topics taught in calculus I: limits, derivatives, applications of derivatives, integrals, applications of integrals.
If you have time, you could totally look into the topics that'll be taught during your semester too. You're already getting a head start by looking into reviewing things, but this would push you even forward.
Here are links to some free resources for you to use for ANY topic you choose to review (you might know some of them):
Khan Academy: has lots of videos and tutorials. Breaks topics down really well. Has review problems with answers and breakdowns of solutions. The review problems are generally basic compared to in-class test questions, but it's good for building a foundation
Organic Chemistry Tutor: This guy is the goat. His youtube videos are really thorough and he's good at explaining things and he'll walk you through different problems.
symbolab: this is an online calculator that can solve lots of different types of equations, including calculus equations! You can input the most tough, weirdest looking equations with ten variables, and as long a it's solvable it'll give you an answer
desmos: online graphing calculator! It's amazing for visualizing equations and functions.
If you have access to whatever textbook your teacher might use in the fall too, that's also great! Also, feel free to reach out to ME for any math help. I am the biggest math nerd ever so I would probably get excited to help you AHAH. I've done one of my mutuals physics homework before so I promise you wouldn't be overstepping if you asked me for anything else. Good luck on your studies!
#math#asterikamaymath#guys i love math#my friend told me i should add klance to the tags#thats evil tho I wont do that ik yal mfs dont wanna see math on your fyp#one of my fav asks honestly ahhhhhh#lowkey im cooked for my own math midterms though AHAH
6 notes
·
View notes
Text
Data-Driven Excellence: Excel Training for Smarter Business Decisions
In today's fast-paced business environment, making informed decisions is crucial for success. With the exponential growth of data, organizations are increasingly turning to tools like Microsoft Excel to transform raw data into actionable insights. Let’s discover the role of Excel in supporting data-driven decision-making and how professionals can leverage its powerful features to analyze data effectively and inform strategic choices.
The Importance of Data-Driven Decision-Making:
Gone are the days when decisions were solely based on intuition or past experiences. In the era of big data, organizations must harness the power of information to gain a competitive edge. Data-driven decision-making involves using data analysis to guide business strategies and actions. This approach empowers businesses to identify trends, mitigate risks, and uncover opportunities that might otherwise go unnoticed.
Excel as a Data Analysis Powerhouse
Microsoft Excel, a ubiquitous spreadsheet software, has evolved beyond a simple tool for number crunching. It is now a robust platform for data analysis and visualization. Professionals who have Excel training in Perth can sift through large datasets, perform complex calculations, and create compelling visualizations, all within a familiar and user-friendly interface.
Key Excel Features for Data Analysis
PivotTables:
PivotTables allow users to summarize and analyze large datasets quickly. Professionals can rearrange and manipulate data to extract valuable insights, helping them make more informed decisions.
Formulas and Functions:
Excel offers a wide array of formulas and functions that enable users to perform advanced calculations. From basic arithmetic to complex statistical analysis, Excel's formula library is a treasure trove for data analysts.
Data Visualization with Charts:
Visualizing data is crucial for understanding trends and patterns. Excel provides a variety of chart types, such as bar charts, line graphs, and pie charts, making it easy for professionals to communicate their findings effectively.
Data Cleaning and Transformation:
Before analysis, data often requires cleaning and transformation. Excel provides tools for sorting, filtering, and transforming data, ensuring that it is in the right format for analysis.
Excel Training in Perth for Professionals
To unlock the full potential of Excel for data-driven decision-making, professionals should consider specialized training programs. These programs cover advanced features, tips, and tricks that go beyond basic spreadsheet functionalities. Online Excel Courses in Perth, workshops, and certifications can equip individuals with the skills needed to navigate the complexities of modern data analysis.
Conclusion:
In a world inundated with data, the ability to extract meaningful insights is a valuable skill. Excel, with its extensive features and widespread availability, serves as a powerful ally for professionals aiming to make data-driven decisions. Investing in Excel training Perth not only enhances individual capabilities but also contributes to the overall success of organizations by fostering a culture of informed decision-making. Stay ahead in the competitive business landscape by empowering yourself with the tools and knowledge needed to turn raw data into actionable insights.
2 notes
·
View notes
Note
I read somewhere that you hope to complete Grow Young With Me for 2035. I can't help but note you are updating slower but when I graph out the chapter dates, it appears to be more of a square root function versus an exponential function. Using this mathematical analysis, it appears that you will finish your story late 2024 and provide 3-6 full chapter updates, depending on the type of function I model it after. Do you find my work is correct? If not, why not? If so, can you provide an idea of what the future 3-6 chapters will be? Thank you for responding and I greatly look forward to the completion of your story. My calendar has a reminder for the date calculated for its completion! As it is my priority work, I don't wish to share the exact calculated date in a public forum. If my work is incorrect, it would create false expectations and make for a hugely disappointing day.
One further note, though this might be a question for yourself and the co-author you work with, but I can't help but notice the pace of your co-writing has slowed down and that it is following a square root function, when graphed. Is this solely due to your influence? My confidence level is p= .04, so I calculate this would be the case. However, I must accept there may be multiple lurking variables. I can only account for the data set I am able to obtain.
Thanks again I look forward to your next release, which excites me. Either an update to your completed 'Healer Harry' or a new standalone story. In case you were curious, it's a 70% chance for a new standalone story, according to my calculations! After that though should be a 'Landlord Harry' update, followed by the Fall release of Grow Young With Me! Very, very exciting! The date is in bold and colorized with thick borders, to ensure it cannot be missed anytime I am calculating in the workbook!
Once more, thanks again for all of your writing, co-writing, and responding to this as well!
I'd sign my name but people might recognize it. I'm not ashamed to be your biggest fan. I'm told I can take things too far and so if they don't know I've spend this much time analyzing your chapter update schedule, they can't know it was me.
-Your biggest anonymous fan P.S. -- I would welcome being proven wrong because you have updated earlier than predicted. I would not welcome being proven wrong because you are slower than calculated.
Yes.
4 notes
·
View notes
Text
The above is an image of a 3D graphing program with a dog photo-shopped in to make it appear as though the function is generated by the dog disturbing the XY plane when drinking water.
3D graphing programs are used in the 21st century to visualize multivariable functions. The "height" of the ribbon above or below the XY plane is defined by the coordinates of the plane. So, if you had a function Z = X + Y, the height would be the X coordinate plus the Y coordinate. Graphing can provide insight and explanations via visual processing, which many people find easier than just working with the numbers directly. In a 3D graphic program, users are able to move and rotate the rendered 3D image to see it at different angles. It is also commonly used for generating images in math and physics textbooks.
The function is labeled in the bottom right corner. Specifically, rather than an algebraic function which a graphing program can render, it is a multi variable differentiable equation. The upside-down triangle, called Nabla or Del, means the spatial derivative of a surface. That is to say, the slope of a hill. When it is squared, it means the derivative or the derivative. So, the derivative of a surface is how steep it is (and in what direction), while the second derivative is how quickly something becomes steep (and in what direction).
Notably, this second derivative is set EQUAL to a function with no derivatives. When a second derivative of a function is based on itself, that means the 4th derivative is based on the 2nd, and the 6th derivative is based on the 4th, and so on forever. This can either be exponential growth, or a wave pattern, echoing out forever (or an exponentially growing or shrinking wave pattern), because the wave function (sine and cosine) has the property of being a constant multiple of its own 2nd derivative (as does the exponential function).
Also notably in the function, we can see that the x coordinate and y coordinate are being treated interchangeably. This means that the function is radially symmetric, forming circle patterns.
Because of the two pieces of information above, an individual trained and experiences with multi-variable differential functions (a university level topic in math that most people in the early twenty-first century would not have), would quickly understand that the function would make a circular wave, like a pebble dropped in a pond. 3D graphing software can be used to show the actual shape (of a single solution).
A picture of the dog shlorping the function without the graph would make the same joke, but it would far, far less widely understood and less viscerally pleasing.

oh no , the dog is drinking the wave equation
#period novel details#I probably explain both too much and too little with these mathy things#people who already know the math would find it obvious#people who don't won't understand the terms#its not a super helpful explanation#but maybe some people will find value in it
57K notes
·
View notes