#kubernetes pod
Explore tagged Tumblr posts
Visit Tumblr Blog
Explore Tumblr blogs with no restrictions, modern design and the best experience.
Last Seen Tumblr Blogs


Fun Fact
Tumblr’s reach among the 26-to-35-year-olds in the US is 11%.
Text
Introduction to Kubernetes
Kubernetes, often abbreviated as K8s, is an open-source platform designed to automate deploying, scaling, and operating application containers. Originally developed by Google, it is now maintained by the Cloud Native Computing Foundation (CNCF). Kubernetes has become the de facto standard for container orchestration, offering a robust framework for managing microservices architectures in production environments.
In today's rapidly evolving tech landscape, Kubernetes plays a crucial role in modern application development. It provides the necessary tools and capabilities to handle complex, distributed systems reliably and efficiently. From scaling applications seamlessly to ensuring high availability, Kubernetes is indispensable for organizations aiming to achieve agility and resilience in their software deployments.
History and Evolution of Kubernetes
The origins of Kubernetes trace back to Google's internal system called Borg, which managed large-scale containerized applications. Drawing from years of experience and lessons learned with Borg, Google introduced Kubernetes to the public in 2014. Since then, it has undergone significant development and community contributions, evolving into a comprehensive and flexible orchestration platform.
Some key milestones in the evolution of Kubernetes include its donation to the CNCF in 2015, the release of version 1.0 the same year, and the subsequent releases that brought enhanced features and stability. Today, Kubernetes is supported by a vast ecosystem of tools, extensions, and integrations, making it a cornerstone of cloud-native computing.
Key Concepts and Components
Nodes and Clusters
A Kubernetes cluster is a set of nodes, where each node can be either a physical or virtual machine. There are two types of nodes: master nodes, which manage the cluster, and worker nodes, which run the containerized applications.
Pods and Containers
At the core of Kubernetes is the concept of a Pod, the smallest deployable unit that can contain one or more containers. Pods encapsulate an application’s container(s), storage resources, a unique network IP, and options on how the container(s) should run.
Deployments and ReplicaSets
Deployments are used to manage and scale sets of identical Pods. A Deployment ensures that a specified number of Pods are running at all times, providing declarative updates to applications. ReplicaSets are a subset of Deployments that maintain a stable set of replica Pods running at any given time.
Services and Networking
Services in Kubernetes provide a stable IP address and DNS name to a set of Pods, facilitating seamless networking. They abstract the complexity of networking by enabling communication between Pods and other services without needing to manage individual Pod IP addresses.
Kubernetes Architecture
Master and Worker Nodes
The Kubernetes architecture is based on a master-worker model. The master node controls and manages the cluster, while the worker nodes run the applications. The master node’s key components include the API server, scheduler, and controller manager, which together manage the cluster’s state and lifecycle.
Control Plane Components
The control plane, primarily hosted on the master node, comprises several critical components:
API Server: The front-end for the Kubernetes control plane, handling all API requests for managing cluster resources.
etcd: A distributed key-value store that holds the cluster’s state data.
Scheduler: Assigns workloads to worker nodes based on resource availability and other constraints.
Controller Manager: Runs various controllers to regulate the state of the cluster, such as node controllers, replication controllers, and more.
Node Components
Each worker node hosts several essential components:
kubelet: An agent that runs on each node, ensuring containers are running in Pods.
kube-proxy: Maintains network rules on nodes, enabling communication to and from Pods.
Container Runtime: Software responsible for running the containers, such as Docker or containerd.
1 note
·
View note
Text
Kubernetes: Control Plane and Workers
In Kubernetes, the control plane and worker nodes are two key components that together form the foundation of a Kubernetes cluster. They play distinct roles in managing and running containerized applications. Here’s an explanation of each component along with examples and YAML configurations where relevant: Control Plane The control plane is the brain of the Kubernetes cluster. It manages the…

View On WordPress
0 notes
Video
youtube
Session 9 Kubernetes Pods
#youtube#👋 Welcome to our latest video where we dive deep into the fascinating world of Kubernetes Pods! 🌟 If you're interested in container orches
0 notes
Text
someone should ask chatGPT what it's like to live inside a huge kubernetes cluster... is it dark in there, is it noisy, does it hurt when pods scale up/down, are replicas more like friends or rivals, etc etc
23 notes
·
View notes
Text
so at work theres a kubernetes command called kgpo that is used to list pods and i just mentally call it the "kagepro" command :p
4 notes
·
View notes
Text
How To Use Llama 3.1 405B FP16 LLM On Google Kubernetes
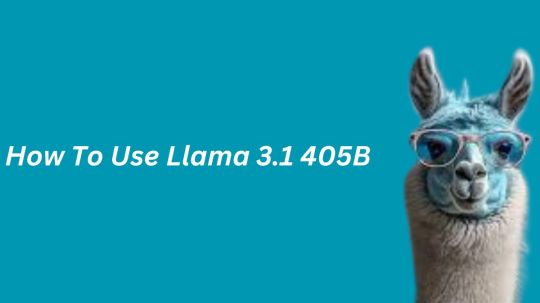
How to set up and use large open models for multi-host generation AI over GKE
Access to open models is more important than ever for developers as generative AI grows rapidly due to developments in LLMs (Large Language Models). Open models are pre-trained foundational LLMs that are accessible to the general population. Data scientists, machine learning engineers, and application developers already have easy access to open models through platforms like Hugging Face, Kaggle, and Google Cloud’s Vertex AI.
How to use Llama 3.1 405B
Google is announcing today the ability to install and run open models like Llama 3.1 405B FP16 LLM over GKE (Google Kubernetes Engine), as some of these models demand robust infrastructure and deployment capabilities. With 405 billion parameters, Llama 3.1, published by Meta, shows notable gains in general knowledge, reasoning skills, and coding ability. To store and compute 405 billion parameters at FP (floating point) 16 precision, the model needs more than 750GB of GPU RAM for inference. The difficulty of deploying and serving such big models is lessened by the GKE method discussed in this article.
Customer Experience
You may locate the Llama 3.1 LLM as a Google Cloud customer by selecting the Llama 3.1 model tile in Vertex AI Model Garden.
Once the deploy button has been clicked, you can choose the Llama 3.1 405B FP16 model and select GKE.Image credit to Google Cloud
The automatically generated Kubernetes yaml and comprehensive deployment and serving instructions for Llama 3.1 405B FP16 are available on this page.
Deployment and servicing multiple hosts
Llama 3.1 405B FP16 LLM has significant deployment and service problems and demands over 750 GB of GPU memory. The total memory needs are influenced by a number of parameters, including the memory used by model weights, longer sequence length support, and KV (Key-Value) cache storage. Eight H100 Nvidia GPUs with 80 GB of HBM (High-Bandwidth Memory) apiece make up the A3 virtual machines, which are currently the most potent GPU option available on the Google Cloud platform. The only practical way to provide LLMs such as the FP16 Llama 3.1 405B model is to install and serve them across several hosts. To deploy over GKE, Google employs LeaderWorkerSet with Ray and vLLM.
LeaderWorkerSet
A deployment API called LeaderWorkerSet (LWS) was created especially to meet the workload demands of multi-host inference. It makes it easier to shard and run the model across numerous devices on numerous nodes. Built as a Kubernetes deployment API, LWS is compatible with both GPUs and TPUs and is independent of accelerators and the cloud. As shown here, LWS uses the upstream StatefulSet API as its core building piece.
A collection of pods is controlled as a single unit under the LWS architecture. Every pod in this group is given a distinct index between 0 and n-1, with the pod with number 0 being identified as the group leader. Every pod that is part of the group is created simultaneously and has the same lifecycle. At the group level, LWS makes rollout and rolling upgrades easier. For rolling updates, scaling, and mapping to a certain topology for placement, each group is treated as a single unit.
Each group’s upgrade procedure is carried out as a single, cohesive entity, guaranteeing that every pod in the group receives an update at the same time. While topology-aware placement is optional, it is acceptable for all pods in the same group to co-locate in the same topology. With optional all-or-nothing restart support, the group is also handled as a single entity when addressing failures. When enabled, if one pod in the group fails or if one container within any of the pods is restarted, all of the pods in the group will be recreated.
In the LWS framework, a group including a single leader and a group of workers is referred to as a replica. Two templates are supported by LWS: one for the workers and one for the leader. By offering a scale endpoint for HPA, LWS makes it possible to dynamically scale the number of replicas.
Deploying multiple hosts using vLLM and LWS
vLLM is a well-known open source model server that uses pipeline and tensor parallelism to provide multi-node multi-GPU inference. Using Megatron-LM’s tensor parallel technique, vLLM facilitates distributed tensor parallelism. With Ray for multi-node inferencing, vLLM controls the distributed runtime for pipeline parallelism.
By dividing the model horizontally across several GPUs, tensor parallelism makes the tensor parallel size equal to the number of GPUs at each node. It is crucial to remember that this method requires quick network connectivity between the GPUs.
However, pipeline parallelism does not require continuous connection between GPUs and divides the model vertically per layer. This usually equates to the quantity of nodes used for multi-host serving.
In order to support the complete Llama 3.1 405B FP16 paradigm, several parallelism techniques must be combined. To meet the model’s 750 GB memory requirement, two A3 nodes with eight H100 GPUs each will have a combined memory capacity of 1280 GB. Along with supporting lengthy context lengths, this setup will supply the buffer memory required for the key-value (KV) cache. The pipeline parallel size is set to two for this LWS deployment, while the tensor parallel size is set to eight.
In brief
We discussed in this blog how LWS provides you with the necessary features for multi-host serving. This method maximizes price-to-performance ratios and can also be used with smaller models, such as the Llama 3.1 405B FP8, on more affordable devices. Check out its Github to learn more and make direct contributions to LWS, which is open-sourced and has a vibrant community.
You can visit Vertex AI Model Garden to deploy and serve open models via managed Vertex AI backends or GKE DIY (Do It Yourself) clusters, as the Google Cloud Platform assists clients in embracing a gen AI workload. Multi-host deployment and serving is one example of how it aims to provide a flawless customer experience.
Read more on Govindhtech.com
#Llama3.1#Llama#LLM#GoogleKubernetes#GKE#405BFP16LLM#AI#GPU#vLLM#LWS#News#Technews#Technology#Technologynews#Technologytrends#govindhtech
2 notes
·
View notes
Text
Load Balancing Web Sockets with K8s/Istio
When load balancing WebSockets in a Kubernetes (K8s) environment with Istio, there are several considerations to ensure persistent, low-latency connections. WebSockets require special handling because they are long-lived, bidirectional connections, which are different from standard HTTP request-response communication. Here’s a guide to implementing load balancing for WebSockets using Istio.
1. Enable WebSocket Support in Istio
By default, Istio supports WebSocket connections, but certain configurations may need tweaking. You should ensure that:
Destination rules and VirtualServices are configured appropriately to allow WebSocket traffic.
Example VirtualService Configuration.
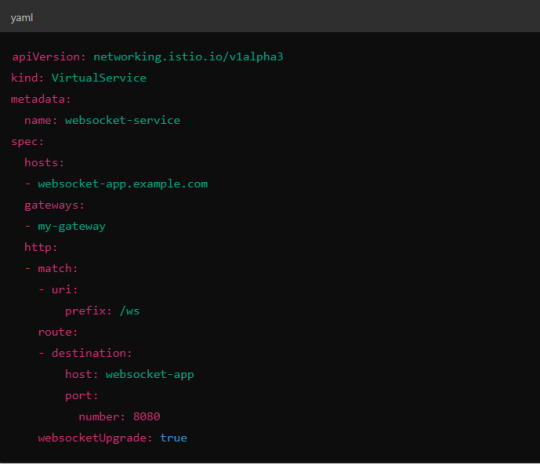
Here, websocketUpgrade: true explicitly allows WebSocket traffic and ensures that Istio won’t downgrade the WebSocket connection to HTTP.
2. Session Affinity (Sticky Sessions)
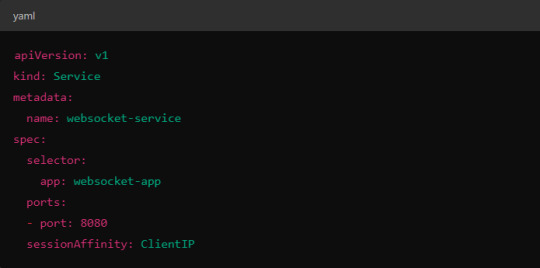
In WebSocket applications, sticky sessions or session affinity is often necessary to keep long-running WebSocket connections tied to the same backend pod. Without session affinity, WebSocket connections can be terminated if the load balancer routes the traffic to a different pod.
Implementing Session Affinity in Istio.
Session affinity is typically achieved by setting the sessionAffinity field to ClientIP at the Kubernetes service level.
In Istio, you might also control affinity using headers. For example, Istio can route traffic based on headers by configuring a VirtualService to ensure connections stay on the same backend.
3. Load Balancing Strategy
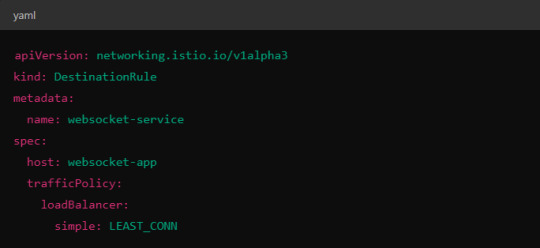
Since WebSocket connections are long-lived, round-robin or random load balancing strategies can lead to unbalanced workloads across pods. To address this, you may consider using least connection or consistent hashing algorithms to ensure that existing connections are efficiently distributed.
Load Balancer Configuration in Istio.
Istio allows you to specify different load balancing strategies in the DestinationRule for your services. For WebSockets, the LEAST_CONN strategy may be more appropriate.
Alternatively, you could use consistent hashing for a more sticky routing based on connection properties like the user session ID.
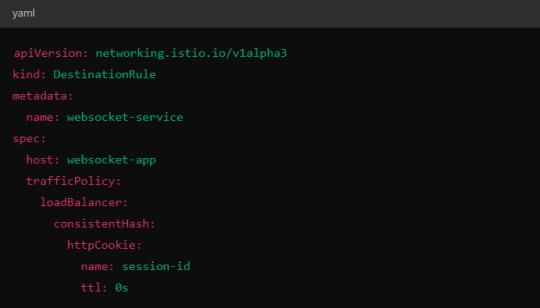
This configuration ensures that connections with the same session ID go to the same pod.
4. Scaling Considerations
WebSocket applications can handle a large number of concurrent connections, so you’ll need to ensure that your Kubernetes cluster can scale appropriately.
Horizontal Pod Autoscaler (HPA): Use an HPA to automatically scale your pods based on metrics like CPU, memory, or custom metrics such as open WebSocket connections.
Istio Autoscaler: You may also scale Istio itself to handle the increased load on the control plane as WebSocket connections increase.
5. Connection Timeouts and Keep-Alive
Ensure that both your WebSocket clients and the Istio proxy (Envoy) are configured for long-lived connections. Some settings that need attention:
Timeouts: In VirtualService, make sure there are no aggressive timeout settings that would prematurely close WebSocket connections.
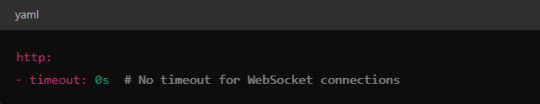
Keep-Alive Settings: You can also adjust the keep-alive settings at the Envoy level if necessary. Envoy, the proxy used by Istio, supports long-lived WebSocket connections out-of-the-box, but custom keep-alive policies can be configured.
6. Ingress Gateway Configuration
If you're using an Istio Ingress Gateway, ensure that it is configured to handle WebSocket traffic. The gateway should allow for WebSocket connections on the relevant port.
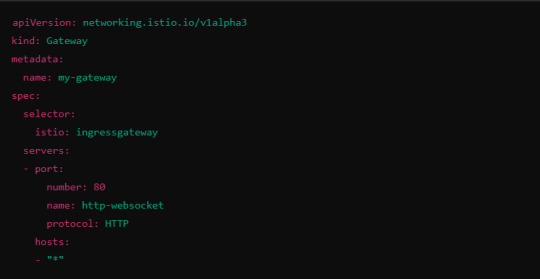
This configuration ensures that the Ingress Gateway can handle WebSocket upgrades and correctly route them to the backend service.
Summary of Key Steps
Enable WebSocket support in Istio’s VirtualService.
Use session affinity to tie WebSocket connections to the same backend pod.
Choose an appropriate load balancing strategy, such as least connection or consistent hashing.
Set timeouts and keep-alive policies to ensure long-lived WebSocket connections.
Configure the Ingress Gateway to handle WebSocket traffic.
By properly configuring Istio, Kubernetes, and your WebSocket service, you can efficiently load balance WebSocket connections in a microservices architecture.
#kubernetes#websockets#Load Balancing#devops#linux#coding#programming#Istio#virtualservices#Load Balancer#Kubernetes cluster#gateway#python#devlog#github#ansible
5 notes
·
View notes
Text
It looks like some of the cronjobs that would normally maintain NextCloud Memories are not set up by the kube pod that they use for apps so I am learning things about Kubernetes against my will. Committing crimes by running shells inside pods.
When I learned about Docker against my will I also turned out to think that was pretty neat so, you know. Kubernetes can use Docker but this one doesn't.
#I think pretty much everyone who learns about kubernetes learns it against their will#computer stuff
6 notes
·
View notes
Text
Master Advanced OpenShift Operations with Red Hat DO380
In today’s dynamic DevOps landscape, container orchestration platforms like OpenShift have become the backbone of modern enterprise applications. For professionals looking to deepen their expertise in managing OpenShift clusters at scale, Red Hat OpenShift Administration III: Scaling Deployments in the Enterprise (DO380) is a game-changing course.
🎯 What is DO380?
The DO380 course is designed for experienced OpenShift administrators and site reliability engineers (SREs) who want to extend their knowledge beyond basic operations. It focuses on day-2 administration tasks in Red Hat OpenShift Container Platform 4.12 and above, including automation, performance tuning, security, and cluster scaling.
📌 Key Highlights of DO380
🔹 Advanced Cluster Management Learn how to manage large-scale OpenShift environments using tools like the OpenShift CLI (oc), the web console, and GitOps workflows.
🔹 Performance Tuning Analyze cluster performance metrics and implement tuning configurations to optimize workloads and resource utilization.
🔹 Monitoring & Logging Use the OpenShift monitoring stack and log aggregation tools to troubleshoot issues and maintain visibility into cluster health.
🔹 Security & Compliance Implement advanced security practices, including custom SCCs (Security Context Constraints), Network Policies, and OAuth integrations.
🔹 Cluster Scaling Master techniques to scale infrastructure and applications dynamically using horizontal and vertical pod autoscaling, and custom metrics.
🔹 Backup & Disaster Recovery Explore methods to back up and restore OpenShift components using tools like Velero.
🧠 Who Should Take This Course?
This course is ideal for:
Red Hat Certified System Administrators (RHCSA) and Engineers (RHCE)
Kubernetes administrators
Platform engineers and SREs
DevOps professionals managing OpenShift clusters in production environments
📚 Prerequisites
To get the most out of DO380, learners should have completed:
Red Hat OpenShift Administration I (DO180)
Red Hat OpenShift Administration II (DO280)
Or possess equivalent knowledge and hands-on experience with OpenShift clusters
🏅 Certification Pathway
After completing DO380, you’ll be well-prepared to pursue the Red Hat Certified Specialist in OpenShift Administration and progress toward the prestigious Red Hat Certified Architect (RHCA) credential.
📈 Why Choose HawkStack for DO380?
At HawkStack Technologies, we offer:
✅ Certified Red Hat instructors ✅ Hands-on labs and real-world scenarios ✅ Corporate and individual learning paths ✅ Post-training mentoring & support ✅ Flexible batch timings (weekend/weekday)
🚀 Ready to Level Up?
If you're looking to scale your OpenShift expertise and manage enterprise-grade clusters with confidence, DO380 is your next step.
For more details www.hawkstack.com
0 notes
Text
Kubernetes Tutorials | Waytoeasylearn
Learn how to become a Certified Kubernetes Administrator (CKA) with this all-in-one Kubernetes course. It is suitable for complete beginners as well as experienced DevOps engineers. This practical, hands-on class will teach you how to understand Kubernetes architecture, deploy and manage applications, scale services, troubleshoot issues, and perform admin tasks. It covers everything you need to confidently pass the CKA exam and run containerized apps in production.
Learn Kubernetes the easy way! 🚀 Best tutorials at Waytoeasylearn for mastering Kubernetes and cloud computing efficiently.➡️ Learn Now

Whether you are studying for the CKA exam or want to become a Kubernetes expert, this course offers step-by-step lessons, real-life examples, and labs focused on exam topics. You will learn from Kubernetes professionals and gain skills that employers are looking for.
Key Learning Outcomes: Understand Kubernetes architecture, components, and key ideas. Deploy, scale, and manage containerized apps on Kubernetes clusters. Learn to use kubectl, YAML files, and troubleshoot clusters. Get familiar with pods, services, deployments, volumes, namespaces, and RBAC. Set up and run production-ready Kubernetes clusters using kubeadm. Explore advanced topics like rolling updates, autoscaling, and networking. Build confidence with real-world labs and practice exams. Prepare for the CKA exam with helpful tips, checklists, and practice scenarios.
Who Should Take This Course: Aspiring CKA candidates. DevOps engineers, cloud engineers, and system admins. Software developers moving into cloud-native work. Anyone who wants to master Kubernetes for real jobs.
1 note
·
View note
Text
DevOps Course Online for Beginners and Professionals
Introduction: Why DevOps Skills Matter Today
In today's fast-paced digital world, businesses rely on faster software delivery and reliable systems. DevOps, short for Development and Operations, offers a practical solution to achieve this. It’s no longer just a trend; it’s a necessity for IT teams across all industries. From startups to enterprise giants, organizations are actively seeking professionals with strong DevOps skills.
Whether you're a beginner exploring career opportunities in IT or a seasoned professional looking to upskill, DevOps training online is your gateway to success. In this blog, we’ll walk you through everything you need to know about enrolling in a DevOps course online, from fundamentals to tools, certifications, and job placements.
What Is DevOps?
Definition and Core Principles
DevOps is a cultural and technical movement that unites software development and IT operations. It aims to shorten the software development lifecycle, ensuring faster delivery and higher-quality applications.
Core principles include:
Automation: Minimizing manual processes through scripting and tools
Continuous Integration/Continuous Deployment (CI/CD): Rapid code integration and release
Collaboration: Breaking down silos between dev, QA, and ops
Monitoring: Constant tracking of application performance and system health
These practices help businesses innovate faster and respond quickly to customer needs.
Why Choose a DevOps Course Online?
Accessibility and Flexibility
With DevOps training online, learners can access material anytime, anywhere. Whether you're working full-time or managing other responsibilities, online learning offers flexibility.
Updated Curriculum
A high-quality DevOps online course includes the latest tools and techniques used in the industry today, such as:
Jenkins
Docker
Kubernetes
Git and GitHub
Terraform
Ansible
Prometheus and Grafana
You get hands-on experience using real-world DevOps automation tools, making your learning practical and job-ready.
Job-Focused Learning
Courses that offer DevOps training with placement often include resume building, mock interviews, and one-on-one mentoring, equipping you with everything you need to land a job.
Who Should Enroll in a DevOps Online Course?
DevOps training is suitable for:
Freshers looking to start a tech career
System admins upgrading their skills
Software developers wanting to automate and deploy faster
IT professionals interested in cloud and infrastructure management
If you're curious about modern IT processes and enjoy problem-solving, DevOps is for you.
What You’ll Learn in a DevOps Training Program
1. Introduction to DevOps Concepts
DevOps lifecycle
Agile and Scrum methodologies
Collaboration between development and operations teams
2. Version Control Using Git
Git basics and repository setup
Branching, merging, and pull requests
Integrating Git with DevOps pipelines
3. CI/CD with Jenkins
Pipeline creation
Integration with Git
Automating builds and test cases
4. Containerization with Docker
Creating Docker images and containers
Docker Compose and registries
Real-time deployment examples
5. Orchestration with Kubernetes
Cluster architecture
Pods, services, and deployments
Scaling and rolling updates
6. Configuration Management with Ansible
Writing playbooks
Managing inventories
Automating infrastructure setup
7. Infrastructure as Code with Terraform
Deploying cloud resources
Writing reusable modules
State management and versioning
8. Monitoring and Logging
Using Prometheus and Grafana
Alerts and dashboards
Log management practices
This hands-on approach ensures learners are not just reading slides but working with real tools.
Real-World Projects You’ll Build
A good DevOps training and certification program includes projects like:
CI/CD pipeline from scratch
Deploying a containerized application on Kubernetes
Infrastructure provisioning on AWS or Azure using Terraform
Monitoring systems with Prometheus and Grafana
These projects simulate real-world problems, boosting both your confidence and your resume.
The Value of DevOps Certification
Why It Matters
Certification adds credibility to your skills and shows employers you're job-ready. A DevOps certification can be a powerful tool when applying for roles such as:
DevOps Engineer
Site Reliability Engineer (SRE)
Build & Release Engineer
Automation Engineer
Cloud DevOps Engineer
Courses that include DevOps training and placement also support your job search with interview preparation and job referrals.
Career Opportunities and Salary Trends
High Demand, High Pay
According to industry reports, DevOps engineers are among the highest-paid roles in IT. Average salaries range from $90,000 to $140,000 annually, depending on experience and region.
Industries hiring DevOps professionals include:
Healthcare
Finance
E-commerce
Telecommunications
Software as a Service (SaaS)
With the right DevOps bootcamp online, you’ll be prepared to meet these opportunities head-on.
Step-by-Step Guide to Getting Started
Step 1: Assess Your Current Skill Level
Understand your background. If you're a beginner, start with fundamentals. Professionals can skip ahead to advanced modules.
Step 2: Choose the Right DevOps Online Course
Look for these features:
Structured curriculum
Hands-on labs
Real-world projects
Mentorship
DevOps training with placement support
Step 3: Build a Portfolio
Document your projects on GitHub to show potential employers your work.
Step 4: Get Certified
Choose a respected DevOps certification to validate your skills.
Step 5: Apply for Jobs
Use placement support services or apply directly. Showcase your portfolio and certifications confidently.
Common DevOps Tools You’ll Master
Tool
Use Case
Git
Source control and version tracking
Jenkins
CI/CD pipeline automation
Docker
Application containerization
Kubernetes
Container orchestration
Terraform
Infrastructure as Code
Ansible
Configuration management
Prometheus
Monitoring and alerting
Grafana
Dashboard creation for system metrics
Mastering these DevOps automation tools equips you to handle end-to-end automation pipelines in real-world environments.
Why H2K Infosys for DevOps Training?
H2K Infosys offers one of the best DevOps training online programs with:
Expert-led sessions
Practical labs and tools
Real-world projects
Resume building and interview support
DevOps training with placement assistance
Their courses are designed to help both beginners and professionals transition into high-paying roles smoothly.
Key Takeaways
DevOps combines development and operations for faster, reliable software delivery
Online courses offer flexible, hands-on learning with real-world tools
A DevOps course online is ideal for career starters and upskillers alike
Real projects, certifications, and placement support boost job readiness
DevOps is one of the most in-demand and well-paying IT domains today
Conclusion
Ready to build a future-proof career in tech? Enroll in H2K Infosys’ DevOps course online for hands-on training, real-world projects, and career-focused support. Learn the tools that top companies use and get placement-ready today.
#devops training#devops training online#devops online training#devops training and certification#devops training with placement#devops online course#best devops training online#devops training and placement#devops course online#devops bootcamp online#DevOps automation tools
0 notes
Text
Mastering Kubernetes Networking: From Basics to Best Practices
Kubernetes is a powerful platform for container orchestration, but its networking capabilities are often misunderstood. To effectively use Kubernetes, it's essential to understand how networking works within the platform. In this guide, we'll explore the fundamentals of Kubernetes networking, including network policies, service discovery, and network topologies. The first step in understanding Kubernetes networking is to understand the different components involved. There are several key components, including pods, services, and deployments. Pods are the basic execution units in Kubernetes, while services provide a stable network identity and load balancing. Deployments are used to manage the rollout of new versions of an application. To establish communication between pods, Kubernetes uses a combination of host networking and overlay networking. Host networking relies on the underlying infrastructure to provide connectivity between pods, while overlay networking uses a virtual network to provide isolation and security. IAMDevBox.com provides a comprehensive overview of both approaches. Managing networking in Kubernetes can be challenging, especially for large-scale deployments. To overcome these challenges, it's essential to understand common issues such as network latency, packet loss, and security breaches. By understanding these challenges, you can implement effective solutions to optimize your network architecture. Read more: https://www.iamdevbox.com/posts/
0 notes
Text
Cloud Cost Optimization: Proven Tactics to Cut Spend Without Sacrificing Performance
Cloud computing offers incredible scalability, flexibility, and performance — but without careful management, costs can spiral out of control. Many businesses discover too late that what starts as a cost-effective solution can quickly become a budgetary burden.
Cloud cost optimization is not just about cutting expenses — it’s about maximizing value. In this blog, we’ll explore proven strategies to reduce cloud spend without compromising performance, reliability, or scalability.
📉 Why Cloud Costs Escalate
Before we dive into tactics, it’s important to understand why cloud bills often balloon:
Overprovisioned resources (more CPU/RAM than needed)
Idle or unused services running 24/7
Lack of visibility into usage patterns
Inefficient storage practices
No tagging or accountability for resource ownership
Ignoring cost-effective services like spot instances
✅ 1. Right-Size Your Resources
Many teams overestimate capacity needs, leaving resources idle.
Optimization Tip: Use tools like AWS Cost Explorer, Azure Advisor, or Google Cloud Recommender to analyze resource utilization and scale down underused instances or switch to smaller configurations.
Examples:
Downgrade from m5.2xlarge to m5.large
Reduce EBS volume sizes
Remove over-provisioned Kubernetes pods
💤 2. Eliminate Idle and Unused Resources
Even seemingly harmless resources like unattached volumes, idle load balancers, and unused snapshots can rack up charges over time.
Optimization Tip: Set up automated scripts or third-party tools (like CloudHealth or Spot.io) to detect and delete unused resources on a regular schedule.
🕒 3. Leverage Auto-Scaling and Scheduled Shutdowns
Not all applications need to run at full capacity 24/7. Auto-scaling ensures resources grow and shrink based on actual demand.
Optimization Tip:
Use auto-scaling groups for web and backend servers
Schedule development and staging environments to shut down after hours
Turn off test VMs or containers on weekends
💲 4. Use Reserved and Spot Instances
On-demand pricing is convenient, but it’s not always cost-effective.
Reserved Instances (RIs): Commit to 1 or 3 years for significant discounts (up to 72%)
Spot Instances: Take advantage of spare capacity at up to 90% lower cost (ideal for batch processing or fault-tolerant apps)
Optimization Tip: Use a blended strategy — combine on-demand, reserved, and spot instances for optimal flexibility and savings.
🗂️ 5. Optimize Storage Costs
Storage often goes unchecked in cloud environments. Tiered storage models offer cost savings based on access frequency.
Optimization Tip:
Move infrequently accessed data to cheaper storage (e.g., S3 Glacier or Azure Archive Storage)
Delete outdated logs or compress large files
Use lifecycle policies to automate archival
🧩 6. Implement Cost Allocation Tags
Tagging resources by project, environment, team, or client provides visibility into who is using what — and how much it costs.
Optimization Tip:
Standardize a tagging policy (e.g., env:production, team:marketing, project:salzen-app)
Use cost reports to hold teams accountable for resource usage
📊 7. Monitor, Alert, and Analyze
Visibility is key to continuous optimization. Without real-time monitoring, overspend can go unnoticed until the bill arrives.
Optimization Tip:
Use native tools like AWS Budgets, Azure Cost Management, or GCP Billing Reports
Set budget alerts and forecast future usage
Perform monthly reviews to track anomalies or spikes
🔧 8. Use Third-Party Cost Optimization Tools
Cloud-native tools are great, but third-party solutions provide more advanced analytics, recommendations, and automation.
Popular Options:
CloudHealth by VMware
Apptio Cloudability
Spot by NetApp
Harness Cloud Cost Management
These tools help with governance, forecasting, and even automated resource orchestration.
🧠 Bonus: Adopt a FinOps Culture
FinOps is a financial management discipline that brings together finance, engineering, and product teams to optimize cloud spending collaboratively.
Optimization Tip:
Promote cost-awareness across departments
Make cost metrics part of engineering KPIs
Align cloud budgets with business outcomes
🧭 Final Thoughts
Cloud cost optimization isn’t a one-time project — it’s a continuous, data-driven process. With the right tools, policies, and cultural practices, you can control costs without compromising the performance or flexibility the cloud offers.
Looking to reduce your cloud bill by up to 40%? Salzen Cloud helps businesses implement real-time cost visibility, automation, and cost-optimized architectures. Our experts can audit your cloud setup and design a tailored savings strategy — without disrupting your operations.
0 notes
Text
North America Cloud Security Market Size, Revenue, End Users And Forecast Till 2028
The North America cloud security market is expected to grow from US$ 17,168.84 million in 2022 to US$ 42,944.12 million by 2028. It is estimated to grow at a CAGR of 16.5% from 2022 to 2028.
Surging Managed Container Services is fueling the growth of North America cloud security market
The use of containers in the IT sector has increased exponentially in recent years. A large number of businesses use managed or native Kubernetes orchestration; the well-known managed cloud services used by these enterprises include Amazon Elastic Container Service for Kubernetes, Azure Kubernetes Service, and Google Kubernetes Engine. These managed service platforms have simplified the management, deployment, and scaling of use cases. With the increasing use of containers, enterprises need to ensure that the right security solutions are in place to prevent security issues. For instance, the pods of Kubernetes clusters might receive traffic from any source, raising security issues throughout the company. To prevent attacks on vulnerable networks, enterprises implement network policies for their managed Kubernetes services. Thus, the adoption of managed container services is bolstering the growth of the North America cloud security market.
Grab PDF To Know More @ https://www.businessmarketinsights.com/sample/BMIRE00028041
North America Cloud Security Market Overview
The US, Canada, and Mexico are among the major economies in North America. With higher penetration of large and mid-sized companies, there is a growing frequency of cyber-attacks and the increasing number of hosted servers. Moreover, growing number of cyber crime and the production of new cyber attacks, as well as surge in usage of cloud-based solutions are all becoming major factor propelling the adoption of cloud security solutions and services. In addition, to enhance IT infrastructure and leverage the benefits of technologies such as AI and ML, there is a growing adoption of cloud security and therefore, becoming major factors contributing towards the market growth. Furthermore, there is huge growth potential in industries such as energy, manufacturing, and utilities, as they are continuously migrating towards digital-transformed methods of operations and focusing on data protection measures. Major companies such as Microsoft, Google, Cisco, McAfee, Palo Alto Networks, FireEye, and Fortinet and start-ups in the North America cloud security market provide cloud security solutions and services.
North America Cloud Security Strategic Insights
Strategic insights for the North America Cloud Security provides data-driven analysis of the industry landscape, including current trends, key players, and regional nuances. These insights offer actionable recommendations, enabling readers to differentiate themselves from competitors by identifying untapped segments or developing unique value propositions. Leveraging data analytics, these insights help industry players anticipate the market shifts, whether investors, manufacturers, or other stakeholders. A future-oriented perspective is essential, helping stakeholders anticipate market shifts and position themselves for long-term success in this dynamic region. Ultimately, effective strategic insights empower readers to make informed decisions that drive profitability and achieve their business objectives within the market.
Market leaders and key company profiles
Amazon Web Services
Microsoft Corp
International Business Machines Corp
Oracle Corp
Trend Micro Incorporated
VMware, Inc.
Palo Alto Networks, Inc.
Cisco Systems Inc
Check Point Software Technologies Ltd.
Google LLC
North America Cloud Security Regional Insights
The geographic scope of the North America Cloud Security refers to the specific areas in which a business operates and competes. Understanding local distinctions, such as diverse consumer preferences (e.g., demand for specific plug types or battery backup durations), varying economic conditions, and regulatory environments, is crucial for tailoring strategies to specific markets. Businesses can expand their reach by identifying underserved areas or adapting their offerings to meet local demands. A clear market focus allows for more effective resource allocation, targeted marketing campaigns, and better positioning against local competitors, ultimately driving growth in those targeted areas.
North America Cloud Security Market Segmentation
The North America cloud security market is segmented into service model, deployment model, enterprise size, solution type, industry vertical, and country. Based on service model, the North America cloud security market is segmented into infrastructure as a service (IaaS), platform as a service (PaaS) and software as a service (SaaS). The software-as-a-service (SaaS)segment registered the largest market share in 2022.
Based on deployment model, the North America cloud security market is segmented into public cloud, private cloud, and hybrid cloud. The public cloud segment registered the largest market share in 2022.Based on enterprise size, the North America cloud security market is segmented into small and medium-sized enterprises (SMEs), and large enterprises. The large enterprises segment registered a larger market share in 2022.
About Us:
Business Market Insights is a market research platform that provides subscription service for industry and company reports. Our research team has extensive professional expertise in domains such as Electronics & Semiconductor; Aerospace & Defence; Automotive & Transportation; Energy & Power; Healthcare; Manufacturing & Construction; Food & Beverages; Chemicals & Materials; and Technology, Media, & Telecommunications.
0 notes
Text
Kubernetes Pods: Set and Read Environment Variables
Create a simple Pod with environment variables
Access environment variables inside the container
Check environment variables without logging in
Learn how environment variables improve deployments
Perfect for beginners and DevOps engineers!
youtube
0 notes
Text
Effective Kubernetes cluster monitoring simplifies containerized workload management by measuring uptime, resource use (such as memory, CPU, and storage), and interaction between cluster components. It also enables cluster managers to monitor the cluster and discover issues such as inadequate resources, errors, pods that fail to start, and nodes that cannot join the cluster. Essentially, Kubernetes monitoring enables you to discover issues and manage Kubernetes clusters more proactively. What Kubernetes Metrics Should You Measure? Monitoring Kubernetes metrics is critical for ensuring the reliability, performance, and efficiency of applications in a Kubernetes cluster. Because Kubernetes constantly expands and maintains containers, measuring critical metrics allows you to spot issues early on, optimize resource allocation, and preserve overall system integrity. Several factors are critical to watch with Kubernetes: Cluster monitoring - Monitors the health of the whole Kubernetes cluster. It helps you find out how many apps are running on a node, if it is performing efficiently and at the right capacity, and how much resource the cluster requires overall. Pod monitoring - Tracks issues impacting individual pods, including resource use, application metrics, and pod replication or auto scaling metrics. Ingress metrics - Monitoring ingress traffic can help in discovering and managing a variety of issues. Using controller-specific methods, ingress controllers can be set up to track network traffic information and workload health. Persistent storage - Monitoring volume health allows Kubernetes to implement CSI. You can also use the external health monitor controller to track node failures. Control plane metrics - With control plane metrics we can track and visualize cluster performance while troubleshooting by keeping an eye on schedulers, controllers, and API servers. Node metrics - Keeping an eye on each Kubernetes node's CPU and memory usage might help ensure that they never run out. A running node's status can be defined by a number of conditions, such as Ready, MemoryPressure, DiskPressure, OutOfDisk, and NetworkUnavailable. Monitoring and Troubleshooting Kubernetes Clusters Using the Kubernetes Dashboard The Kubernetes dashboard is a web-based user interface for Kubernetes. It allows you to deploy containerized apps to a Kubernetes cluster, see an overview of the applications operating on the cluster, and manage cluster resources. Additionally, it enables you to: Debug containerized applications by examining data on the health of your Kubernetes cluster's resources, as well as any anomalies that have occurred. Create and modify individual Kubernetes resources, including deployments, jobs, DaemonSets, and StatefulSets. Have direct control over your Kubernetes environment using the Kubernetes dashboard. The Kubernetes dashboard is built into Kubernetes by default and can be installed and viewed from the Kubernetes master node. Once deployed, you can visit the dashboard via a web browser to examine extensive information about your Kubernetes cluster and conduct different operations like scaling deployments, establishing new resources, and updating application configurations. Kubernetes Dashboard Essential Features Kubernetes Dashboard comes with some essential features that help manage and monitor your Kubernetes clusters efficiently: Cluster overview: The dashboard displays information about your Kubernetes cluster, including the number of nodes, pods, and services, as well as the current CPU and memory use. Resource management: The dashboard allows you to manage Kubernetes resources, including deployments, services, and pods. You can add, update, and delete resources while also seeing extensive information about them. Application monitoring: The dashboard allows you to monitor the status and performance of Kubernetes-based apps. You may see logs and stats, fix issues, and set alarms.
Customizable views: The dashboard allows you to create and preserve bespoke dashboards with the metrics and information that are most essential to you. Kubernetes Monitoring Best Practices Here are some recommended practices to help you properly monitor and debug Kubernetes installations: 1. Monitor Kubernetes Metrics Kubernetes microservices require understanding granular resource data like memory, CPU, and load. However, these metrics may be complex and challenging to leverage. API indicators such as request rate, call error, and latency are the most effective KPIs for identifying service faults. These metrics can immediately identify degradations in a microservices application's components. 2. Ensure Monitoring Systems Have Enough Data Retention Having scalable monitoring solutions helps you to efficiently monitor your Kubernetes cluster as it grows and evolves over time. As your Kubernetes cluster expands, so will the quantity of data it creates, and your monitoring systems must be capable of handling this rise. If your systems are not scalable, they may get overwhelmed by the volume of data and be unable to offer accurate or relevant results. 3. Integrate Monitoring Systems Into Your CI/CD Pipeline Source Integrating Kubernetes monitoring solutions with CI/CD pipelines enables you to monitor your apps and infrastructure as they are deployed, rather than afterward. By connecting your monitoring systems to your pipeline for continuous integration and delivery (CI/CD), you can automatically collect and process data from your infrastructure and applications as it is delivered. This enables you to identify potential issues early on and take action to stop them from getting worse. 4. Create Alerts You may identify the problems with your Kubernetes cluster early on and take action to fix them before they get worse by setting up the right alerts. For example, if you configure alerts for crucial metrics like CPU or memory use, you will be informed when those metrics hit specific thresholds, allowing you to take action before your cluster gets overwhelmed. Conclusion Kubernetes allows for the deployment of a large number of containerized applications within its clusters, each of which has nodes that manage the containers. Efficient observability across various machines and components is critical for successful Kubernetes container orchestration. Kubernetes has built-in monitoring facilities for its control plane, but they may not be sufficient for thorough analysis and granular insight into application workloads, event logging, and other microservice metrics within Kubernetes clusters.
0 notes