#oscillators
Text
A Belousov–Zhabotinsky reaction, or BZ reaction, is one of a class of reactions that serve as a classical example of non-equilibrium thermodynamics, resulting in the establishment of a nonlinear chemical oscillator.
380 notes
·
View notes
Text


never let an objectum into an antique store
18 notes
·
View notes
Text
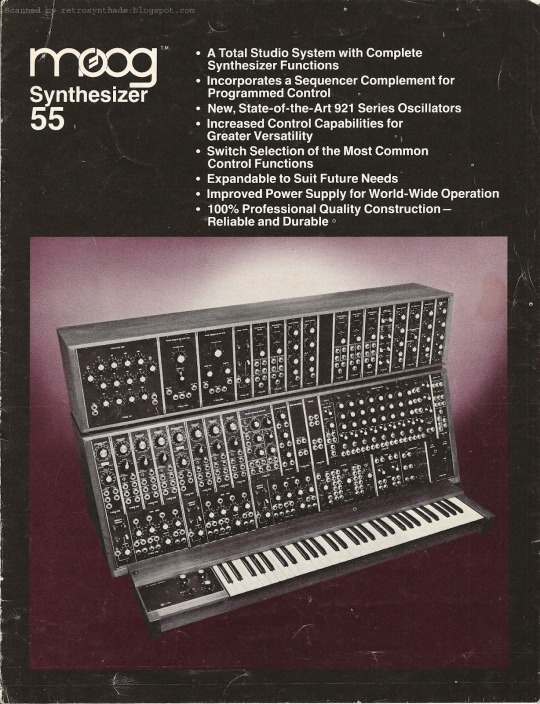
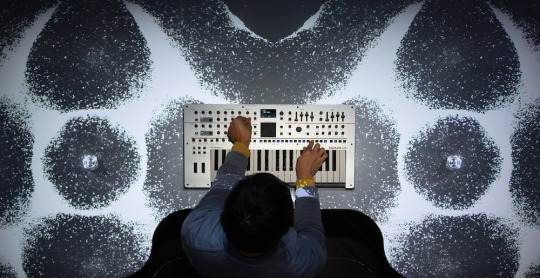
Moog System 55
From Retrosynthads.blogspot.com
#moog synthesizer#model 55#electronic music instruments#70s#60s#modular#original post#moog#synthesizer#vintage advert#machine#oscillators#filters#VCOs#VCFs
39 notes
·
View notes
Text
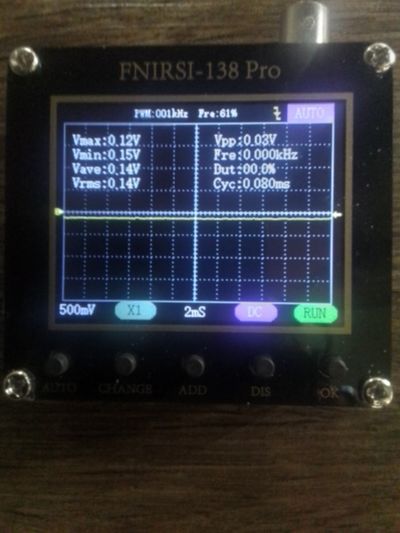
I Got A New Oscilloscope From Amazon A Must Have When It Come To Music Production, It Has Upped My Game 100% When It Comes To Sound Design You Can Get One Relitivly Cheep From Amazon Or Wish.com For Around 30$ to 40$ I Also Got A 3.5 mm Jack Capable Of Comnecting To The Oscilloscope To My Synthesizers Which I Have Few Of In My Home Music Studio
#musicstudio#new music#piano music#modular synthesizer#synthesizer#synthesizers#electronicmusic#music#musicproducerlife#music producer#music production#oscilloscope#oscillators#oscillations#beatmaker#beatmakers#beatmakerslife#beatmakerlife#studiolife#musicstudiolife#musicstudiogear#music gear#synths#ILoveSynthesizers#minimoog#roland#korg#musicproduction#musicproductionlife#Oscilloscopes
2 notes
·
View notes
Text
Understanding Oscillators: How They Work and Why They Matter
The ability to quickly assess market changes is a necessity in trading. As an essential component of technical analysis, oscillators give traders important data about the direction of the market and possible turning moments. These tools are especially helpful in identifying situations in which assets are overvalued or oversold.
What Is Oscillator?
An oscillator is a trading tool for determining the momentum of price changes and spotting possible turning points in the market. It shows when a stock or other asset might be bought or sold in large quantities. The oscillator can indicate signs that the price could soon change direction.
An oscillator is a technical analysis tool that measures the momentum of price movements. It helps traders identify potential market reversals by indicating overbought or oversold conditions.
Oscillators track the speed and direction of price movements by analyzing price data over a set period and displaying this data graphically, aiding traders in visualizing market momentum.
There are several types of oscillators, each with unique features and uses. Those include the relative strength index (RSI), stochastic oscillator, and moving average convergence divergence (MACD).
Oscillators help traders refine trading strategies by providing timely buy or sell signals based on identified market conditions, thus enhancing their decision-making process and potential profitability.
Oscillators also have limitations, such as the potential to generate false signals during strong trending markets.
The oscillator’s fundamental role is to gauge market conditions by measuring the speed of price changes. It achieves this by comparing the current price to a price from a previous period, with the primary objective of interpreting the force behind price movements.
Learn more about Oscillators: https://finxpdx.com/oscillator-gain-a-competitive-edge-in-trading-with-it/
0 notes
Text
The Mystery: Understanding Oscillators in Technical Analysis
Subtitle - Insider Tips for Mastering Technical Analysis with Oscillators
Subtitle - A Comprehensive Guide to Technical Analysis - A Full Details
So, you have got the itch to turn out to be a pinnacle-notch dealer, huh? Well, you are successful! When it involves navigating the wild international of buying and selling, learning technical evaluation is your golden price tag. And wager what? Oscillators are like your secret guns on this thrilling adventure. In this manual, we are going to dive deep into magical gear like RSI, MACD, and Stochastic, uncovering their hidden gemstones and showing you how to use them like a seasoned pro. Ready to stage up your buying and selling recreation? Let's try this!
Technical evaluation has roots courting again to the 17th-century Dutch markets, however, it received prominence in the twentieth century with the improvement of charting techniques and signs.
Description:
Technical evaluation entails studying ancient market records, which include price and extent, to forecast destiny price movements. It specializes in styles, trends, and indicators to inform buying and selling decisions.
Importance:
Technical evaluation is vital for buyers to identify access and go-out factors, manage danger, and maximize earnings. It presents precious insights into market sentiment and allows buyers to make informed selections.
Advantages:
Some blessings of technical analysis include its simplicity, versatility throughout exceptional markets and timeframes, and its ability to complement other sorts of evaluation. It empowers traders with actionable records and complements their ability to navigate the complexities of the market.
2. Understanding Technical Analysis: Deciphering the Language of the Market JOIN NOW
Before we delve into the nitty-gritty details of oscillators, let's lay down the foundation with a short crash route on technical analysis. Think of it as getting to know the language of the market fluently.
What is Technical Analysis?
At its coronary heart, technical evaluation is all approximately reading the records of market information – suppose price actions and buying and selling volumes – to expect in which prices would possibly head within the future. It's like being a detective, piecing together clues from the beyond to assume what's coming next.
Reading Between the Lines
Imagine the marketplace as a massive puzzle, with each piece representing a chunk of statistics. Technical analysts are the puzzle solvers, interpreting patterns, trends, and alerts hidden within the chaos. It's all about spotting opportunities and making clever decisions based totally on what the data is telling us.

The Language of Patterns
Patterns are just like the vocabulary of technical analysis. They are available in all sizes and styles – from easy trends to complex formations – and each one tells a completely unique tale approximately the marketplace. By studying to understand these patterns, buyers can advantage of valuable insights into potential price actions.
Trendspotting
Trends are the spine of technical evaluation. They're just like the currents in the ocean, guiding the go with the flow of prices up or down. By identifying tendencies early on, investors can ride the wave and capitalize on profit opportunities.
Signals and Indicators
Think of indicators and signs as the site visitors' lighting fixtures of the marketplace. They provide treasured clues as to when to shop for, sell, or hold onto a function. From transferring averages to oscillators like RSI and MACD, those equipment assist traders navigate the twists and turns of the marketplace with self-belief.
Conclusion
So, there you have got it – a newbie's manual to the fascinating global of technical evaluation. By learning the art of analyzing the language of the marketplace, you'll be nicely geared up to make knowledgeable buying and selling selections and navigate the ever-converting landscape of finance like a pro. Ready to dive in? Let's get started out!
3. What are Oscillators? Unlocking the Secrets of Market Swings
Curious approximately those mysterious equipment called oscillators? Well, get prepared to find their secrets and techniques! Oscillators are like the weather forecasters of the marketplace, supporting us predict when conditions are ripe for an exchange.
Decoding Oscillators
Imagine oscillators as your personal marketplace radar, scanning for signs of trouble or possibility. They're a unique kind of technical indicator designed to identify when fees are stretched too skinny – both overbought or oversold – like a rubber band equipped to snap again into the region.
Boundaries and Ranges
Oscillators want to play within certain barriers, generally bouncing around between zero and 100 on their charts. It's like they may be dancing to the beat of the marketplace, transferring up and down in rhythm with charge adjustments. When they hit the intense ends of the variety, it's a signal that something massive is probably about to manifest.
Finding Balance
Think of oscillators because of the scales of justice for the market. They're continuously weighing the forces of buying and promoting, looking for that sensitive balance between bulls and bears. When one aspect receives too heavy, it's a clue that the tide is probably turning.
Reading the Signs
So, how do we recognize when an oscillator is attempting to tell us something? Look for the excessive stages – excessive or low – wherein the oscillator is pushing against the limits. It's like a warning signal flashing neon lights, alerting us to ability shifts inside the marketplace's mood.
The Power of Reversals
When an oscillator hits the excessive stages, it's like a pressure valve releasing steam. It shows that the market is probably due for a reversal – an exchange in the path that could suggest large possibilities for savvy investors.
Conclusion
Oscillators can also appear like mysterious creatures before everything, but after you understand their language, they become effective allies in your buying and selling adventure. By keeping an eye on these handy signs, you will be ready to navigate the United States and downs of the market with confidence. Ready to dive in and start deciphering those market swings? Let's try this!
4 - Relative Strength Index (RSI): Your Secret Weapon for Spotting Market Extremes
Ready to free up the power of the Relative Strength Index, or RSI? Buckle up, due to the fact this little gem is one of the freshest tools inside the buying and selling international, and it is about to become your new first-rate friend.
The RSI Demystified
Think of the RSI as your non-public market speedometer, constantly measuring the speed of rate actions. It's like having a radar gun for the stock marketplace, telling you whether matters are moving too rapidly or too slowly.
Spotting Extremes
Ever heard the saying "What goes up must come down"? Well, the RSI is your manual to knowing while that's about to manifest. When the RSI shoots above 70, it is like a pink flag waving inside the wind – a sign that prices might be getting a piece too warm. On the flip aspect, when the RSI dips underneath 30, it's like a flashing neon sign pronouncing "opportunity ahead" – a signal that fees can be due for a leap.
Reading the Signals
So, how do you recognize whilst paying attention to the RSI? Look for those magic numbers – 70 and 30 – in which the RSI crosses the road into overbought or oversold territory. It's like having an integrated alarm device for your trades, supporting you to stay in advance of the game.
Speed and Change
The RSI isn't just about where charges are – it's also about how fast they're transferring. By measuring each speed and trade, the RSI offers you an entire picture of market momentum, helping you are making smarter, extra-informed buying and selling decisions.
Your Trading Sidekick
With the RSI by your facet, you will never be caught off defend through market extremes again. Whether you are a seasoned seasoned or simply starting out, this accessible tool will help you navigate the American and downs of the market with self-assurance. So, what are you expecting? Begin bridling the power of the RSI and take your trading game to a higher level!
5. Mastering the Moving Average Convergence Divergence (MACD): Your Key to Riding Market Trends
Prepared to plunge into the field of the Moving Average Convergence Divergence or MACD? Prepare to be shocked, because this incredible asset is going to alter how you change.
Unveiling the MACD
Think of the MACD as your trusty compass within the tumultuous sea of the stock marketplace. It's like having a GPS for market tendencies, guiding you through the U.S.A.And downs readily.

Two Lines, One Mission
The MACD is made from two strains – the MACD line and the signal line. Together, they shape a dynamic duo, constantly reading market actions and signaling capacity changes in direction.
Bullish vs. Bearish Signals
When the MACD line crosses above the sign line, it's like an inexperienced light signaling an uptrend beforehand. Bulls have a good time as prices climb better, developing opportunities for earnings. On the flip feature, while the MACD line crosses underneath the sign line, it resembles a mindfulness signal blazing red - a sign that a downtrend can be not too far off. Bears sharpen their claws as costs dip decrease, ready to pounce on capacity opportunities.
Riding the Trend Waves
With the MACD as your guide, you will be using the waves of marketplace traits like a pro. Whether it's a bullish flood or a negative retreat, you will be equipped to gain by potential outcomes and explore the exciting bends in the road of the market with confidence.
Your Trading Navigator/Your Exchanging Pilot
All in all, what are you looking for? Now is the ideal time to saddle the strength of the MACD and take your trading game to a higher level. With its potential to become aware of trends and sign capability modifications en route, this versatile tool turns into your mystery weapon for fulfillment inside the international of buying and selling. Let's embark on this journey collectively and liberate the total capability of the MACD!
6. Uncovering the Stochastic Oscillator: Your Vital aspect for Riding Business sector Energy JOIN NOW
Is it safe to say that you are prepared to jump into the intriguing worldwide of the Stochastic Oscillator? Lock in, because of the reality this viable marker is going to arise as your new pleasant buddy inside the worldwide of exchanging.
Understanding the Stochastic Oscillator/Figuring out the Stochastic Oscillator
Consider the Stochastic Oscillator your energy finder, ceaselessly checking the market for signs and side effects of solidarity or point of concern. It's like having an integrated radar system, supporting you navigate the highs and lows of marketplace momentum without problems.
The %K and %D Lines
The Stochastic Oscillator is produced using two strains - the %K line and the %D line. Together, they shape a unique pair, providing prized bits of knowledge into commercial center elements and capacity shifts in force.
Spotting Overbought and Oversold Conditions
Like the RSI, the Stochastic Oscillator permits overbought and oversold conditions in the commercial center. When readings climb above eighty, it's like a caution sign flashing red – a signal that charges can be overheated and due for a pullback. Conversely, when readings drop under 20, it is like a green light signaling capacity buying opportunities beforehand.
Riding the Momentum Waves/Riding the Force Waves
With the Stochastic Oscillator by your feature, you'll ride the rushes of market forces like an ace. Whether it is a flood in purchasing pressure or a plunge in selling pressure, you'll be equipped to gain conceivable outcomes and settle on informed exchanging decisions.
Your Momentum Navigator/Your Energy Pilot
Anyway, what are you expecting? Now is the right time to tackle the strength of the Stochastic Oscillator and take your trading game to the ensuing level. With its capacity to recognize energy moves and see overbought or oversold circumstances, this adaptable gadget transforms into your unmistakable advantage for satisfaction inside the quick-paced universe of trading. How about we leave this experience altogether and deliver the general limit of the Stochastic Oscillator?

7. Mastering Oscillators: Tips for Trading Success
So, you have got your fingers on some effective oscillators – now what? It's time to discover ways to wield this equipment like a seasoned and grow to be a master trader. Here are a few basic yet powerful clues to assist you with freeing the general capacity of oscillators and taking your exchanging game higher than ever.
1. Practice Makes Perfect/Careful discipline brings about promising results
Just like learning any skill, becoming gifted in technical analysis and oscillators calls for practice – and lots of it! Set aside time every day to research charts, tweak settings, and have a look at how oscillators behave in one-of-a-kind marketplace situations. The more you practice, the more intuitive your buying and selling decisions become.
2. Combine and Conquer
Oscillators are effective on their own, but they are even stronger whilst mixed with different technical indicators. Experiment with pairing oscillators with shifting averages, trendlines, and extent evaluation to create a comprehensive trading strategy. Look for confluence among signs to grow the reliability of your buying and selling alerts and enhance your success fee.
3. Discipline is Key
One of the most important pitfalls for investors is letting feelings dictate their selections. Stay disciplined and persist with your buying and selling plan, following your indicators religiously. Avoid the temptation to deviate out of your approach primarily based on fear or greed. Remember, the indicators are there to guide your decisions – consider them and live the course.
4. Never Stop Learning
The economic markets are continuously evolving, so it is important to stay up to date with the brand new traits and trends in technical analysis. Make it an addiction to attend seminars, study books, and follow official trading blogs to increase your understanding and stay in advance of the curve. The extra you analyze, the higher prepared you'll be to navigate the ever-changing panorama of the market.
With those simple but effective recommendations, you will be well for your manner of getting to know oscillators and becoming a successful trader. So, what are you waiting for? Start imposing those techniques nowadays and watch your trading prowess leap!
Conclusion
In the end, the journey to becoming a remarkable trader is simply no walk in the park. It calls for willpower, perseverance, and deep information on technical evaluation and oscillators. But worry no longer, for with this gear in your arsenal, you can tip the scales of achievement for your preference.
Always do not forget that buying and selling isn't always just about crunching numbers; it is also approximately gaining knowledge of the psychological thing of the sport. Stay disciplined in your approach, keep your attention sharp, and in no way underestimate the energy of non-stop gaining knowledge.
So, as you embark on your trading journey, may additionally your charts be clean, your signals be sturdy, and your profits be abundant. Here's to glad trading and to the exciting adventures that lie ahead in the international of finance!
0 notes
Text
What role do oscillators play in consumer electronics?
Oscillators are like the heartbeat of consumer electronics. They're tiny components that generate repetitive signals, ensuring your devices work smoothly. Think of them as the conductor of an orchestra, keeping everything in perfect rhythm.
In consumer electronics, oscillators are crucial for keeping time in clocks, providing stable frequencies for radios and TVs, and even helping to regulate temperature in thermostats. They're versatile and found in a wide range of products, from smartphones to kitchen appliances.
0 notes
Text
Unraveling the Mystery of Falling Wedge Patterns in Technical Analysis
In the world of technical analysis, traders and investors are constantly on the lookout for patterns that can provide insights into potential price movements.
One such pattern that has captured the attention of market participants is the falling wedge. This pattern is revered for its predictive capabilities and its ability to signal potential trend reversals.
In this blog post, we will delve…
View On WordPress
#Apex#Breakout#Bullish Continuation Pattern#Chart Analysis#downtrend#falling wedge#Market Conditions#Momentum Shift#moving averages#oscillators#Price Consolidation#Price Target#Resistance Line#Support Line#technical analysis#trading signals#Trend Reversal#trendlines#Validation#Volatility
0 notes
Text
Roland GAIA 2 now available to demo in our London store | Juno Daily
The new hybrid synth features wavetable and virtual analogue oscillators, plus a Motional Pad to modulate sounds and morph between settings.
[embedded content]
Roland’s newly announced GAIA 2 synth has arrived in stock, and is now available to order online or to demo in our London store. The GAIA 2 features Roland’s new hybrid synth engine, mixing wavetable oscillators and virtual analogue…
View On WordPress
0 notes
Text
https://www.futureelectronics.com/p/electromechanical--timing-devices--oscillators/cb3lv-3c-50m000000-cts-5629860
Digital timing device, Epson crystal oscillators, crystal oscillator frequency
50MHz ±50ppm 50pF HCMOS/TTL 55% 3.3V 4-Pin SMD Oscillator
#CTS#CB3LV-3C-50M000000#Frequency Control & Timing Devices#Oscillators#digital timing device#Epson#crystal oscillator frequency#what is a timing device#transmitting data#timing gates#Bidirectional TVS#Transient voltage suppression diode
0 notes
Text
Hertz (unit)
Introduction
The hertz (Hz) is the unit of frequency in the International System of Units (SI). It is named after the German physicist Heinrich Hertz, who made significant contributions to the study of electromagnetism.
Definition
One hertz is defined as one cycle per second. In mathematical terms, if a periodic event occurs once every second, it has a frequency of 1 Hz.
$ 1 \text{ Hz} = 1…
View On WordPress
0 notes
Note
I swapped them around in a silly doodle

.
#Vasco! what have they done to you?!#he finally caught the skrunklies#it's contagious#or maybe there's something horribly wrong with the ambient pressure and he's not agreeing with it at all#it's jarring that (at least to me) both Machetes read as Machete they're the opposite ends of the Machete spectrum#his form oscillates between an exposed nerve and a unicorn I get it#but swapped Vasco is#a whole new mystery critter#actually he's kind of cute#I would take him home#give him a bath in the sink and feed him some grilled chicken maybe that'll make him feel more like himself#real Vasco is toasted to perfection this one looks burnt at the edges and raw in the middle#I love his little off-model sheep ear#couldn't even keep his glorious floppers poor boy#gift art#foilthepiglin#own characters#Machete#Vasco
2K notes
·
View notes
Text
OneInfini's online course on technical analysis and indicators teaches you the fundamentals of trading. Learn the basics of charting, develop technical analysis skills, and gain the confidence to make profitable trades in any market.
#technical analysis#charting#trading indicators#moving averages#candlestick charts#support and resistance#trend lines#momentum indicators#oscillators#trading strategies#trading psychology#risk management#stock market#forex market#cryptocurrency market#day trading#swing trading#long-term investing
1 note
·
View note
Link
#candlestickpatterns#forexmarketanalysis#Forextrading#momentumindicators#movingaverages#oscillators#supportandresistance#technicalindicators#tradingstrategies#trendanalysis
0 notes
Text

DIRECTOR'S NOTE • Nov. 2023
You can't go home. This play has a particular
care for and interest in its victims. The resident
inciting event is endless. tragedy is much more
concerned with footnotes than it is with gods.
well acquainted with what happens afterward,
storytellers claim they can't diverge from what's
written: resist. rage against what must be.
tell a story about war without talking
about love. survive its aftermath. fail
to find resolution. make this suffering
a home. There's no breaking this chain—
fate, as always, gets its way.
Poetry assembled from the program of an Oresteia production. Nov. 2023.
#p#analog#oscillating wildly between liking and hating this but you have to get the gunk out to get going again#the last line...the rest of the poem has to be REALLY solid for it to work and im. not sure it is. but its here lol#bad 'scan' quality too but i am too impatient to wait to get to a real scanner#what i do like about this one is the enjambment#i think its some of my best
5K notes
·
View notes
Text
Ceramic Crystal, through hole quartz crystals, Crystals, Oscillators
Crystal provider including quartz crystals, watch crystals and through hole quartz crystals. Also offers tuning fork crystal, through hole tuning fork, SMT low profile & surface mount crystals from Fox, Citizen, Abracon, Saronix, IQD and Hosonic.
0 notes
Last Seen Blogs

seabcrne
Child of the Sea

lekohatsu
Only a little Dreamer

latodrajacobs
Beautiful You

tatoov
Tato Velásquez

minmv
Minor Meléndez