#candlestickpatterns
Text
Candle Chart - Unveiling India's Stock Market | What Is Candlestick Chart? 🤔 | Complete Candlestick
youtube
#stockmarket#CandlestickChart#InvestingIndia#FinancialEducation#StockAnalysis#TradingStrategies#MarketTrends#StockMarketExplained#LearnWithUs#InvestmentTips#CandlestickPatterns#MarketAnalysis#Youtube
0 notes
Video
youtube
Heikin Ashi Mastery Elevate Your Trading Game with Powerful Strategies 2023
#youtube#youtube trending#HeikinAshiStrategies#TradingTechniques#CandlestickPatterns#DayTradingSuccess#TechnicalAnalysis#MarketInsights#TradingWisdom#ScalpingStrategies#ChartingTools#FinancialMarkets#TradeSmart#ProfitableTrading#CandlestickAnalysis#TechnicalIndicators
0 notes
Link
#BankNifty#BankNiftyAnalysis#BankNiftyIntradaytradinganalysis#candlestickpatterns#candlestickpatternsintrading#intradaytrading#NationalStockExchange#NationalStockExchangeofIndia#optionchainanalysis#optionchaindata#resistancelevel#Supportandresistancelevels#supportlevel
0 notes
Text
How to Read and Interpret Candlestick Charts
Unveiling the Secrets of Candlestick Chart Interpretation
By Amir Shayan
Candlestick charts are a fundamental tool in the world of financial trading. They provide crucial insights into the price movements of various assets, helping traders make informed decisions. Understanding how to read and interpret candlestick charts is a skill that can greatly enhance your trading acumen. In this article, we will delve into the intricacies of candlestick charts, unraveling their significance and guiding you through the process of deciphering their patterns.
The Language of Candlestick Charts
Candlestick charts originated in Japan centuries ago and have since become a cornerstone of technical analysis. Each candlestick represents a specific time frame, whether it's a minute, an hour, a day, or longer. The chart consists of individual candles, and the patterns they form can reveal potential trends, reversals, and price movements.
Anatomy of a Candlestick
A single candlestick consists of several key components: the body, the wick (or shadow), and sometimes the tail. The body represents the difference between the opening and closing prices during the given time frame. If the closing price is higher than the opening price, the body is typically colored or filled. Conversely, if the opening price is higher than the closing price, the body is usually empty or transparent.
The wick or shadow extends above and below the body, indicating the range between the highest and lowest prices during the time period. The tail, if present, extends from the body's top or bottom, signifying the range beyond the wick.
Common Candlestick Patterns
Doji: A Doji occurs when the opening and closing prices are very close or even identical. It suggests uncertainty in the market and a potential reversal.
Hammer and Hanging Man: These patterns have small bodies and a long lower tail. A Hammer appears after a downtrend and implies a potential bullish reversal, while a Hanging Man after an uptrend can indicate a bearish reversal.
Bullish and Bearish Engulfing: A Bullish Engulfing pattern occurs when a small bearish candle is followed by a larger bullish one. The reverse is the Bearish Engulfing pattern. These suggest a reversal of the current trend.
Morning Star and Evening Star: The Morning Star is a three-candle pattern featuring a large bearish candle, a small bearish or bullish one, and a large bullish one. It indicates a potential reversal from a downtrend. The Evening Star is the opposite, signaling a potential reversal from an uptrend.
Interpreting Candlestick Patterns
Candlestick patterns provide valuable information about market sentiment and potential price movements. For instance, a series of bullish candlesticks indicates a strong uptrend, while a succession of bearish ones suggests a downtrend. Reversal patterns, as the name suggests, may indicate an impending change in the current trend.
It's important to note that while candlestick patterns can offer insights into market movements, they should be considered alongside other technical and fundamental analysis tools for a comprehensive understanding.
Conclusion
Candlestick charts are a visual representation of market dynamics, revealing the battle between buyers and sellers. By understanding the patterns they form, traders can gain a deeper understanding of market sentiment and potential price movements. However, like any tool, candlestick charts are most effective when used in conjunction with other forms of analysis.
Learning to read and interpret candlestick charts takes time and practice, but it's a skill that can greatly improve your trading decisions. As you become more proficient in deciphering these patterns, you'll be better equipped to navigate the complexities of financial markets and make informed choices that align with your trading strategy.
Read the full article
#candlestickcharts#candlestickpatterns#Chartinterpretation#financialmarkets#marketanalysis#marketsentiment#PriceMovements#Technicalanalysis#Tradingpatterns#tradingstrategy
0 notes
Video
youtube
February 3, 2023 | Weekly market update S&P 500 (ES) futures & Projectio...
#youtube#usa#stockmarket#spx#spy#esfutures#es#weekly#market#analysis#video#marketprofile#candlestickpatterns#candlesticks#candle stick patterns
0 notes
Photo
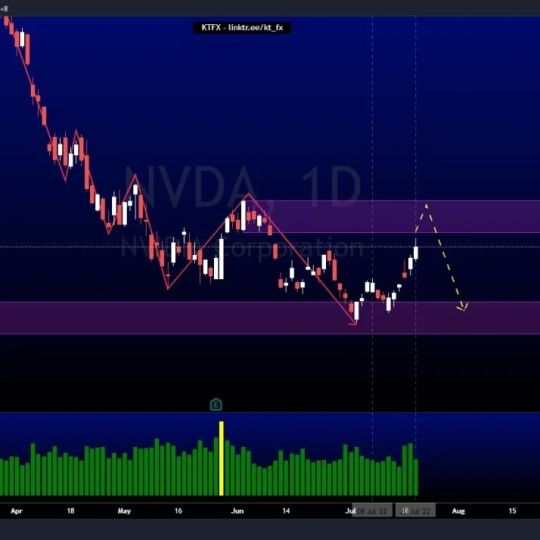
You can find out more about me here: linktr.ee/kt_fx $NVIDIA Corp(NVDA)$ Price is playing out exactly as analyzed last week. I'm expecting the price to hit the target at the bearish POI at 181.22. From there, we could see a retracement downside, or to continue an uptrend. $NIO Inc.(NIO)$ Price is playing out exactly as analyzed last week. Price is on a downtrend, expecting price to hit the bullish POI before we make any decision. We could see price taking out the sell-side liquidity to continue with the downtrend. $AMD(AMD)$ Price is also playing out exactly as expected last week. Price rallied from where I called, hitting the first target at the bearish POI at 88.22. Our second potential take profit is at the higher bearish POI at 92.03. We could potentially see a sell-off from the higher bearish POI. We shall see how price reacts to the level. Let me know if you agree and what you think. Like, share, and comment if you're holding any one of these companies! #stocktrading #stressfreetrading #tradingplan #tradingpsychology #stockstrading #trader #investment #success #investor #candlestickpatterns #learntotrade #tradingmentor #daytrading #stocks #stockstowatch #nvda #nio #amd https://www.instagram.com/p/CgQUQGPPNa5/?igshid=NGJjMDIxMWI=
#stocktrading#stressfreetrading#tradingplan#tradingpsychology#stockstrading#trader#investment#success#investor#candlestickpatterns#learntotrade#tradingmentor#daytrading#stocks#stockstowatch#nvda#nio#amd
0 notes
Link
#candlestickpatterns#educationalplatforms#financialnews#learningstrategies#onlineresources#riskmanagement#simulatedtrading#Stocktradingandinvestingfromhome#technicalanalysis#tradingstrategies
0 notes
Text
How to Read and Interpret Candlestick Charts

Unveiling the Secrets of Candlestick Chart Interpretation
By Amir Shayan
Candlestick charts are a fundamental tool in the world of financial trading. They provide crucial insights into the price movements of various assets, helping traders make informed decisions. Understanding how to read and interpret candlestick charts is a skill that can greatly enhance your trading acumen. In this article, we will delve into the intricacies of candlestick charts, unraveling their significance and guiding you through the process of deciphering their patterns.
The Language of Candlestick Charts
Candlestick charts originated in Japan centuries ago and have since become a cornerstone of technical analysis. Each candlestick represents a specific time frame, whether it's a minute, an hour, a day, or longer. The chart consists of individual candles, and the patterns they form can reveal potential trends, reversals, and price movements.
Anatomy of a Candlestick
A single candlestick consists of several key components: the body, the wick (or shadow), and sometimes the tail. The body represents the difference between the opening and closing prices during the given time frame. If the closing price is higher than the opening price, the body is typically colored or filled. Conversely, if the opening price is higher than the closing price, the body is usually empty or transparent.
The wick or shadow extends above and below the body, indicating the range between the highest and lowest prices during the time period. The tail, if present, extends from the body's top or bottom, signifying the range beyond the wick.
Common Candlestick Patterns
Doji: A Doji occurs when the opening and closing prices are very close or even identical. It suggests uncertainty in the market and a potential reversal.
Hammer and Hanging Man: These patterns have small bodies and a long lower tail. A Hammer appears after a downtrend and implies a potential bullish reversal, while a Hanging Man after an uptrend can indicate a bearish reversal.
Bullish and Bearish Engulfing: A Bullish Engulfing pattern occurs when a small bearish candle is followed by a larger bullish one. The reverse is the Bearish Engulfing pattern. These suggest a reversal of the current trend.
Morning Star and Evening Star: The Morning Star is a three-candle pattern featuring a large bearish candle, a small bearish or bullish one, and a large bullish one. It indicates a potential reversal from a downtrend. The Evening Star is the opposite, signaling a potential reversal from an uptrend.
Interpreting Candlestick Patterns
Candlestick patterns provide valuable information about market sentiment and potential price movements. For instance, a series of bullish candlesticks indicates a strong uptrend, while a succession of bearish ones suggests a downtrend. Reversal patterns, as the name suggests, may indicate an impending change in the current trend.
It's important to note that while candlestick patterns can offer insights into market movements, they should be considered alongside other technical and fundamental analysis tools for a comprehensive understanding.
Conclusion
Candlestick charts are a visual representation of market dynamics, revealing the battle between buyers and sellers. By understanding the patterns they form, traders can gain a deeper understanding of market sentiment and potential price movements. However, like any tool, candlestick charts are most effective when used in conjunction with other forms of analysis.
Learning to read and interpret candlestick charts takes time and practice, but it's a skill that can greatly improve your trading decisions. As you become more proficient in deciphering these patterns, you'll be better equipped to navigate the complexities of financial markets and make informed choices that align with your trading strategy.
Read the full article
#candlestickcharts#candlestickpatterns#Chartinterpretation#financialmarkets#marketanalysis#marketsentiment#PriceMovements#Technicalanalysis#Tradingpatterns#tradingstrategy
0 notes
Photo

Forex Trading Chart Patterns #supportlevel #market #forex #resistancelevel #forexstrategy #tradingview #forexgroup #forexeducation #forexmoney #crypto #candlestickpattern #cryptocurrency #supplyzone #forexsignalservice #forexanalysis #forextrader #forextraders #forexhelp #trader #priceaction #demandzone #supply #forextrading #demand #forexsignals #resistancelevels #foryoupage #foryou #trending #trend (at Dubai, United Arab Emirates - UAE) https://www.instagram.com/p/Cprkl5yoMU-/?igshid=NGJjMDIxMWI=
#supportlevel#market#forex#resistancelevel#forexstrategy#tradingview#forexgroup#forexeducation#forexmoney#crypto#candlestickpattern#cryptocurrency#supplyzone#forexsignalservice#forexanalysis#forextrader#forextraders#forexhelp#trader#priceaction#demandzone#supply#forextrading#demand#forexsignals#resistancelevels#foryoupage#foryou#trending#trend
0 notes
Photo

Excited to share this item from my #etsy shop: Fire King Loaf Pan Candle Stick Pattern #white #glass #bakeware #vintage #fireking #anchorhocking #firekingloafpan #candlestickpattern #ourtimewarp #etsyseller #etsyshop #etsyvintage https://etsy.me/3ZoIpUM https://www.instagram.com/p/CpQyySSORya/?igshid=NGJjMDIxMWI=
#etsy#white#glass#bakeware#vintage#fireking#anchorhocking#firekingloafpan#candlestickpattern#ourtimewarp#etsyseller#etsyshop#etsyvintage
0 notes
Text
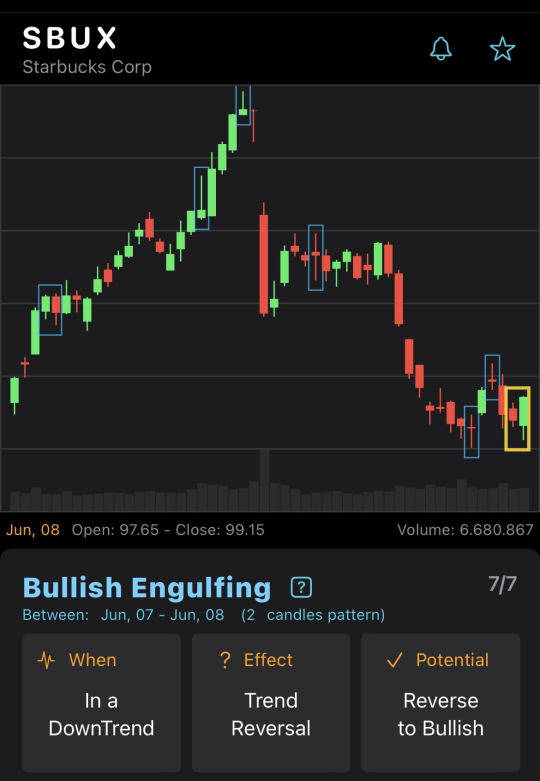
Bullish Engulfing on SBUX chart
BullishEngulfing CandleStickPattern on SBUX end-of-day chart on Jun, 08. Potential reverse to bullish.
6 notes
·
View notes
Text
youtube
Are you ready to level up your trading game and catch those big moves in the market? Join us in this illuminating video where we break down the art of "Trading Gaps" and provide a comprehensive explanation of the Three Gaps & Hanging Men pattern.
1) Gap in an Uptrend:
Unlock the potential of spotting gaps in an uptrend, a vital skill for seizing opportunities in rising markets. We'll show you how to make the most of this pattern to enhance your trading strategy.
2) Gap and Volume:
Trading volume is a crucial indicator. Find out how gaps and volume work together to help you interpret market trends and make informed trading decisions.
3) Gap as Support:
Discover how gaps can serve as robust support levels, bolstering your trading confidence even during market turbulence.
4) Gap in a Congestion Zone:
Congestion zones can be perplexing, but when a gap appears, it brings clarity. Learn how gaps can be a guiding light in navigating these complex market conditions.
5) Gap as Extra Confirmation:
When in doubt, seek additional confirmation. We'll explain how gaps can provide that extra layer of certainty, reinforcing your trading choices.
6) Gap in a Downtrend:
Explore the role of gaps in downtrends and how they can help you make sense of bearish market movements.
7) Gap as Resistance:
Resistance levels are pivotal in trading. Understand how gaps can act as formidable barriers, shaping price dynamics and affecting your trading strategy.
Join us for a deep dive into these critical trading concepts and candlestick patterns that can help you catch those big market moves. Don't forget to like, subscribe, and hit the notification bell to stay updated with our latest trading insights!
For more information and resources, visit our coaching page: https://tradegenie.com/coaching/.
#CandlestickPatterns #SupportAndResistance #MarketTrends #CandlestickPatterns #SupportAndResistance #ChartAnalysis
Follow us on
https://www.linkedin.com/company/tradegenie-inc
Head Office:
Trade Genie Inc.
315 South Coast Hwy 101,
Encinitas, CA 92024
Phone Number: 212-930-2245
Email: [email protected]
0 notes
Text

XAU/USD Analysis - Market Outlook
#FederalReserve #Inflation #ConsumerSpending #EconomicData #Forextrading #forexmarket #forexstrategy #goldanalysis #trading #xauusd #xauusdtrading #xauusdstrategy #currencytrading #currencypairs #chartanalysis #technicalanalysis #fundamentalanalysis #dailyanalysis #dollar #usd #Nysession #NY #NYsession #NYSE #Stockmarket #stockexchange #candlestickpattern #patterns #powell #ConsumerSpending #economicdata #FederalReserve #Inflation
#forex analysis#forex education#for example#forex online trading#forexnews#forexstrategy#forexscalping#forexsuccess#forextips#forexmarket
0 notes
Link
#candlestickpatterns#financialliteracy#informeddecision-making#marketcorrections#marketvolatility#riskmanagement#startinthestockmarket#stockmarketopportunities#technicalanalysis
0 notes
Link
#candlestickpatterns#forexmarketanalysis#Forextrading#momentumindicators#movingaverages#oscillators#supportandresistance#technicalindicators#tradingstrategies#trendanalysis
0 notes
Photo

Forex Trading Support Level #supportlevel #market #forex #resistancelevel #forexstrategy #tradingview #forexgroup #forexeducation #forexmoney #crypto #candlestickpattern #cryptocurrency #forexmarket #forexlife #supplyzone #forexlifestyle #forexsignalservice #forexanalysis #forextrader #forextraders #forexhelp #trader #priceaction #demandzone #supply #forextrading #demand #forexsignals #resistancelevels (at Dubai, United Arab Emirates - UAE) https://www.instagram.com/p/CpIinZ9yhFi/?igshid=NGJjMDIxMWI=
#supportlevel#market#forex#resistancelevel#forexstrategy#tradingview#forexgroup#forexeducation#forexmoney#crypto#candlestickpattern#cryptocurrency#forexmarket#forexlife#supplyzone#forexlifestyle#forexsignalservice#forexanalysis#forextrader#forextraders#forexhelp#trader#priceaction#demandzone#supply#forextrading#demand#forexsignals#resistancelevels
0 notes
Last Seen Blogs

lordcrash4225-blog
My life....

its-idealworld
Jurnalul unei fete timide

summitonhorizon
Untitled
mr-not-null
-Null-

dallapartedegliultimi-last
Dimmichenonvalgonienteepoiabbracciami