#radiometer
Explore tagged Tumblr posts
Visit Tumblr Blog
Explore Tumblr blogs with no restrictions, modern design and the best experience.
Last Seen Tumblr Blogs


Fun Fact
The total number of visits Tumblr.com received during January 2021 is 327 million.
Text

This is from the June 1957 issue of Popular Science. I did not know that Disneyland made these things, but they evidently did.

“What makes this radiometer turn? Light does it. The sun does it. A glowing cigarette does it.”
3 notes
·
View notes
Text
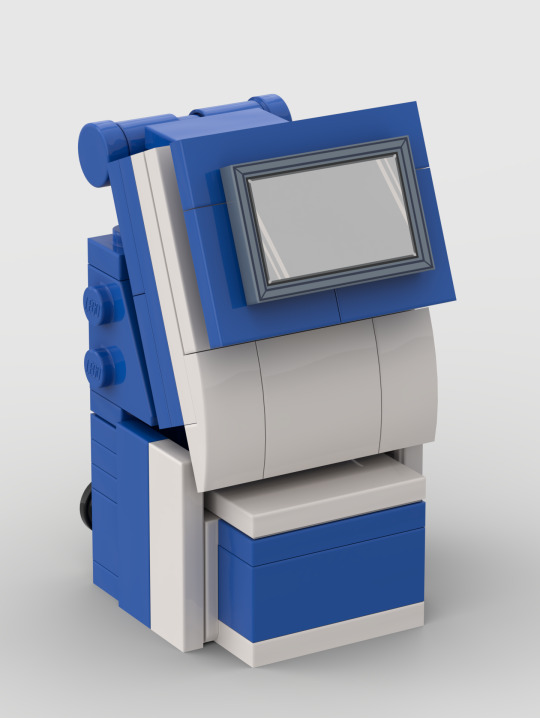
#lego moc#in-vitro diagnostics#ABL90 Flex Plus™#Radiometer#medical device#Studio 2.0#Blood gas analysis
2 notes
·
View notes
Text
𝗗𝗜𝗦𝗔𝗦𝗧𝗘𝗥 𝗔𝗦 𝗦𝗘𝗘𝗡 𝗙𝗥𝗢𝗠 𝗦𝗣𝗔𝗖𝗘: 𝗠𝗬𝗔𝗡𝗠𝗔𝗥 𝗧𝗢𝗪𝗡𝗦 𝗚𝗢𝗡𝗘 𝗗𝗔𝗥𝗞 𝗔𝗙𝗧𝗘𝗥 𝗧𝗛𝗘 𝗠𝗔𝗚𝗡𝗜𝗧𝗨𝗗𝗘 𝟳.𝟳 𝗤𝗨𝗔𝗞𝗘

Here are two satellite snapshots of the nighttime lights in Myanmar and neighboring countries: one from March 27 and the other from the night after the devastating earthquake on 28 March 2025.
The stark difference reveals widespread blackouts across Myanmar, including its capital, Naypyidaw.
The Magnitude 7.7 earthquake near Mandalay, Myanmar, caused massive destruction in the country and even affected even the neighboring countries.
To date, the death toll from the said earthquake already surpassed 1,000, according to the Military Junta.
The strong shaking brought down several structures and caused massive blackouts across Myanmar, with its full extent as seen from space by NASA’s Visible Infrared Imaging Radiometer Suite (VIIRS).
Satellite imagery plays a vital role in disaster response, offering a clear view of the damage and helping authorities and humanitarian organizations mobilize resources more efficiently.
#myanmar#thailand#earthquake#magnitude 7.7#satellite imagery#blackout#Naypyidaw#NASA#Visible Infrared Imaging Radiometer Suite (VIIRS)#death toll#disaster response#Mandalay
38 notes
·
View notes
Text
Scientists torturing backronyms/acronyms happens a lot, actually (see my tags for examples)
Backronyms
Physicists suck at naming things (I can say this because I'm a MechE and I have had to deal with so many physicists), but occasionally they have a stroke of brilliance. Like, a friend of mine worked on a dark matter detector called DarkSide. That's so goofy that it wraps back around to good.
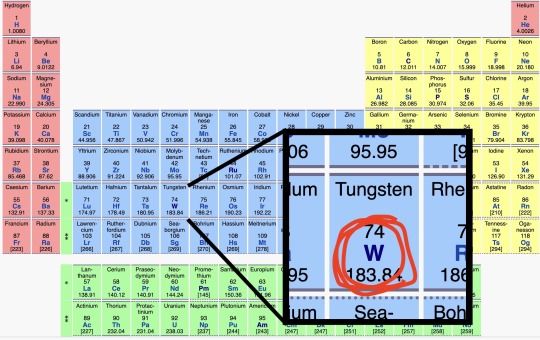
Anyway, there's this superconducting fusion reactor in france called WEST. It's notable for having first-wall shielding tiles (the innermost surface of the vacuum chamber, directly facing the fusion plasma) entirely made of tungsten.
There are a lot of materials used for plasma-facing components – tungsten, molybdenum, graphite, beryllium, various composites and combinations of the above – but it's pretty rare for a reactor to go full tungsten. It can take extremely high temperatures, but it's brittle and expensive, and "high-Z" (high molecular weight) impurities in the plasma cause their own issues. So, the main purpose of WEST is to investigate the viability of an all-tungsten first wall and divertor.
To that end, they tortured an acronym until they got it to work:
Tungsten Environment in Steady-state Tokamak
Or "WEST"
Get it?
GEW IW??
#let me name a few from mars-related things in order of least to most ridiculous:#one of the least bad ones: Mars Atmosphere and Volatile EvolutioN (MAVEN)#INterior exploration using Seismic Investigations Geodesy and Heat Transport (InSight)#ESCApe and Plasma Acceleration and Dynamics Explorer (ESCAPADE) (they really used 67% of the whole word there huh)#MArs RadIation environment Experiment (MARIE) (radiation detector on Mars Odyssey)#TElescopic Nadir imager for GeOmOrphology (TENGOO) (a camera on MMX)#Mars-moon Exploration with GAmma rays and NEutrons (MEGANE) (spectrometer on MMX) (MMX team sure loves destroying backronyms)#Optical RadiOmeter composed of CHromatic Imagers (OROCHI) (could you guess it's MMX again?)#that's all I can find off the top of my head but here please be as tortured as I am about this#EDIT: I FORGOT TO MENTION SCHIAPARELLI LANDER'S OFFICIAL NAME#ExoMars EDM#EDM standing for EDL Demonstrator Module#EDL standing for Entry Descent and Landing#they shoved a whole-ass acronym in their acronym
978 notes
·
View notes
Text
Mighty MURI brings the heat to test new longwave infrared radiometer
NASA’s new Multiband Uncooled Radiometer Instrument (MURI) features a novel bolometer that detects infrared radiation without a cryogenic cooler, greatly reducing the cost and complexity of dispatching infrared radiometers into low-Earth orbit. from NASA https://ift.tt/yegTZvb
0 notes
Text

14 November 2024
Nuclear chem labs are usually really boring - to be safe, these samples can't be wildly radioactive, so measurements take ages - but this one was fun. Lab partner and I put a big piece of granite under the probe and the radiometer started clicking like crazy! We actually had to readjust the measuring range, it was so fun to see. Granite can be naturally radioactive! Then we measured spent nuclear fuel and the radiometer went almost dead silent (save for the background radiation of course) which was also cool. Spent fuel indeed!
#this is like#neither studyblr ish nor particularly educational but i still wanted to share :3#mine#op#studyblr#chemblr#chemistry#stemblr
60 notes
·
View notes
Video
youtube
2024 May 19
Jupiter Diving Animated Video Credit: NASA, JPL-Caltech, SwRI, MSSS, Gerald Eichstadt, Justin Cowart
Explanation: Take this simulated plunge and dive into the upper atmosphere of Jupiter, the Solar System's ruling gas giant. The awesome animation is based on image data from JunoCam, and the microwave radiometer on board the Jupiter-orbiting Juno spacecraft. Your view will start about 3,000 kilometers above the southern Jovian cloud tops, and you can track your progress on the display at the left. As altitude decreases, temperature increases while you dive deeper at the location of Jupiter's famous Great Red Spot. In fact, Juno data indicates the Great Red Spot, the Solar System's largest storm system, penetrates some 300 kilometers into the giant planet's atmosphere. For comparison, the deepest point for planet Earth's oceans is just under 11 kilometers down. Don't worry though, you'll fly back out again.
∞ Source: apod.nasa.gov/apod/ap240519.html
54 notes
·
View notes
Text

F-15D Eagle Spotted with Unusual Infrared Measurement Pod
Stefano D'Urso
F-15D IR pod
The pod appears to be previously unseen but closely resembles the Airborne Turret Infrared Measurement System III (ATIMS III), which is used to perform airborne IR signature measurements.
A U.S. Air Force F-15D has been recently spotted flying in a very unusual configuration, usually seen only for very specific tests. In fact, the aircraft was carrying on its station #2, instead of the usual external fuel tank, what appears to be a large InfraRed pod.
The pod appears to be previously unseen but closely resembles the Airborne Turret Infrared Measurement System III (ATIMS III), which is used to perform airborne IR signature measurements.The IR-measuring podsATIMS IIIThe other pods
The photos, kindly shared with us by aviation photographer @arizona_planespotter, shows the aircraft, sporting the markings of the 144th Fighter Wing from Fresno Air National Guard Base, California, taking off from Morris ANGB in Tucson, Arizona, together with an F-15C. The two fighters apparently took part in a mission with local F-16s.
Upon closer inspection, the single-seater Eagle appears to be aircraft 83-0026, which sports on its tail the markings of the Air National Guard/Air Force Reserve Test Center. The unit is based at Morris ANGB and primarily supports F-16 operational flight program (OFP) testing, although it is tasked also with testing of other aircraft.
The large pod, which is half the length of the F-15’s external fuel tank, appears to be equipped with a ball sensor turret in the front. While some argued this might be a prototype of a directed energy weapon, the most plausible identification is an infrared measurement pod which is usually carried by twin-seater F-15Ds.

The F-15D with the unknown pod takes off from Morris ANGB. (Image credit: @arizona_planespotter)
In fact, the OT- and ET-marked aircraft are able to employ a range of highly specialized pods to accurately measure infrared signatures while airborne. This capability is usually employed during the development of IR seekers or sensors, as well as IR countermeasures.
We reviewed the available imagery of the known pod, but we were not able to find a 100% match, given the nature of these pods. While the unknown pod shares similarities with the SARIS and SATIRS pods, the closest match is the ATIMS III pod, although there are some differences.
The overall shape and dimensions of the two pods appear to be the same, however there are some differences in the sensor turret and some fairings on the body of the pod. We should note that the most recent info about the pod dates back to 2020, so we cannot exclude the possibility of a newer variant.
The IR-measuring pods
According to The War Zone, which published in 2020 an in-depth report about the unusual pods, both the Air Force and Navy use these specialized pods. While the Navy’s pods, usually seen on twin-seater F/A-18s, are also used by F-15Ds, the Air Force’s ones appear to be exclusive to the F-15D.
The choice of the F/A-18 and F-15 is due to their ability to carry large and heavy loads. The latter has been particularly used throughout the years to carry outsized loads during testing and operational missions.
At the time of the 2020 report, Naval Air Systems Command (NAVAIR) maintained two podded systems, the Airborne Turret Infrared Measurement System III (ATIMS III) and the Threat Infrared Generic Emulation Radiometer (TIGER). Four more pods are available for the Air Force, with 96th Test Wing employing the Beam Approach Seeker Evaluation System (BASES), the Calibrated IR/visible/UV Ground and Airborne Radiometric Spectrometer (CIGARS), the Supersonic Airborne Tri-Gimbal Infrared System (SATIRS), and the Spectral/Spatial Airborne Radiometric Infrared System (SARIS).

The ATIMS III pod (top) and the unknown pod (bottom). (Image credit: The Aviationist using photos by Brian Lockett/Goleta Air And Space Museum and @arizona_planespotter)
ATIMS III
ATIMS III has been defined in 2020 as the latest generation of a system that dates back to at least the 1970s. The system was originally integrated aboard the A-3 Skywarrior, before being later developed into a podded variant, the ATIMS II, employed by the F-4 Phantom II.
The system, which allowed greater flexibility and more ease of use compared to the original one, had an articulating turret with various cameras and sensors installed that a single operator could point at the desired target. Today’s ATIMS III was acquired in the 1980s and offers even greater capability.
The pod’s sensor turret can hold up to four different infrared seeker types at once. The system is also equipped with one middle wavelength infrared (MWIR) imager and three visual spectrum video cameras, as well as a laser rangefinder. This allows to collect a multitude of data from multiple sensors at the same time.
The available photos show that the pod can be installed either with the turret facing forward or facing backwards, depending on the test’s requirements. TWZ reported that the pod’s design is highly modular and adaptable and features a digital data recording system.
The report included a mention of a statement from Ampex Data Systems Corporation which provided solid-state recorders to capture the full spectrum of infrared data measured by the pod as part of an upgrade program. According to the statement, which uses the alternate Airborne Infrared Countermeasure Evaluation System (AICES) name, the pod can possibly transmit collected data to the ground via datalink.

The F-15s returning to Morris ANGB. (Image credit: @arizona_planespotter)
The other pods
The second pod operated by the Navy is the Threat Infrared Generic Emulation Radiometer (TIGER), which is designed for more general aerial infrared signature measurement of fixed-wing and rotary-wing aircraft, as well as decoy flares. TIGER carries three MWIR cameras and a long-wavelength infrared (LWIR) camera, in addition to a separate infrared tracking camera and an MWIR spectrometer, along with three visual spectrum video cameras and a laser rangefinder.
TWZ reported that the spectrometer allows to verify how the infrared radiation from the test subjects interacts with the surrounding environment, enabling the pod to gather data on an object’s temperature, how that heat is distributed and how the resulting infrared signature might fluctuate under different environmental conditions and at extended distances.
Similarly to ATIMS III, the pod can be carried with the turret either facing forward or backwards. TIGER is usually seen on F/A-18s, however there are instances when it was employed by F-15s, sometimes together with ATIMS III in the same flight.
Another pod is the Spectral/Spatial Airborne Radiometric Infrared System (SARIS), focused on infrared spectroscopy. More specifically, a scientific article published online mentions that SARIS uses an Imaging Fourier Transform Spectrometer (IFTS), which permits the determination of the surface temperatures of distant objects and, combined with imaging capability, allows rapid temperature mapping.
The document says that SARIS, first delivered to Eglin AFB in 2003, is used to characterize infrared targets, such as aircraft, missiles and flares, from the air. The pod is equipped with a co-registered, high-definition infrared camera and two internal blackbody sources for performing in-flight radio-metric calibration.
There are limited freely available details about the BASES, CIGARS, and SATIRS pods, but they are understood to have general capabilities very similar to those of ATIMS III and TIGER.
Thanks again to @arizona_planespotter for the photos he sent us! Make sure to follow him on Instagram for more!
@The Aviationist.com
22 notes
·
View notes
Text

Radio Telescopes and Radiometers
188 notes
·
View notes
Text

Blooming British Isles
Waters off the British Isles sprang to life with colorful swirls in early April 2025. The phenomenon commonly occurs in these North Atlantic waters in spring, but the view from orbit demands the cooperation of clouds.
Clouds stayed well offshore across the archipelago on April 7, 2025. That afternoon, the VIIRS (Visible Infrared Imaging Radiometer Suite) on the Suomi NPP satellite passed over the region and captured this striking image of the waters around the United Kingdom and Ireland.
Some of the colorful swirls, especially those close to shore, are likely due to sediment and other materials suspended in the water. Sediments are carried to sea by large rivers such as the Severn and get churned up from the seafloor by strong currents and waves. Satellite-based research has shown that in the Irish Sea, these mineral particles can exhibit complex spatial and seasonal patterns.
By spring, though, it’s likely that some of the colorful appearance across the region’s waters is due to phytoplankton—tiny plant-like organisms floating in the ocean. Under the right conditions, their populations explode into “blooms” that can span thousands of square kilometers of the ocean’s surface, making them visible from space. In this scene, the bloom in the North Sea appears to stretch several hundred kilometers offshore. The milkier, lighter-colored waters usually indicate the presence of coccolithophores, while greener areas often consist of diatoms.
Like elsewhere in the world’s oceans, phytoplankton around the British Isles feed the copepods and other plankton and fish that become food for even larger marine animals. However, a 2023 study of phytoplankton in the northeastern Atlantic Ocean showed that many of the region’s phytoplankton communities are changing—increasing in the North Sea but generally decreasing farther offshore—with possible implications for the food web.
NASA Earth Observatory image by Wanmei Liang, using VIIRS data from NASA EOSDIS LANCE, GIBS/Worldview, and the Suomi National Polar-orbiting Partnership. Story by Kathryn Hansen.
6 notes
·
View notes
Text
2024 May 19
Jupiter Diving
Animated Video Credit: NASA, JPL-Caltech, SwRI, MSSS, Gerald Eichstadt, Justin Cowart
Explanation: Take this simulated plunge and dive into the upper atmosphere of Jupiter, the Solar System's ruling gas giant. The awesome animation is based on image data from JunoCam, and the microwave radiometer on board the Jupiter-orbiting Juno spacecraft. Your view will start about 3,000 kilometers above the southern Jovian cloud tops, and you can track your progress on the display at the left. As altitude decreases, temperature increases while you dive deeper at the location of Jupiter's famous Great Red Spot. In fact, Juno data indicates the Great Red Spot, the Solar System's largest storm system, penetrates some 300 kilometers into the giant planet's atmosphere. For comparison, the deepest point for planet Earth's oceans is just under 11 kilometers down. Don't worry though, you'll fly back out again.
Authors & editors: Robert Nemiroff (MTU) & Jerry Bonnell (UMCP)
26 notes
·
View notes
Text
Flying up to the cracks in the sky with a Crookes radiometer to see if more light is leaking out than leaking in by checking the direction of rotation. I come back down to tell them that the light is leaking out, because it's spinning the wrong way round—which the physicists tell me is physically impossible. Ah well, a gram of evidence is worth a ton of theory
7 notes
·
View notes
Photo

Descent Panorama of Saturns Titan
Credits: ESA, NASA, DescentImager/Spectral Radiometer Team, LPL
22 notes
·
View notes
Text


"Jim using the Crookes radiometer to find the Franconium discovers the body of Renard and with a glowing finger"
"The Night of the Glowing Corpse"
(Season 1 Episode 7)
(Part 1)
#robert conrad#james west#the wild wild west#the wild wild west tv#jim west#the-wild-wild-west#twww#www#tww#wild wild west#The Night of the Glowing Corpse#TNOT Glowing Corpse
9 notes
·
View notes
Text
The chill is gone
Arctic sea ice cover retreated rapidly in July 2024, pushing the daily ice extent at the end of the month to the third lowest in the 46-year satellite record. Extensive low-concentration areas of sea ice are found in the Beaufort and East Siberian Seas, reaching 85 degrees North. In the Southern Ocean, sea ice is nearing the extreme low record extent set just last year, caused mostly by a large ice-free area in the southwestern Indian Ocean. As a result, global sea ice extent is at record lows for this time of year.
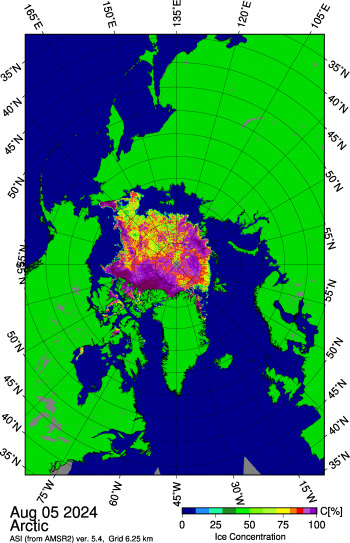
Figure 1c. This image from the Japan Aerospace Exploration Agency (JAXA) Advanced Microwave Scanning Radiometer 2 (AMSR2) shows sea ice concentration in the Arctic Ocean on August 5, 2024, highlighting areas of low concentration ice stretching north from the Beaufort and East Siberian Seas, and north of Greenland.
Credit: Japan Aerospace Exploration Agency, courtesy University of Bremen
Overview of conditions
Arctic sea ice extent averaged for July 2024 was 7.89 million square kilometers (3.05 million square miles), the sixth lowest in the 46-year passive microwave satellite record (Figure 1a and 1b). As of August 1, daily sea ice extent is third lowest behind 2019 and 2020, and just below 2012, the record low year. The July sea ice extent was 1.58 million square kilometers (610,000 square miles) below the 1981 to 2010 average and 600,000 square kilometers (232,000 square miles) above 2020, the record low July.
Ice loss during the month was greatest in the Kara and East Siberian Seas, Baffin Bay, Hudson Bay, and the Canadian Archipelago. Extensive low-concentration areas of sea ice are found in the Beaufort and East Siberian Seas (Figure 1c). A small patch of ice remains in western Hudson Bay, unusual for this time of year. There is still sea ice in both the northern and southern Northwest Passage routes according to passive microwave satellite data. On the Siberian side, the unusually packed area of sea ice south of Wrangel Island remains. Note that icebreakers and ice-capable liquefied natural gas (LNG) carriers routinely traverse the Northern Sea route along the Russian coast even with fairly thick sea ice.
Arctic sea ice retreat in July proceeded at a pace of 113,000 square kilometers (44,000 square miles) per day, faster than the 1981 to 2010 average pace of 87,000 square kilometers (34,000 square miles) per day and only slightly slower than the record pace of 117,000 square kilometers (45,000 square miles) per day set in 2020.
Conditions in context
Air temperatures at the 925 hPa level (approximately 2,500 feet above the surface) were near average overall, with several areas slightly below average. Relatively warm conditions prevailed over the Barents Sea with temperatures 2 to 3 degrees Celsius (4 to 5 degrees Fahrenheit) above average. In the Kara Sea, temperatures were only 1 degree Celsius (2 degrees Fahrenheit) above average. Below average temperatures persisted in a wide swath extending from the East Siberian Sea, over the Beaufort Sea, and onto the Canadian Archipelago and northern Labrador with temperatures 2 degrees Celsius (4 degrees Fahrenheit) below average.
July featured a large area of low sea level pressure centered over Greenland and the Canadian Archipelago, but covering much of the Arctic Ocean.
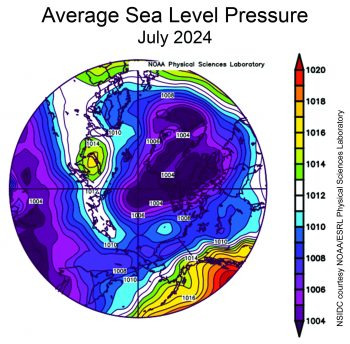
Figure 2b. This plot shows average sea level pressure in the Arctic in millibars for July 2024. Yellows and reds indicate high air pressure; blues and purples indicate low pressure.
Credit: NSIDC courtesy NOAA Earth System Research Laboratory Physical Sciences Laboratory
To continue reading click here
4 notes
·
View notes
Text
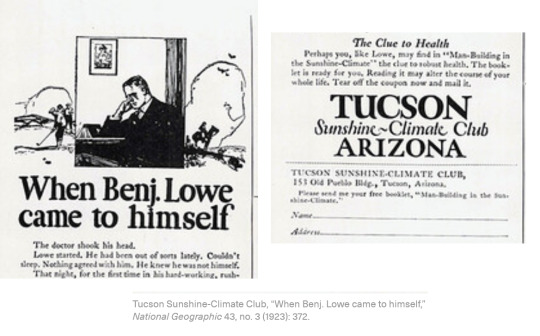
In the March 1923 issue of National Geographic, a sketch of a tired-looking businessman invites the reader to the Tucson Sunshine-Climate Club. In the accompanying text, Benj. Lowe -- the archetype of the tired, busy, urban, white businessman -- attempts to coax all the other Benj. Lowes out there on the East Coast to recover from their unhealthy lifestyles by spending some time in Tucson, Arizona:
That night, for the first time in his hard-working, rushing life, Lowe came to himself. No vacations for ten years. Heavy responsibilities. Making money? Yes. Now on the verge of breakdown. What was it all worth, anyway? And then his eyes fell on a booklet his worried wife had sent for. It was “Man-Building in the Sunshine-Climate.” …Perhaps you, like Lowe, may find in “Man-Building in the Sunshine-Climate” the clue to robust health.
This form of health tourism began to appear in journal and newspaper advertisements not long after Tucson was originally incorporated as a city, in 1877. A promotional item published in the Arizona Daily Star in 1890 even went so far as to designate Tucson a place to cure serious pulmonary diseases. The rhetoric in these advertisements often framed the Sonoran Desert as “empty,” a place to be “discovered,” as if the Western lands of the continent had remained unoccupied and untouched all along. The process of “Man-Building” advertised by the Sunshine-Climate Club, therefore, carries a double meaning: building oneself and building one’s environment. [...]
With the proliferation of advertisements in magazines such as Ladies Home Journal and Journal of American Medical Association, a large number of [...] tourists [...] arrived to discover what the desert could offer. [...]
Throughout the late-nineteenth and early twentieth century, hospitals, sanatoria, health resorts, and other structures dedicated to medical treatment multiplied throughout the city of Tuscon [...]. These buildings were not in isolation, in the manner of nineteenth-century sanatoria in Europe or New England. Instead, they were open and integrated into the urban fabric [...]. In the late nineteenth century, upstate New York was among the most popular destinations for pulmonary health pilgrimages. With the opening of the Southern Pacific Railroad in 1880, however, towns with dry climates -- whose “pure and dry air … was not subject to severe seasonal changes” -- started bringing in crowds. [...]
Tucson reached its peak as the “health capital” during the 1930s, when the city’s roughly 30,000 residents were joined by about 10,000 health tourists visiting its twenty-one sanatoria, four hospitals, and four luxury hotels during the peak season. [...]
By 1928, Tucson’s planning and zoning commission had developed a new zoning system for such developments. Spatial buffers were instituted for sanatoria to ensure proper ventilation and isolation, dramatically altering the density and porosity of the city. In a residential neighborhood, for example, sanatoria had to be “set back 200 feet from the property line” and could only occupy “20 percent of the lot.” [...]
---
Sanatoria quickly became a refuge only the rich could afford [...].
Tucson’s Desert Sanatorium was a massive complex of eleven buildings built in 1926 spread out over 160 acres. [...] Telescopic devices called radiometers were housed on the roof of the main hospital building, channeling and directing sunlight through small lenses into the treatment rooms and sunbaths below. The sanatorium’s research center, hospital, and nurse’s residences were scattered across the site [...]. Each patient’s room was annexed to a small wooden balcony visible on the façade. Wet spaces were tiled and interiors white-washed, with baseboards curving away from the walls to prevent dust from settling on their surfaces. Window openings or balconies were carved out from the massive, Pueblo-style exterior walls. The Pueblo style also appears in the interior common spaces as Navajo carpets, mural reproductions, and quilts. Patient’s rooms were named after native tribes such as Pima, Papago, and Navajo. [...] The appropriation of indigenous culture and symbols persisted in the visual language of the Desert Sanatorium. One patient handbook came with a postcard featuring an image of a highly cultivated Navajo garden, and a description of the Sanatorium’s services and facilities adorned with sketches of a “teepee,” “rain cloud,” “thunderbird tracks,” “broken arrow,” “mountain range,” and “bear track.” The symbol of eagle feathers is placed alongside the welcome note by the director to denote his status as “chief” of the complex. The last page of the handbook even contains a personal message from the illustrator, in which he wishes that “each little figure brings happiness … and a very quick recovery. May the Great Spirit Bless and Protect you.”
Despite the generous application of native iconography and mythology in the sanatorium’s literature, few measures were taken to actually care for the infected people in local indigenous communities. By the early twentieth century, indigenous communities, along with other poor minority groups in Arizona had the highest rate of tuberculosis in the region. [...] Carlisle Indian School dedicated an issue of [...] [their] magazine to provide news and guidelines to counter the disease. [...] These analyses are accompanied by photographs of the architectural conditions of the buildings. [...] The issue further suggests the American Indians whose lifestyle shifted from the “more sanitary teepee to the one and two-room box house” could not keep up with hygiene. The magazine sought to enable the “medicine man” to cure the sick [...] but not, however, without yielding to an institutional form of governmentality. The narratives [...] yielded to the top-down institutional logic of controlling bodies by prescribing protocols. [...]
---
The disease, then, is not only a medical construct, but is firstly an environmental construct shaped by the climatic imaginaries which, in turn, shapes the urban context. Secondly, it is a social construct that privileges a certain lifestyle and class through its contagion and access to treatment. Lastly, it is a political construct, as it perpetuates the asymmetrical relationship between communities in the eye of the government and institutions. Amid these racial and economic imbrications, architecture is instrumentalized to facilitate institutional agendas. [...] Architecture perpetuates violence against the figure of the other.
---
Text by: Gizem Sivri. “Desert Fever: Harvesting the Sun, Colonizing the Land.” e-flux (Sick Architecture series). December 2020. [Screenshots were edited by me and display only part of the advertisement, which is shown in its entirety in Sivri’s article. Caption is as it appears in Sivri’s article. Bold emphasis and some paragraph breaks/contractions added by me.]
#agents of empire#tidalectics#indigenous#dine navajo#geographic imaginaries#debt and debt colonies#medical pathologization and modernity#ecologies#multispecies#sick architecture
18 notes
·
View notes