#raster calculator
Explore tagged Tumblr posts
Visit Tumblr Blog
Explore Tumblr blogs with no restrictions, modern design and the best experience.
Last Seen Tumblr Blogs


Fun Fact
Tumblr has been providing a Korean-language service since 2013.
Text
Exploring Topography: Using 3D Vector Maps for Architectural Site Planning

Using 3D Vector Maps for Architectural Site Planning
In the world of modern architecture, precise topographic understanding is crucial for effective site planning. Whether you're planning a residential community, a commercial complex, or a public infrastructure project, analyzing the terrain before construction can save time, reduce costs, and enhance design accuracy. This is where 3D Vector Maps and 3D map illustration have transformed the architectural process. These tools offer a deeper, data-rich look into the topography of a site, revolutionizing how architects and planners approach design and development.
The Importance of Topography in Architecture
It impacts drainage and water flow.
It determines construction feasibility.
It affects aesthetic and environmental harmony.
It influences foundation design and structural integrity.
Traditionally, topography was visualized using 2D contour maps or hand-drawn sketches. While useful, these lacked the precision and clarity required for large-scale projects. That’s where 3D Vector Maps come in.
What Are 3D Vector Maps?
Maps are digitally rendered illustrations that use vector graphics to represent three-dimensional terrain. These maps are generated using topographic data from sources like LiDAR, GPS surveys, or aerial imagery. Because they're vector-based, the graphics are infinitely scalable and don't lose resolution when zoomed or printed at large sizes.
Unlike raster maps, which are pixel-based and can become blurry upon enlargement, Maps maintain crisp lines and shapes, making them ideal for detailed Architecture Illustration and site analysis.
3D Map Illustration: Bridging Art and Data
Architects and planners can better communicate ideas to stakeholders, clients, and teams by turning raw geographical data into visually digestible graphics. These illustrations often include elements like:
Contour lines and elevation shading
Infrastructure like roads and utilities
Vegetation and landscape features
Property lines and zoning boundaries
The result is an engaging, data-rich visual that tells a complete story about the land being developed.
Advantages of Using 3D Vector Maps in Site Planning
1. Enhanced Visualization
With 3D map illustration, architects can view terrain from multiple angles and understand how it interacts with built structures. These visuals help identify:
High and low elevation zones
Natural drainage paths
Potential areas for erosion
Sun exposure patterns
This insight improves the design process by ensuring the architecture is sympathetic to the natural landscape.
2. Precise Data Integration
Soil composition
Flood zones
Infrastructure networks
Land use patterns
These layers provide comprehensive information, enabling more informed decisions during planning and execution.
3. Streamlined Collaboration
Design teams, engineers, surveyors, and local authorities can all work from the same digital 3D model. This collaborative use of 3D Map Illustration minimizes communication errors and improves project alignment across disciplines.
4. Cost and Time Efficiency
By identifying topographic challenges early in the process, architects can adjust designs accordingly, saving time and reducing the risk of costly changes during construction. Maps help in:
Slope analysis
Cut-and-fill calculations
Identifying suitable access points
Planning drainage systems
5. Eco-Friendly Site Planning
Modern architectural projects often aim to minimize environmental disruption. 3D Vector Maps assist in identifying ecological features like tree lines, water bodies, and wildlife habitats, helping planners preserve these elements or design around them.
Applications of 3D Map Illustration in Architecture
Urban Design
City planners use 3D Map Illustration to visualize large tracts of land before initiating zoning or development. The ability to overlay roads, buildings, and green spaces onto topographic features helps in creating sustainable, accessible cityscapes.
Residential Architecture
Home Builders and developers use Maps to design around slopes, create retaining walls, and determine optimal house placement for views and sunlight. They also aid in deciding where to place utilities and driveways based on elevation.
Landscape Architecture
For projects focused on gardens, parks, and open spaces, topography plays a central role. Landscape architects use 3D map illustrations to visualize how vegetation, water features, and walkways will interact with the terrain.
Integrating 3D Vector Maps with Architecture Illustration Software
Software like AutoCAD, Rhino, SketchUp, and Revit now supports vector-based topographic inputs, making it easy to integrate Maps directly into your design workflow. Many GIS (Geographic Information Systems) platforms also offer plugins that export topographic data into compatible formats for rendering and modeling.
This integration means you can use 3D Map Illustration directly in your 3D models or generate high-quality architectural renders with terrain context, improving both presentation and execution.
Case Study: Hillside Development Project
Consider a hillside development where building on steep slopes poses both structural and regulatory challenges. By using 3D Vector Maps, the architectural team can:
Identify buildable zones without excessive grading
Plan switchback roads that follow natural contours
Place homes in ways that reduce soil erosion
Design rainwater runoff paths that work with the land
The final result? A development that not only fits the landscape but also costs less to build and looks more organic.
Future Trends: AI and Automation in 3D Mapping
As AI and machine learning advance, we are now seeing automated systems that can generate 3D Vector Maps from drone footage or satellite data. This innovation is making topographic data more accessible to small firms and individual architects. Soon, Architecture Illustration will benefit from real-time updates to terrain maps, making the planning process even more agile and responsive.
Conclusion
Incorporating Maps into architectural site planning offers a comprehensive, efficient, and visually engaging approach to understanding terrain. From accurate slope analysis to collaborative design workflows, these maps have become an essential tool for modern architects.
When paired with high-quality 3D Map Illustration, the combination not only improves communication but also ensures that your project is both practical and visually compelling. Whether you’re designing a hillside villa, an urban park, or a massive commercial development, these tools help bridge the gap between vision and reality.
FAQs
Q1. How do 2D maps and 3D vector maps differ in the context of architecture? A 2D map provides flat, top-down visuals with limited depth, while a 3D Vector Map gives a three-dimensional, scalable representation of terrain, improving site analysis and design accuracy.
Q2. Do 3D Vector Maps support real-time updates? With advancements in GIS and drone technology, many mapping platforms now support near-real-time updates, especially beneficial for large or long-term projects.
Q3. How does 3D map illustration support sustainable architecture? By visually identifying natural features like trees, water paths, and slopes, 3D map illustrations help architects design with minimal environmental disruption.
0 notes
Text
AMD Radeon RX 9070 XT vs RX 7900 XT: Which GPU Is Better?

RX 9070 XT vs. 7900
Performance
Radeon 7900 XT
RTX 3090 Ti-like rastering for high-end 1440p and 4K content.
Ray Tracing: Better than before, but still behind NVIDIA's goods.
AI Features: Supports FidelityFX Super Resolution (FSR) 2 to increase frame rates without compromising image quality.
Efficiency: Low load temperatures and high energy efficiency.
Radeon RX 9070 XT
Rastering: Beats the RX 7900 XT in benchmarks and offers superior frame rates at 1440p and 4K.
Third-generation RT processors improve ray-traced game performance.
AI Features: AI accelerators support FidelityFX Super Resolution (FSR) 4 for better upscaling and frame generation.
Efficiency: It has a higher TDP but better performance-per-watt than its predecessor.
Technical specs and architecture
Radeon RX 7900 XT
RDNA 3 structure
Calculation units: 84
5,376 stream processors.
The 84 (2nd Gen) Ray Accelerators
GDDR6 20 GB VRAM
Bus: 320-bit
800 GB/s memory bandwidth
Up to 2,394 MHz boost clock
TDP: 300W
Initial Cost: $900
Radeon RX 9070 XT
RDNA 4 structure.
Computer Units: 64
Processing Units: 4,096 Stream
64 3rd Gen Ray Accelerators
128 2nd-Gen AI Accelerators
16GB GDDR6 RAM
Memory Bus 256
640 GB/s memory bandwidth
Up to 2,970 MHz boost clock
TDP: 304 W
The initial price is $599 USD.
Benefits
Radeon RX 7900 XT
Large VRAM: 20 GB GDDR6 runs memory-intensive apps smoothly.
Design Efficiency: Chiplet architecture improves scalability and performance per watt.
DisplayPort 2.1 and HDMI 2.1 support for high-resolution, fast-refresh panels.
Help for AV1 streaming, content generation, hardware encoding, and decoding.
Radeon RX 9070 XT
RDNA 4's more complex architecture improves efficiency and performance.
Combining AI: AI accelerators improve game speed and graphics, enabling advanced features like FSR 4.
It costs $599, which is reasonable considering its performance.
Display Support: DisplayPort 2.1a and HDMI 2.1b ensure compatibility with the latest screens.
Disadvantages
Radeon RX 7900 XT
Ray Tracing Performance: NVIDIA's RTX series leads.
Point of Price: NVIDIA and AMD contend for its $900 price.
Driver issues may have caused significant power consumption for media playing on many monitors.
Radeon RX 9070 XT
The VRAM: Compared to the RX 7900 XT's 20 GB, 16 GB may limit high-resolution, high-texture games.
Despite fewer games adopting FSR 4 at launch, its support is growing as a new technology.
Power: Higher clock rates are better than RX 7900 XT but use more power.
Video Game Performance
The RX 7900 XT performs well in 1440p and 4K rasterised games with good frame rates.
The RX 9070 XT has a 5–15% advantage in most modern games due to better ray tracing and FSR 4 compatibility.
Ray Tracking
The RX 7900 XT contains second-generation ray tracing processors, however it struggles with demanding RT games without FSR.
Besides having third-generation ray tracing cores, the RX 9070 XT performs better with FSR 4 and handles intricate scenes better.
Content Creation, AI
The RX 7900 XT performs well in Blender, Premiere Pro, and DaVinci Resolve with hardware AV1 encoding.
AI acceleration and better encoding pipelines speed up AI model inference, multitasking, and export/render times on the RX 9070 XT.
Memory/VRAM
A 320-bit bus with 80MB of Infinity Cache and 20 GB of GDDR6 allow the RX 7900 XT to handle 800 GB of bandwidth per second.
The RX 9070 XT has 640 GB/s bandwidth thanks to its 256-bit bus, 64MB cache, and 16 GB GDDR6.
Thermals and power efficiency
Despite its high thermal output and idle power consumption, RX 7900 XT consumes 300W.
The RX 9070 XT utilises 304W under stress but is more efficient when idle and watching media.
Driver and Software Ecosystem
RX 7900 XT drivers support Adrenalin (Radeon Boost, Anti-Lag, FSR 2/3).
Although the RX 9070 XT supports FSR 4, AI frame building, and newer Adrenalin tools, driver maturity can take months.
#AMDRadeonRX9070XT#RX7900XT#RX9070XT#RX9070XTvsRX7900XT#technology#technews#news#technologynews#technologytrends#govindhtech
0 notes
Text
Reducing iOS App Size Without Sacrificing Functionality

As user expectations grow and storage constraints persist—especially on older devices—iOS mobile application development teams are under increasing pressure to build lightweight yet fully functional apps. With limited storage on iPhones and iPads, users are more likely to delete apps that consume too much space or hesitate to download large ones in the first place.
Reducing your iOS app's size isn't just a technical optimization—it's a competitive advantage. But how can developers trim down an app without compromising its core features or user experience? In this post, we’ll dive into proven strategies and tools to help developers minimize app size while still delivering a powerful product.
Why App Size Matters More Than Ever
App size plays a critical role in user acquisition and retention. According to industry data, apps larger than 200 MB are often skipped due to limited mobile data plans or slow download speeds. On the Apple App Store, apps over 200 MB cannot be downloaded over cellular data without Wi-Fi—an important restriction for on-the-go users.
Moreover, as more functionalities are added, app size can quickly balloon out of control. Developers need smart strategies to strike the right balance between functionality and file size.
1. Optimize Image Assets
One of the first and most effective ways to reduce app size is by optimizing image assets. Use vector graphics (like PDFs or SVGs) instead of raster images when possible. Also, implement image compression tools such as:
ImageOptim
TinyPNG
JPEGmini
Additionally, consider using asset catalogs and slicing techniques like @2x, @3x only where necessary to reduce redundant high-resolution files for unsupported devices.
2. Use App Thinning
Apple’s App Thinning technology—comprising Slicing, Bitcode, and On-Demand Resources—is a game-changer in reducing the actual size of the app installed on a device.
Slicing: Creates device-specific app variants.
Bitcode: Uploads intermediate representation, allowing Apple to re-optimize the app binary.
On-Demand Resources: Lets you tag resources to be downloaded only when needed, reducing initial download size.
Using these techniques can significantly decrease the amount of data users need to install and run your app.
3. Remove Unused Code and Libraries
Over time, codebases accumulate unused methods, classes, and third-party libraries. These not only increase app size but also potentially introduce security vulnerabilities.
Tools like Xcode’s static analyzer, SwiftLint, and AppCode help identify dead code. Additionally, selectively importing third-party SDKs rather than bloating your project with full libraries can make a substantial difference.
4. Modularize Your Codebase
Dividing your code into smaller, reusable modules makes it easier to isolate what’s essential during the initial install. Non-essential modules—such as less frequently used features or premium content—can be downloaded later through Apple’s On-Demand Resources or custom logic.
This is a smart approach for apps with multiple functions like e-learning platforms, where some users might only use a fraction of the available content.
5. Analyze Before You Build
Using tools like Xcode’s size report and App Store Connect analytics, developers can identify which components contribute most to app size. Once you’ve visualized your app’s weight distribution, you can better target optimizations.
This leads to smarter budgeting and planning. If you’re still in the early stages, a mobile app cost calculator can help estimate how your design decisions (including those affecting size) will impact the overall development cost.
Want expert help streamlining your app without losing its core features? Book an Appointment with our iOS specialists today.
6. Compress and Optimize Audio/Video
Media files can eat up storage faster than any other asset. Use efficient formats like HEVC (H.265) for video and AAC for audio. Additionally, stream or download larger media files only when required instead of bundling them into the initial app install.
Apps that rely on heavy media—like workout videos or meditation guides—can adopt a hybrid strategy by loading lighter versions initially and allowing the user to download HD content later.
7. Reevaluate Fonts and Icons
Many developers overlook fonts and icons as a source of unnecessary bulk. Use system fonts where possible instead of bundling custom fonts. If you must use custom typography, include only the characters you need, particularly if your app supports multiple languages.
Similarly, switch from icon sets to icon fonts or vector graphics to reduce redundancy and improve scaling across devices.
8. Keep Your Build Settings Clean
Regularly cleaning up your build settings and configurations in Xcode can prevent unnecessary files from sneaking into your final product. Also, avoid embedding debugging tools, test frameworks, or logging modules in production builds.
Use build flags to ensure that development-only features are stripped from release versions. This not only saves space but also improves security and performance.
Final Thoughts: Less Can Be More
Reducing iOS app size while maintaining functionality is a nuanced process that blends strategy with smart tooling. It’s not about cutting corners—it’s about refining your app to focus on what truly matters to your users.
Smaller apps load faster, install quicker, and often provide a smoother user experience. By leveraging Apple’s App Thinning, optimizing assets, and trimming unnecessary code, you can ensure that your app is lean without being lacking.
Whether you’re building a new app or refining an existing one, adopting these practices can significantly improve usability and accessibility—key factors in a competitive App Store market.
If you're looking for expert guidance on building optimized, user-friendly apps, explore our Custom iOS App Development Services. We’re here to help you create impactful, scalable applications that never compromise on performance.
0 notes
Text
QGIS Course: Get Job-Ready with Practical GIS Training
In today's data-driven world, Geographic Information Systems (GIS) have become a crucial part of urban planning, environmental monitoring, disaster management, and much more. QGIS (Quantum GIS), a free and open-source platform, empowers professionals and learners with tools to visualize, manage, and analyze spatial data. Whether you're a student, engineer, environmentalist, or a researcher, a QGIS course can open doors to exciting opportunities across various industries.
Why Learn QGIS?
QGIS has become a go-to tool for both beginners and professionals due to its ease of use, robust community support, and constant updates. Here's why enrolling in a QGIS course makes sense:
Open-source and free: No licensing fees, which makes it ideal for individuals and startups.
Highly versatile: Supports vector, raster, and database formats.
Advanced features: Includes georeferencing, spatial analysis, plugin support, and 3D mapping.
Cross-industry applications: Useful in fields like agriculture, geology, city planning, and more.
What You Will Learn in a QGIS Course:
A comprehensive QGIS training program typically includes:
Introduction to GIS and spatial data types
Navigating the QGIS interface
Creating and managing shapefiles and layers
Georeferencing scanned maps
Performing spatial queries and analysis
Using plugins for advanced mapping
Creating interactive web maps
Real-world project-based learning
Courses may be structured for absolute beginners, intermediate users, or even advanced professionals, depending on your goals.
Case Studies:
Case Study 1: Mapping Urban Green Spaces in Bengaluru, India
Objective: To identify, measure, and map green cover in different wards of Bengaluru city.
Tools Used: QGIS, OpenStreetMap, and Sentinel satellite imagery
Process:
Satellite images were imported into QGIS and overlaid with city ward boundaries.
NDVI (Normalized Difference Vegetation Index) analysis was conducted using raster tools.
Green cover was calculated per ward and visualized on a thematic map.
Outcome:
The project revealed that only 14% of the city had consistent green cover.
Results were used by the city council to propose urban tree plantation drives in low-green areas.
Case Study 2: Disaster Risk Mapping in Nepal
Objective: To create a hazard map for earthquake-prone zones in Nepal.
Tools Used: QGIS, GPS survey data, DEM (Digital Elevation Models)
Process:
Field data was collected from various rural regions and imported into QGIS.
Slope and elevation maps were generated using DEM.
Layers were overlaid to identify regions at highest seismic risk.
Outcome:
Local authorities used the map to guide future construction projects and implement early-warning systems in critical zones.
Case Study 3: Agricultural Monitoring in Punjab
Objective: To monitor cropping patterns and improve irrigation efficiency in Punjab’s agricultural belt.
Tools Used: QGIS, Landsat imagery, Field survey data
Process:
Crop classification was done using supervised classification in QGIS.
Raster and vector data were combined to assess changes in crop types over time.
A report was generated to identify areas with over-irrigation.
Outcome:
Farmers received recommendations for crop rotation and water conservation.
The project helped reduce water usage by 18% over two years.
Career Opportunities After a QGIS Course:
Completing a QGIS certification course can lead to a variety of career paths, such as:
GIS Analyst
Remote Sensing Specialist
Urban Planner
Environmental Consultant
Agricultural GIS Expert
GIS Developer
With QGIS being recognized globally, your skills are applicable not just in India, but around the world.
Conclusion:
A QGIS course equips you with essential skills to analyze spatial data, contribute to real-world projects, and build a rewarding career. From urban development to environmental sustainability, GIS professionals are in high demand — and QGIS is your gateway to entering this dynamic field.
0 notes
Text
Vector Geometry Applied to the Study of Oriented Areas in Parallelograms
Author: Renato Ferreira da Silva
Tools: ChatGPT and DeepSeek
1. Introduction
Vector geometry is a fundamental tool for solving complex problems in an elegant and systematic way, especially in contexts involving oriented areas and proportional relationships. This article explores a classical problem in vector geometry: calculating the oriented area of a quadrilateral (MPNQ) within a parallelogram (ABCD), defined by vectors (\mathbf{u}) and (\mathbf{v}). In addition to the mathematical solution, we discuss its pedagogical relevance and applications in fields such as computer graphics and financial education, integrating insights from recent research.
2. Mathematical Context
Problem Definition
In the parallelogram (ABCD), the points (M), (N), (P), and (Q) are defined as:
(M): divides (AB) in a (2:1) ratio ((\vec{AM} = \frac{2}{3}\mathbf{u}));
(N): located on (BC) such that (\vec{BN} = \frac{5}{8}\mathbf{v});
(P): midpoint of (AD);
(Q): intersection of the diagonals (vector average of (\mathbf{u}) and (\mathbf{v})).
The oriented area of the parallelogram is given by (\mathbf{u} \times \mathbf{v} = 864), and the goal is to compute the area of (MPNQ).
3. Methodology and Calculation
Vector Coordinates
Using a coordinate system with origin at (A(0,0)):
(M = \left(\frac{2}{3}u_1, \frac{2}{3}u_2\right)),
(P = \left(\frac{v_1}{2}, \frac{v_2}{2}\right)),
(N = \left(u_1 + \frac{5}{8}v_1, u_2 + \frac{5}{8}v_2\right)),
(Q = \left(\frac{u_1 + v_1}{2}, \frac{u_2 + v_2}{2}\right)).
Oriented Area via Vector Product
The oriented area of (MPNQ) is computed using the formula: [\text{Area} = \frac{1}{2} \left( M \times P + P \times N + N \times Q + Q \times M \right),] where (\times) denotes the determinant (the 2D cross product).
Partial Results:
(M \times P = \frac{1}{3}(\mathbf{u} \times \mathbf{v})),
(P \times N = -\frac{1}{2}(\mathbf{u} \times \mathbf{v})),
(N \times Q = \frac{3}{16}(\mathbf{u} \times \mathbf{v})),
(Q \times M = -\frac{1}{3}(\mathbf{u} \times \mathbf{v})).
Total Sum: [\frac{1}{3} - \frac{1}{2} + \frac{3}{16} - \frac{1}{3} = -\frac{5}{16},] [\text{Final Area} = \frac{1}{2} \cdot \left(-\frac{5}{16}\right) \cdot 864 = \boxed{-135}.]
4. Discussion and Applications
Proportional Invariance
The ratio (\frac{5}{32}) between the areas of (MPNQ) and (ABCD) is constant, independent of (\mathbf{u}) and (\mathbf{v}). This invariance stems from the fact that the point positions are defined by fixed proportions (e.g., (\frac{2}{3}), (\frac{5}{8})), illustrating the robustness of vector-based approaches to geometric problems.
Pedagogical Relevance
The integration of vectors into high school education, as proposed by Assemany (webpage 1), facilitates the understanding of concepts like translations, rotations, and oriented areas. The use of flowcharts connecting content (e.g., trigonometry, affine functions) reinforces the importance of a unified mathematical approach.
Applications in Computer Graphics
Vectors and matrices are essential for 3D modeling, geometric transformations, and rasterization. For example, the graphics pipeline (application → geometry → rasterization) relies on vector operations to render complex objects. In this context, oriented area calculations can assist in collision detection and optimization of rendering algorithms.
Connection to Financial Education
The analysis of oriented areas can be adapted into risk metrics for financial charts, such as relationships between price and moving averages. The proportional invariance (\frac{5}{32}) may serve as a filter to identify market patterns and trend shifts.
5. Conclusion
The calculation of the oriented area of (MPNQ) illustrates the power of vector geometry in solving structural problems. The constant ratio (\frac{5}{32}) emphasizes the mathematical elegance of proportion-based methods, with applications extending beyond the classroom to fields such as computer graphics and financial analysis. The integration of innovative pedagogical methodologies, like those proposed by Assemany, and the use of mobile technologies, highlights the need to modernize mathematics education to prepare students for multidisciplinary challenges.
0 notes
Text
Guide How to Optimizing Your Gaming PC for Ray Tracing

In the ever-evolving world of How to Optimize Gaming PC for Ray Tracing, few technologies have made as massive an effect in current years as ray tracing. This rendering approach simulates the bodily behavior of light to create stunningly sensible reflections, shadows, and international illumination. But as many gamers speedy find out, enabling those attractive consequences can placed even effective systems on their knees.
I nonetheless keep in mind the first time I enabled ray tracing in Cyberpunk 2077. My as soon as-clean gameplay changed into a slideshow presentation, and I learned the difficult manner that optimizing a gaming PC for ray tracing calls for more than simply flipping a switch in the settings menu.
Whether you've been scouring Reddit posts approximately how to optimize gaming PC for ray tracing, searching for excellent ray tracing optimizations, or diving into technical discussions approximately r raytracing culling techniques, this comprehensive guide will assist you in squeezing the exceptional overall performance out of your hardware even as taking part in those excellent ray-traced visuals.
Table of Contents
Understanding Ray Tracing Technology
Hardware Requirements for Ray Tracing
Software Optimizations for Ray Tracing
DLSS, FSR, and XeSS: Your Ray Tracing Allies
Ray Tracing Culling Techniques
Step-via-Step Optimization Guide
Monitoring and Fine-Tuning Performance
Reddit-Approved Ray Tracing Tweaks
Future-Proofing Your Ray Tracing Setup
Conclusion
Understanding Ray Tracing Technology
Before we dive into optimization strategies, it's crucial to recognize what makes ray tracing so worrying on your hardware.
Traditional rasterization rendering (what games have used for many years) works by converting 3D models into 2D pixels for your display, then applying lights and effects in a while. It's fast but is based on various shortcuts and approximations for lighting fixtures.
Ray tracing, however, simulates character mild rays, tracing their path as they leap off surfaces, refract thru materials, and in the end attain the virtual digicam. This physically accurate technique creates a great deal extra realistic lighting fixtures, reflections, shadows, and international illumination—however at a fantastic computational fee.
A pal of mine who works in recreation improvement explained it to me in this manner: "Imagine having to calculate the direction of thousands and thousands of light rays, 60 instances in keeping with second, at the same time as additionally dealing with all of the different factors of rendering a sport. That's why ray tracing is this type of overall performance hog."
Hardware Requirements for Ray Tracing

Let's be honest—optimizing your gaming PC for ray tracing starts with having the right hardware. While software program tweaks can help, they can handiest take you so far if your system doesn't meet the basic requirements.
Graphics Cards
For ray tracing, your GPU is the star of the display:
NVIDIA RTX Series: The pioneers of consumer ray tracing hardware, from the 2000 collection to the brand new 5000 series (as of early 2025). The RTX 4080 and 4090 are presently among the exceptional performers for ray tracing workloads, with the 5000 collection showing promising upgrades.
AMD Radeon RX Series: Starting with the RX 6000 collection, AMD delivered ray tracing competencies, with performance enhancement notably in the RX 7000 collection and more recent models.
Intel Arc Series: Intel's committed GPUs additionally help ray tracing, even though they're still gambling catch-up with NVIDIA and AMD in phrases of raw ray tracing overall performance.
I learned this lesson the hard manner after I tried permitting ray tracing on my vintage GTX 1080. The recreation technically allowed me to turn it on, but the framerate dropped to approximately three FPS—essentially a completely pricey slideshow.
CPU Requirements
While ray tracing is on the whole GPU-intensive, your CPU still performs an important function:
A contemporary multi-center processor (6+ cores encouraged)
High unmarried-thread performance for sport common sense
Sufficient CPU cache and memory bandwidth
RAM and Storage
Other components that affect ray tracing overall performance:
16GB RAM minimum, 32GB advocated for excessive-quit systems
Fast NVMe SSD storage to deal with the larger texture and asset facts that frequently accompany ray-traced video games
Software Optimizations for Ray Tracing
Once you have got appropriate hardware, software program optimizations grow to be crucial for balancing visual first-class and overall performance.
Driver Updates
This would possibly appear apparent, but I've visible countless Reddit threads in which customers whinge about bad ray tracing performance only to discover they are going for walks with old drivers.
NVIDIA, AMD, and Intel frequently launch motive force updates especially optimized for ray tracing in new games
Sometimes, a driver replacement on my own can improve ray tracing overall performance by way of 10-15%
Just closing month, I changed into struggling with stuttering in a ray-traced game until I found out I had skipped the ultimate two-driver updates. After updating, the difference becomes nighttime and day.
Game-Specific Settings
Not all ray tracing effects are created identically. Most video games provide unique tiers of ray tracing:
Ray-traced shadows: Generally the least worrying effect
Ray-traced reflections: Moderate performance impact but very visually awesome
Ray-traced worldwide illumination: Usually the maximum disturbing putting
A smart technique is to permit simplest the ray tracing outcomes that make the largest visual difference for each specific game. For example, in a sport with lots of water and glass, ray-traced reflections might be worth the performance hit, whilst ray-traced shadows might be less noticeable.
DLSS, FSR, and XeSS: Your Ray Tracing Allies
One of the only ray tracing optimizations is pairing it with upscaling technologies:
NVIDIA DLSS (Deep Learning Super Sampling)

DLSS uses AI to upscale video games from a lower internal resolution in your display decision, dramatically enhancing performance even as preserving visual pleasant. DLSS three.Five and more recent variations are specially powerful at maintaining ray tracing detail.
My private experience: Enabling DLSS 3 in Cyberpunk 2077 took my framerate from an unplayable 25 FPS to a smooth 75 FPS with ray tracing nonetheless enabled.
AMD FSR (FidelityFX Super Resolution)
AMD's solution to DLSS works throughout a much wider variety of hardware, together with NVIDIA GPUs. While early variations couldn't healthy DLSS quality, FSR three.0 and more recent variations have narrowed the space notably.
Intel XeSS
Intel's go-platform upscaling technology works further to DLSS and FSR, offering any other alternative for enhancing overall performance while retaining ray tracing first-rate.
When browsing a way to optimize gaming PC for ray tracing Reddit discussions, upscaling technology are continuously the most endorsed answer for balancing first-rate and overall performance.
Ray Tracing Culling Techniques
Now let's dive into one of the extra technical elements of ray tracing optimization: culling.
R raytracing culling refers to strategies that reduce the range of rays that want to be calculated by well determining which of them are not likely to make contributions drastically to the very last photograph.
What is Ray Culling?
In easy phrases, ray culling is ready being selective with which mild rays you calculate. There's no want to hint rays that may not have a great impact at the final photo.
Several culling techniques exist:
Frustum culling: Only calculating rays in the participant's view
Occlusion culling: Skipping rays that could be blocked using opaque items
Distance culling: Reducing ray detail for remote items
R raytracing culling radius: Limiting the distance that rays will tour from their origin
A recreation developer pal explained it to me like this: "Without culling, ray tracing would be like calculating each single photon in a scene. With culling, we are being smart approximately which light paths truly rely to what the participant sees."
Implementing Ray Culling
For developers the usage of engines like Unreal or Unity, r raytracing culling alternatives are often to be had within the rendering settings. For game enthusiasts, these optimizations are typically dealt with below the hood, however expertise them facilitates give an explanation for why positive settings affect performance the manner they do.
Some video games with superior snapshot settings allow tweaking culling-related parameters:
Ray tracing distance: How a long way ray-traced outcomes increase from the digital camera
Ray bounce limit: How in many instances a ray can jump earlier than the calculation stops
Culling threshold: The important degree below which rays are culled
When I experimented with those settings in the latest sport, I found that lowering the ray tracing distance from "Ultra" to "High" advanced my performance by approximately 20% with minimum visual distinction in the course of ordinary gameplay.
Step-via-Step Optimization Guide
Now that we understand the foundations, permits create a sensible, step-by-step technique for How to Optimize Gaming PC for Ray Tracing:
1. Update Your System
Update GPU drivers to the modern-day model
Ensure Windows is up to date
Update your recreation to the ultra-modern patch
2. Enable GPU Hardware Scheduling
On Windows 10/11:
Go to Settings > System > Display
Click on Graphics settings
Turn on "Hardware-multiplied GPU scheduling"
Restart your pc
This setting offloads some image scheduling from the CPU to the GPU, doubtlessly enhancing ray tracing overall performance.
Three. Configure Nvidia Control Panel / AMD Radeon Software
For NVIDIA users:
Right-click on the computer and select "NVIDIA Control Panel"
Navigate to "Manage 3-D settings"
Set "Power control mode" to "Prefer most overall performance"
Set "Texture filtering - Quality" to "Performance"
Ensure "CUDA - GPUs" has your GPU selected
For AMD customers:
Open AMD Radeon Software
Go to the Gaming tab
Select your sport or add it if not listed
Set "GPU Workload" to "Graphics"
Consider putting "Anti-Lag" to "Enabled"
Four. Optimize In-Game Settings
Start with ray tracing set to "Medium" or equivalent
Enable DLSS/FSR/XeSS (set to "Balanced" or "Performance" mode)
Reduce these settings which heavily impact performance:
Volumetric lights/fog
Screen area reflections (redundant with ray-traced reflections)
Shadow pleasant (for non-ray-traced shadows)
Particle results nice
Consider decreasing the decision to 1440p if you're on a 4K display
Five. Monitor and Adjust
Use an on-screen show device like MSI Afterburner to reveal:
Framerate
GPU usage
VRAM usage
Temperatures
Aim for stable overall performance rather than maximum settings
I carried out these actual steps while putting in Cyberpunk 2077 on my buddy's new gaming PC. By cautiously balancing the settings, we have been capable of reap 60+ FPS with ray tracing enabled on his RTX 4070, which to start with struggled to preserve even 45 FPS with default "RT Ultra" settings.
Monitoring and Fine-Tuning Performance
Achieving optimal ray tracing overall performance is an iterative method. Here are a few gear and strategies to help you monitor and great-song your setup:
Performance Monitoring Tools
MSI Afterburner with RivaTuner: The gold preferred for in-recreation performance monitoring
NVIDIA FrameView / AMD Radeon Performance Metrics: Vendor-unique gear with distinct metrics
HWiNFO: For monitoring machine temperatures and figuring out potential thermal throttling
Identifying Bottlenecks
When monitoring, look for these signs:
GPU utilization at ninety-seven-a hundred: Your GPU is the proscribing aspect (maximum not unusual with ray tracing)
CPU cores at excessive utilization: Potential CPU bottleneck
High VRAM utilization: You may need to lessen texture pleasant or decision
Thermal throttling: Components lowering overall performance due to high temperatures
Overclocking Considerations
Carefully implemented overclocking can help with ray tracing performance:
GPU middle and reminiscence overclocking can provide five-15% overall performance upgrades
Improved cooling is important for maintaining overclocked overall performance
Undervolting can sometimes improve overall performance using decreasing thermal throttling
I do not forget struggling with a specific ray tracing-heavy sport until I realized my GPU turned into thermal throttling. After improving my case airflow and growing a custom fan curve, my performance stepped forward by almost 20% without changing any game settings.
Reddit-Approved Ray Tracing Tweaks
The gaming community on Reddit has ended up being a superb aid for ray tracing optimizations. Here are a number of the simplest tweaks I've gathered from various subreddits:
From r/nvidia:
"RT shadows are frequently the least major RT impact. Turning them off whilst preserving RT reflections can provide you with again 10-15 FPS with minimum visible impact."
"DLSS Frame Generation (DLSS 3.0+) is a game-changer for ray tracing performance on supported playing cards."
"If you are CPU constrained, enabling 'NVIDIA Reflex' can assist lessen system latency and clean out frame pacing."
From r/AMDHelp:
"FSR 3. Zero with Frame Generation enabled works noticeably nicely with ray tracing on RDNA 3 playing cards."
"Ray traced shadows at low first-class regularly look better than traditional shadow techniques at the same time as performing higher than extraordinary RT shadows."
From r/pcmasterrace:
"Custom decision scaling: Set your render decision to 85-90% and compensate with polishing filters for a performance enhance that's difficult to observe visually."
"For video games that help each DLSS/FSR and ray tracing, usually allow the upscaling generation first, then upload ray tracing outcomes one at a time until you locate your performance candy spot."
One in particular beneficial Reddit tip stored my gaming enjoy in Control. A user recommended simplest allowing ray-traced reflections while leaving the other RT consequences off, then using DLSS Performance mode. This aggregate gave me ninety% of the visible wow element with approximately 40% higher performance than complete RT.
Future-Proofing Your Ray Tracing Setup
As the ray tracing era keeps adapting, here are some considerations for future-proofing your setup:
Hardware Considerations
When upgrading, prioritize GPUs with robust ray-tracing acceleration
Consider the VRAM ability—ray tracing frequently calls for greater memory
Don't neglect CPU enhancements, as games have become increasingly more multi-threaded
Software Evolution
Keep an eye fixed on new variations of DLSS, FSR, and XeSS
Watch for improvements in r raytracing culling strategies
Stay updated on new motive force optimizations specifically for ray tracing
A developer pal who works on rendering technologies informed me some thing interesting: "The destiny of ray tracing is not pretty much raw GPU energy—it is about smarter algorithms that may get more visual exceptional from fewer rays. The r raytracing culling radius and comparable strategies will become increasingly more sophisticated."
Conclusion
Optimizing your gaming PC for ray tracing is both an art and a science. It requires expertise in the generation, having the proper hardware, applying appropriate software program settings, and constantly first-rate-tuning your setup.
Remember that an appropriate stability between visual nice and performance is rather non-public. Some game enthusiasts prioritize rock-stable framerates, at the same time as others are willing to just accept occasional dips beneath 60 FPS to experience the maximum sensible lighting fixtures and reflections feasible.
By applying the strategies included in this guide, from basic driving force updates to superior ray tracing optimizations and r raytracing culling issues, you will be properly prepared to get the most out of this progressive rendering era.
The next time you boot up a recreation with ray tracing enabled, take a moment to realise just how a long way gaming pictures have come—and understand that with the proper optimizations, you are experiencing them at their best.
Have you found another effective techniques for improving ray tracing overall performance? Share your stories and keep the discussion—after all, the gaming network prospers while we share our know-how.
#Ray Tracing Optimization#Gaming PC Performance#GPU Settings#DLSS Technology#FSR Upscaling#Ray Tracing Culling#Hardware Requirements#Gaming Graphics#Reddit Gaming Tips#How to Optimize Gaming PC for Ray Tracing
1 note
·
View note
Note
what if for powder-ti you just stored everything in the framebuffer? i'm unfamiliar with the CE and i come at it from an assembly on TI-83/84 b+w perspective, but doesn't the lcd chip still need to be fed each pixel over a port? (i.e. it's not memory mapped, unlike the TI-89[citation needed]). (of course this would give up on stacked elements like are possible in TPT) in that case, you could scan through the entire screen and do physics and calculate the colors on the fly as you send the new frame. if you can double buffer it, even better (so you can avoid double updating any pixels that move along the raster line). is the full screen write time too slow? (i know the b+w lcd chip needs wait cycles between bytes, so some display routines only send the pixels that differ to avoid having to delay as much) from what i remember the CE's ez80 is pipelined 40MHz and the resolution is like 300x240 or something? so you'd have a little over 9 opcodes per sand to achieve 60 fps. oh. i see now. but still, 30 fps at half the linear resolution would get you 74 clocks per pixel average which is enough that you can actually almost do something. if i had to do it on the black and white ti84 i'd have only like max 4 elements and use a bit plane for each one and try to do as much as the update logic as possible with bitwise operations (and perhaps a few 256 byte luts) so that i can update 8 pixels at once. it'd still probably be slow though but one might be able to do deterministic water, sand, smoke, and metl + spark (or wwld) at 30 fps (almost 700 t-states per byte)
also, if you're targeting the newer ones that have circuitpython, you might be able to pull some shenanigans with the circuitpy coprocessor (which i think is an arm cortex m0, but, unlike stm32 micropython, circuitpython probably doesn't have a way to execute inline assembly)
ima go look at your structs now (also lmk if this unsolicited advice is undesired)
Thanks a ton! Any help is appreciated.
Honestly it's been a long while since I worked on the project, but I initially wrote it in C, which probably didn't really help in the performance department. I at some point tried making an assembly version, but gave up pretty early... I think I should re-explore that. I experimented with many different pipelines, some performing physics over a linked list, then rendering the grid separately, and another with calculating the position and rendering each grain on the same iteration. It ultimately came down to as you guessed simply being too many too expensive operations happen too often so it didn't work. But I'd bet I'd have a better shot if the crux of it was coded in ASM. Also, I'm not sure how data is fed to the LCD, I just kind of used the function calls that the ce toolchain provided, but I could look into lower-level syscalls to for even greater efficiency.
As for circuitpy, I'm not really sure how to interface with the processor, and even if I could, I'm not sure how fast I could pull data from it, last I heard it was throttled down to make up for the main processor's speed, but who knows. If you could send some pointers my way, it'd be much appreciated!
Once again, thanks for your help and shown interest :)
#ez80#zilog#powder-ti#are you mmrv or pink? if not; may I know your handle? Either way; my dms are always open :3
0 notes
Text
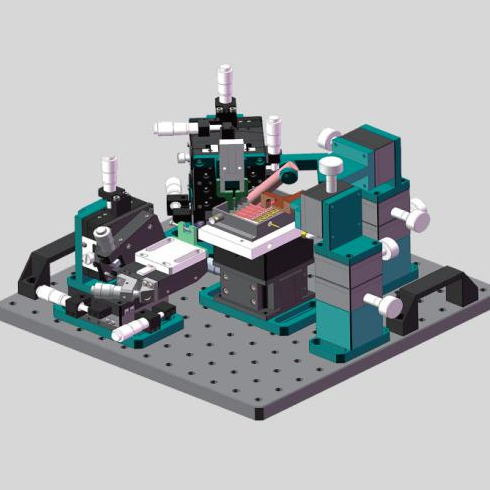
Optical Fiber Alignment
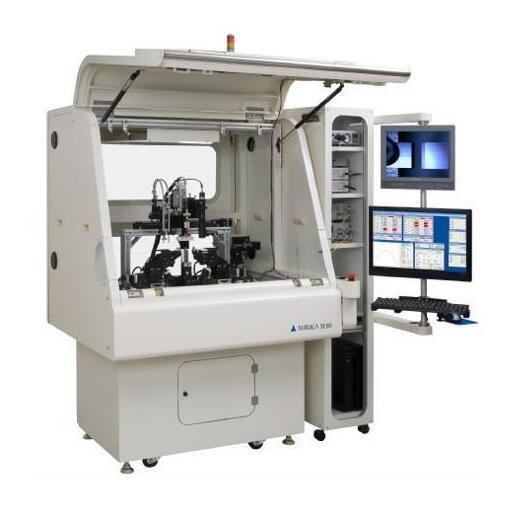
Precise Optical Fiber Alignment System is required for precise and dependable data transmission in an optical network. Most optical networks contain several optical couplings, and even slight losses at these couplings can result in substantial signal loss and data transfer issues. Minimising coupling losses is crucial in these networks. Prior to assembly or packing of an optical system, good fibre alignment results in the best coupling efficiency and hence the least amount of signal loss. Minimal signal loss reduces power needs, resulting in fewer repeaters, cheaper investment costs, and fewer failures.
A well-characterized input beam is linked into the fibre under test, and a raster scan of the fibre is performed to identify first light, which is the output signal from the fibre that indicates when the laser beam first enters the fibre. Once the initial light is detected, the location of the fibre is modified in a lateral, longitudinal, and angular coordinate system to determine the peak intensity of the output optical signal. A successful fibre alignment solution necessitates the modification of various critical motion parameters utilising a precision motion control device and a search method appropriate for the application.
Key Motion Parameters For Fibre Alignment
When employing motion control systems for Optical Waveguide Alignment System, the motion parameters selected for each axis have a significant impact on the alignment process. The following are the major characteristics to consider when selecting a motion controller for the position of peak power in fibre alignment processes.
Minimum Incremental Motion - The least amount of motion that a gadget can consistently and dependably produce. It should not be confused with resolution, which is calculated using the lowest controller display value or encoder increment. Rather, MIM refers to the controller's real physical performance, which allows for the change of the fibre location while looking for the position where maximal power is reached. While a smaller MIM can align the fibre closer to the maximum peak power, this capability comes at a substantial cost in terms of alignment speed and power increments.
The repeatability parameter describes a motion control system's capacity to achieve a repeatable position. It might be unidirectional or bidirectional. Fibre alignment systems generally have a bidirectional repeatability of 1 µm to a few nm. This characteristic is useful for rapidly determining the peak power location of similar device designs.
Optical Fiber Alignment System is a measure of a motion system's ability to maintain a position within a specific window of time and error. Aligning fibres for assembly processes like bonding is dependent on the fibres' positional stability once the peak power has been determined. Position stability requirements vary from 0.5 µm to a few microns.
1 note
·
View note
Text
How Mobile App Development Companies Optimize Apps for Speed
In today’s fast-paced digital world, users expect mobile apps to be lightning-fast and responsive.
A slow or laggy app can lead to high bounce rates, negative reviews, and loss of revenue. Mobile app development companies understand the importance of app performance and employ various strategies to optimize apps for speed. In this blog, we will explore the key techniques used by mobile app developers to enhance app speed and improve user experience.

1. Efficient Code Optimization
One of the first steps in improving app speed is optimizing the codebase. Developers write clean, efficient, and minimalistic code to reduce processing time. They avoid unnecessary loops, redundant calculations, and excessive memory allocations. Techniques such as:
Minifying and compressing JavaScript, CSS, and HTML files.
Using efficient algorithms and data structures.
Implementing lazy loading to load only the required content.
2. Reducing App Load Time with Lightweight Resources
Heavy images, videos, and high-resolution graphics can significantly slow down an app. To enhance speed, mobile app development companies:
Use compressed and optimized images in formats like WebP instead of PNG or JPEG.
Implement adaptive streaming for videos to adjust quality based on network conditions.
Utilize vector graphics for UI elements instead of raster images.
3. Caching and Data Optimization
Caching reduces the need to fetch data repeatedly from servers, thereby improving load times. Developers implement:
Local caching: Storing frequently accessed data on the user’s device.
Server-side caching: Using CDNs (Content Delivery Networks) to serve content faster.
Database optimization: Using indexing and query optimization to retrieve data efficiently.
4. Optimizing API Calls
Frequent API calls can slow down an app. Developers enhance performance by:
Batching API requests to reduce the number of server requests.
Using RESTful or GraphQL APIs for faster data retrieval.
Implementing asynchronous operations to prevent the UI from freezing while data loads in the background.
5. Efficient Memory Management
Poor memory management can lead to crashes and sluggish performance. To prevent this, developers:
Avoid memory leaks by properly releasing unused objects.
Optimize background processes to ensure they don’t consume excessive RAM.
Use tools like Android Profiler and Instruments for iOS to monitor memory usage.
6. Minimizing App Size
A bulky app takes longer to load and consumes more storage. Developers reduce app size by:
Removing unnecessary libraries and resources.
Using Android App Bundles or iOS Bitcode for optimized distribution.
Implementing on-demand resource loading to download only essential components initially.
7. Leveraging Multithreading and Parallel Processing
By distributing tasks across multiple threads, developers enhance performance. Techniques include:
Background threading: Running tasks like image processing in the background.
Parallel execution: Splitting large tasks into smaller chunks for simultaneous execution.
8. Network Optimization
Slow network performance can hinder an app’s speed. Developers optimize network interactions by:
Implementing data compression techniques like Gzip.
Using WebSockets instead of traditional HTTP requests for real-time updates.
Prefetching data to reduce waiting times.
9. Continuous Performance Testing
To ensure apps remain optimized, developers perform:
Load testing to simulate heavy traffic and analyze response times.
A/B testing to compare performance across different versions.
Profiling using tools like Firebase Performance Monitoring or Xcode Instruments.
10. Regular Updates and Maintenance
Performance optimization is an ongoing process. Mobile app development companies frequently update apps to:
Fix bugs that slow down performance.
Introduce new optimization techniques.
Adapt to new hardware and software advancements.
Conclusion
Speed optimization is crucial for delivering a seamless Mobile App Development Company experience. By focusing on code efficiency, caching, API optimization, memory management, and network enhancements, mobile app development companies ensure their apps run swiftly and smoothly. Whether you’re a business owner or a developer, prioritizing app performance will lead to better user retention, engagement, and overall success.
Looking to optimize your app for speed? Partner with a professional mobile app development company today and provide your users with a fast, seamless experience!
0 notes
Text
Top GIS Data Analysis Methods for Geospatial Insights
Geographic Information Systems (GIS) have revolutionized how we interact with spatial data. By providing tools to analyze, visualize, and interpret geographic data, GIS enables organizations to make informed decisions about everything from urban planning to disaster management. At the heart of these capabilities lies GIS data analysis, a powerful methodology that transforms raw spatial data into actionable insights. In this article, we’ll delve into the top GIS data analysis methods, illustrating how they unlock valuable geospatial insights.
What is GIS Data Analysis?
GIS data analysis refers to the techniques and tools used to study spatial data. These methods uncover patterns, relationships, and trends that may not be evident in raw data. Whether it's understanding traffic flow in a city or predicting the impact of climate change, GIS data analysis provides the framework to address complex geographic questions.
The Importance of GIS Data Analysis
With the increasing availability of geospatial data from sources like satellites, drones, and IoT devices, GIS data analysis has become more critical than ever. By applying sophisticated techniques, decision-makers can gain a deeper understanding of their environments, leading to improved resource allocation, risk mitigation, and strategic planning.
Top GIS Data Analysis Methods
Here’s a breakdown of the most impactful GIS data analysis methods:
1. Spatial Data Overlay Analysis
Overlay analysis is a foundational method in GIS that involves stacking multiple layers of data to identify relationships and patterns. For example:
Use Case: Urban planners overlay land use, population density, and transportation networks to identify optimal locations for new infrastructure.
Advantages: Combines diverse datasets to provide a holistic view of an area.
Tools: ArcGIS, QGIS.
2. Buffer Analysis
Buffer analysis examines the area within a specified distance around a feature (e.g., points, lines, or polygons). This method is essential for proximity-based studies.
Use Case: Determining the population within a certain distance of a proposed railway line.
Advantages: Easily identifies impact zones.
Tools: GRASS GIS, MapInfo.
3. Network Analysis
Network analysis studies the flow of resources, goods, or people across networks like roads, pipelines, or utilities.
Use Case: Optimizing delivery routes for logistics companies.
Advantages: Enhances efficiency by identifying the shortest or least congested paths.
Tools: Esri's Network Analyst, pgRouting.
4. Hotspot Analysis
Hotspot analysis identifies clusters of high or low values in spatial data. This is particularly useful for public safety, marketing, and environmental monitoring.
Use Case: Police departments use hotspot analysis to locate areas with high crime rates.
Advantages: Quickly highlights areas of concern or opportunity.
Tools: GeoDa, CrimeStat.
5. Interpolation
Interpolation predicts unknown values based on known data points. It is frequently used for environmental and meteorological studies.
Use Case: Estimating rainfall levels in regions without weather stations.
Advantages: Fills data gaps for better spatial coverage.
Tools: ArcGIS Geostatistical Analyst, SAGA GIS.
6. Raster Analysis
Raster analysis involves processing and analyzing raster datasets, such as satellite imagery or digital elevation models (DEMs).
Use Case: Calculating slope, aspect, and elevation for terrain analysis.
Advantages: Ideal for continuous data representation.
Tools: ERDAS Imagine, ENVI.
7. Suitability Analysis
Suitability analysis evaluates locations based on multiple criteria to determine their appropriateness for a specific purpose.
Use Case: Identifying potential sites for renewable energy projects.
Advantages: Integrates multiple factors for comprehensive decision-making.
Tools: ArcGIS ModelBuilder, QGIS Processing Toolbox.
8. Geostatistical Analysis
Geostatistical analysis applies statistical methods to spatial data, providing insights into trends and variability.
Use Case: Assessing soil contamination levels across agricultural fields.
Advantages: Offers robust predictions and uncertainty measurements.
Tools: Geostatistical Analyst, GeoR.
9. Spatial Autocorrelation
Spatial autocorrelation evaluates whether similar values cluster together or disperse across a geographic area.
Use Case: Studying the spread of diseases in urban environments.
Advantages: Highlights spatial dependencies in datasets.
Tools: Moran’s I, GeoDa.
10. Time-Series Analysis
Time-series analysis focuses on how spatial data changes over time. This is invaluable for monitoring dynamic phenomena.
Use Case: Analyzing deforestation rates in tropical regions over decades.
Advantages: Tracks temporal trends and patterns.
Tools: Google Earth Engine, ArcGIS Time Slider.
11. 3D Analysis
3D analysis visualizes and analyzes data in three dimensions, offering a deeper understanding of topography and urban environments.
Use Case: Planning high-rise developments in densely populated cities.
Advantages: Enhances visualization and spatial planning.
Tools: ArcGIS Pro, CityEngine.
12. Remote Sensing and Image Analysis
Remote sensing involves extracting information from satellite or aerial imagery. Coupled with image analysis, it provides insights into land use, vegetation health, and more.
Use Case: Monitoring agricultural productivity using NDVI (Normalized Difference Vegetation Index).
Advantages: Captures large-scale data efficiently.
Tools: Google Earth Engine, ENVI.
Best Practices for Effective GIS Data Analysis
To get the most out of GIS data analysis, follow these best practices:
Clean and Prepare Data: Ensure your data is accurate and up-to-date. Eliminate errors and inconsistencies before analysis.
Choose the Right Tools: Different GIS tools cater to specific methods. Select software based on your analysis needs and expertise.
Understand Spatial Relationships: Context is key in geospatial analysis. Consider the relationships between datasets to draw meaningful conclusions.
Leverage Visualization: Use maps, graphs, and 3D models to present your findings in an easily digestible format.
Validate Results: Cross-check analysis results with ground-truth data or expert opinions to ensure reliability.
Applications of GIS Data Analysis Across Industries
Urban Planning: GIS helps in zoning, traffic management, and urban growth modeling.
Environmental Conservation: Researchers use GIS to track biodiversity, deforestation, and climate change impacts.
Public Health: GIS identifies disease outbreaks and tracks healthcare resource distribution.
Disaster Management: From flood prediction to emergency response, GIS plays a crucial role in mitigating natural disasters.
Retail and Marketing: Businesses analyze customer demographics and location-based trends for better market targeting.
Future Trends in GIS Data Analysis
The field of GIS is rapidly evolving, with emerging technologies set to enhance geospatial analysis:
AI and Machine Learning: Automating data processing and pattern recognition.
Big Data Integration: Handling massive datasets from IoT and social media.
Cloud GIS: Enabling collaborative, real-time spatial analysis.
AR and VR: Offering immersive geospatial visualizations for improved decision-making.
Conclusion
GIS data analysis is a cornerstone of modern decision-making, empowering industries to harness the full potential of geospatial data. By mastering methods like overlay analysis, network analysis, and geostatistics, organizations can unlock valuable insights that drive innovation and sustainability. As technology advances, the scope of GIS data analysis will only continue to expand, offering new opportunities to tackle global challenges.
Whether you're a seasoned GIS professional or a newcomer to the field, understanding these top GIS data analysis methods is essential for navigating the ever-changing landscape of geospatial insights.
0 notes
Text
A Beginner's Guide to Choosing the Best DTF Transfer Film Printer

In recent years, DTF (Direct-to-Film) printing has gained popularity for its versatility, quality, and potential to create vibrant designs on various materials. For anyone considering entering the custom printing industry, understanding DTF transfer film printers is essential, as they offer a unique printing solution. Whether you're a seasoned professional or a beginner, this guide will help you choose the best DTF transfer film printer for your needs.
What Is a DTF Transfer Film Printer?
A DTF transfer film printer is a specialized printing machine that allows you to print designs onto a clear transfer film, which can then be applied to different textiles. The process uses a combination of pigment ink and a special adhesive powder, resulting in designs that are durable, colorful, and versatile. Unlike traditional DTG (Direct-to-Garment) printers, DTF printers don’t require pre-treatment of fabrics and can print on a wider variety of materials, from cotton and polyester to blends and even nylon.
Why Choose DTF Printing?

DTF printing has many advantages, making it a smart choice for small businesses, print shops, or anyone looking to add a unique service. Here are a few reasons to consider it:
Versatility: DTF printers can transfer designs onto nearly any fabric, providing more flexibility than many other printing methods.
Cost-Effectiveness: Since no pre-treatment is required, DTF is more cost-effective, especially for small batches.
High Quality: DTF prints are durable, vivid, and can withstand multiple washes.
Ease of Use: Even beginners find DTF printing relatively easy to master, thanks to the streamlined setup process.
Now that you know the benefits of DTF transfer printer, let’s look at how to select the right DTF transfer film printer for your needs.
Factors to Consider When Choosing a DTF Transfer Film Printer
Printing Resolution and Quality
Resolution is a crucial factor to consider, especially if you plan to print intricate designs. Higher DPI (dots per inch) usually means sharper, more detailed images. Look for printers with at least 1440 DPI to ensure high-quality output.
Ink Compatibility and Quality
DTF printers use a specific type of ink that is both durable and vibrant. Ensure the printer you choose is compatible with high-quality DTF inks. Pigment-based inks are generally best for this type of printing due to their fade-resistant qualities.
Print Size Capability
Depending on the type of designs you plan to create, you may need a printer capable of handling larger prints. Most DTF printers offer standard print sizes, but you might want a model that allows you to print larger or custom sizes if you’re working on larger projects like hoodies, banners, or jackets.
Speed and Efficiency
Printing speed can vary between DTF printers, with some models better suited for higher output. If your goal is to handle large volumes of orders, investing in a high-speed model will save time and increase productivity.
Cost of Consumables
Consider the ongoing costs of consumables like ink, transfer film, and powder adhesive. While entry-level printers may be affordable, some models have higher consumable costs over time. Calculate your per-print costs to make sure you’re choosing a printer that fits your budget.
Durability and Maintenance
Some DTF printers are built with durability in mind, while others may require frequent maintenance. Look for models known for their durability and ease of upkeep. Machines with self-cleaning print heads and easy access for routine maintenance can help reduce downtime.
Ease of Use and Software Compatibility
Look for user-friendly printers that come with clear instructions, software support, and customer service. Some DTF printers come with software included, while others might require third-party software like Adobe Photoshop, Illustrator, or RIP (Raster Image Processor) software to optimize designs.
Customer Support and Warranty
Having reliable customer support can be invaluable, especially if you’re new to DTF printing. Check to see if the manufacturer offers training, support, and a solid warranty. Many reliable brands offer a minimum one-year warranty, which is helpful for unexpected issues.
Top DTF Transfer Film Printer Brands to Consider
Epson: Known for high-quality print resolutions, Epson’s modified DTF printers are popular in the market.
Brother: While primarily known for DTG, Brother also offers DTF-compatible printers with reliable performance.
Ricoh: Ricoh’s entry-level DTF printers are affordable, making them great for beginners who want to test the waters.
Mutoh and Roland: These brands provide robust and professional-grade DTF printers for businesses aiming for high-volume output and durability.
Tips for Getting Started with Your New DTF Transfer Film Printer
Experiment with Different Settings: Spend time experimenting with color settings, ink saturation, and heat press temperatures to find the best results for each type of fabric.
Invest in Quality Supplies: Using high-quality transfer film, ink, and adhesive powder can significantly impact the final output quality.
Proper Maintenance: Regular cleaning of the print head and routine maintenance checks will extend the life of your DTF printer and keep it running efficiently.
Stay Updated with Trends: DTF printing technology is evolving, and staying informed about new developments can help you stay competitive in the market.
Conclusion
Choosing the best DTF transfer film printer requires balancing budget, quality, and the specific needs of your business. Take time to research each model, understand the ongoing costs, and consider how each feature will benefit your printing goals. Starting with the right equipment can help you produce quality prints that stand out in a competitive market. With this guide in hand, you're well on your way to making an informed decision and getting the most from your DTF printing investment.
Happy printing!
0 notes
Text
Red vs Blue; A Deep Dive Into The Inner Workings of Lumen.
Blog #2 I also made a presentation for this entire project along with the detailed roadmap and the tools I am planning to use for this project.
And while researching for the presentation I stumbled upon some really interesting articles about how the Lumen system in Unreal Engine works and so the following is my understanding of the entire process of how unreal produces real time renders.
Instead of using traditional rendering methods like ray tracing or path tracing, Epic Games developed a complex and revolutionary technology called hybrid raytracing. It combines the strengths of traditional rasterization and ray tracing techniques to achieve a balance between performance and visual fidelity.
At its very core, lumen uses these 4 techniques to render its levels.
Surface Cache: So suppose you have a scene with a wooden table and a metal knife, and you have imported it into an unreal engine file. Now the engine would make a cache of all the texture information in the scene along with variables like reflectivity and refraction, and then Lumen would use that cache to effectively predict the light interaction with the objects in the scene and this prediction of light interactions allows Lumen to render in real-time.
Screen Space Tracing : Its a process used by Unreal Engine, which basically performs raycasting operations directly on the screenspace instead of world space. So in simple terms, it focuses on one point on the screen instead of the entire environment. This helps create more realistic and detailed images because it's looking at the picture from a much closer perspective. It's like adding more layers of detail to the image, making it look more like the real world.
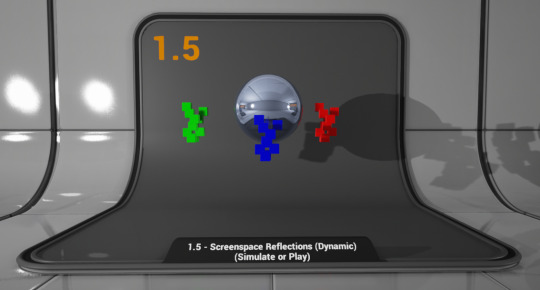
Fig: A visualization of screenspace traycing reflection (1.5 - Screenspace Reflections | Unreal Engine 4.27 Documentation | Epic Developer Community (epicgames.com), accessed on 0ct 8th 2024)
3. Voxel Lighting : Voxel Global Illumination is a tool used by the Unreal engine to create visually stunning and realistic renders of big scenes in real time. When given a big scene the voxel GI breaks it into small grids of voxels and calculates the light interactions within those voxels instead of calculating each individual pixels in the scene.

Fig: A visualization of voxel terrain in Unreal Engine (Voxel Terrain In Unreal Engine 4 Part 2: Generating The Voxels - Garvinized, accessed on 0ct 8th 2024)
4. Distance Fields : So, when you open a scene in unreal engine, it makes a volumetric box around that object, and then it calculates the distance between the surface of the object and the point or the voxel in that box. Now any surface in the object that is on the outside of the model, will be assigned a positive value for, example '+x', whereas any surface that's in the inside of the model will be assigned a negative value, for example '-x'. This gives lumen a gradient of of values between '+x' and '-x' and that information is used to render complex calculations like reflections, soft shadows and refractions.
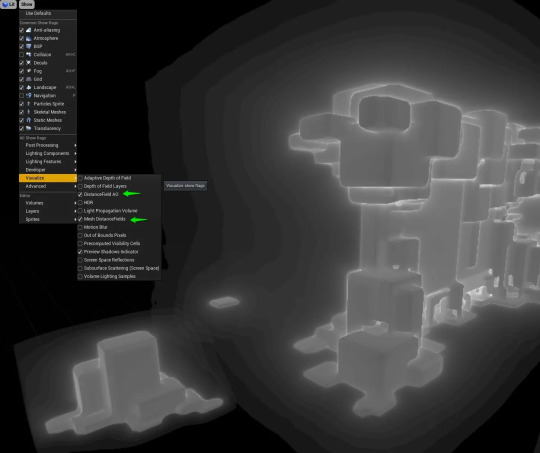
Fig: A visualization of distance fields in Unreal Engine (https://www.tomlooman.com/unreal-engine-distance-fields/, accessed on 0ct 8th 2024) References:
1. Epic Developer Community Forums. (2022). NVRTX 5.0: a review. [online] Available at: https://forums.unrealengine.com/t/nvrtx-5-0-a-review/624958 [Accessed 9 Oct. 2024].
2. NVIDIA Developer Blog. (2020). Rendering Millions of Dynamic Lights in Real-Time. [online] Available at: https://developer.nvidia.com/blog/rendering-millions-of-dynamics-lights-in-realtime/. 3. Unreal Engine 5.4 Raytracing Guide. (2024). Available at: https://dlss.download.nvidia.com/uebinarypackages/Documentation/UE5+Raytracing+Guideline+v5.4.pdf [Accessed 9 Oct. 2024]. 4. www.youtube.com. (n.d.). Lumen Explained - IMPORTANT Tips for UE5. [online] Available at: https://www.youtube.com/watch?v=1e6oOiKh91U.
0 notes
Text
Earth Engine in BigQuery: A New Geospatial SQL Analytics

BigQuery Earth Engine
With Earth Engine directly integrated into BigQuery, Google Cloud has expanded its geographic analytics capabilities. Incorporating powerful raster analytics into BigQuery, this new solution from Google Cloud Next '25 lets SQL users analyse satellite imagery-derived geographical data.
Google Cloud customers prefer BigQueryfor storing and accessing vector data, which represents buildings and boundaries as points, lines, or polygons. Earth Engine in BigQuery is suggested for processing and storing raster data like satellite imagery, which encodes geographic information as a grid of pixels with temperature, height, and land cover values.
“Earth Engine in BigQuery” mixes vector and raster analytics. This integration could improve access to advanced raster analysis and help solve real-world business problems.
Key features driving this integration:
BigQuery's new geography function is ST_RegionStats. This program extracts statistics from raster data inside geographic borders, similar to Earth Engine's reduceRegion function. Use an Earth Engine-accessible raster picture and a geographic region (vector data) to calculate mean, min, max, total, or count for pixels that traverse the geography.
BigQuery Sharing, formerly Analytics Hub, now offers Earth Engine in BigQuery datasets. This makes it easy to find data and access more datasets, many of which are ready for processing to obtain statistics for a region of interest. These datasets may include risk prediction, elevation, or emissions. Raster analytics with this new feature usually has five steps:
Find vector data representing interest areas in a BigQuery table.
In BigQuery image assets, Cloud GeoTiff, or BigQuery Sharing, locate a raster dataset that was created using Earth Engine.
Use ST_RegionStats() with the raster ID, vector geometries, and optional band name to aggregate intersecting data.
To understand, look at ST_RegionStats() output.
Use BigQuery Geo Viz to map analysis results.
This integration enables data-driven decision-making in sustainability and geographic application cases:
Climate, physical risk, and disaster response: Using drought, wildfire, and flood data in transportation, infrastructure, and urban design. For instance, using the Wildfire hazard to Communities dataset to assess wildfire risk or the Global River Flood Hazard dataset to estimate flood risk.
Assessing land-use, elevation, and cover for agricultural evaluations and supply chain management. This includes using JRC Global Forest Cover datasets or Forest Data Partnership maps to determine if commodities are grown in non-deforested areas.
Methane emissions monitoring: MethaneSAT L4 Area Sources data can identify methane emission hotspots from minor, distributed sources in oil and gas basins to enhance mitigation efforts.
Custom use cases: Supporting Earth Engine raster dataset imports into BigQuery image assets or Cloud Storage GeoTiffs.
BigQuery Sharing contains ST_RegionStats()'s raster data sources, where the assets.image.href column normally holds the raster ID for each image table. Cloud Storage GeoTIFFs in the US or US-central1 regions can be used with URIs. Earth Engine image asset locations like ‘ee://IMAGE_PATH’ are supported in BigQuery.
ST_RegionStats()'s include option lets users adjust computations by assigning pixel weights (0–1), with 0 representing missing data. Unless otherwise specified, pixels are weighted by geometry position. Raster pixel size, or scale, affects calculation and output. Changing scale (e.g., using options => JSON ‘{“scale”: 1000}’) can reduce query runtime and cost for prototyping, but it may impact results and should not be used for production analysis.
ST_RegionStats() is charged individually under BigQuery Services since Earth Engine calculates. Costs depend on input rows, raster picture quality, input geography size and complexity, crossing pixels, image projection, and formula usage. Earth Engine quotas in BigQuery slot time utilisation can be changed to control expenses.
Currently, ST_RegionStats() queries must be run in the US, us-central1, or us-central2.
This big improvement in Google Cloud's geospatial analytics provides advanced raster capabilities and improves sustainability and other data-driven decision-making.
#BigQuery#EarthEngine#EarthEngineinBigQuery#GoogleCloud#CloudStorage#News#Technews#Technology#Technologynews#Technologytrends#govindhtech
1 note
·
View note
Text
Game Engine Fundamentals
In the world of game development, the term "game engine" refers to a software framework that developers use to build and create video games. A game engine provides the necessary tools and capabilities to design, develop, and deploy games across various platforms, including consoles, PCs, and mobile devices. Understanding the fundamentals of game engines is crucial for aspiring game developers and designers, especially those looking to enroll in a game design institute in Pune, as it allows them to leverage these tools effectively and create immersive gaming experiences.
#### 1. **What is a Game Engine?**
A game engine is a collection of software components that work together to facilitate game development. These components typically include rendering engines, physics engines, sound engines, scripting engines, and user interface systems. By providing a common platform, game engines enable developers to focus on creating the game content—such as graphics, audio, and gameplay—rather than building the underlying technology from scratch.
#### 2. **Core Components of Game Engines**
- **Rendering Engine:** The rendering engine is responsible for displaying the game’s graphics on the screen. It handles everything from 2D sprites to complex 3D models and animations. It utilizes various techniques like rasterization, lighting, and shading to produce high-quality visuals. Popular rendering engines include OpenGL and DirectX.
- **Physics Engine:** The physics engine simulates real-world physics in the game environment. It calculates how objects interact, including movement, collision detection, and response. This realism is crucial for creating believable gameplay experiences, especially in action and adventure games.
- **Audio Engine:** The audio engine manages sound effects, background music, and voiceovers within a game. It allows for spatial audio, which creates a sense of directionality in sound, enhancing immersion. A robust audio engine can dynamically adjust sounds based on in-game events and player interactions.
- **Scripting Engine:** Scripting engines enable developers to write game logic using high-level programming languages. These scripts dictate how the game behaves, from character movements to event triggers. Common scripting languages include C#, Python, and Lua.
- **User Interface (UI) Systems:** The UI system manages the game's menus, HUD (heads-up display), and other interactive elements. A well-designed UI is essential for providing players with the information they need while enhancing the overall user experience.
#### 3. **Types of Game Engines**
Game engines can be broadly categorized into two types: **2D engines** and **3D engines**.
- **2D Game Engines:** These engines focus on creating two-dimensional games, utilizing sprites and simple physics. They are ideal for platformers, puzzle games, and mobile games. Examples include Unity (with 2D capabilities), Godot, and Cocos2d.
- **3D Game Engines:** These engines are designed for creating three-dimensional games, offering more complex graphics, physics, and interactions. They are used for a wide range of genres, including first-person shooters, RPGs, and simulations. Prominent examples include Unreal Engine, CryEngine, and Unity.
#### 4. **Popular Game Engines**
Several game engines have gained popularity in the industry due to their robust features and ease of use.
- **Unity:** Unity is one of the most widely used game engines, known for its versatility and user-friendly interface. It supports both 2D and 3D game development and has a large community, extensive documentation, and a vast asset store, making it accessible for beginners and professionals alike.
- **Unreal Engine:** Developed by Epic Games, Unreal Engine is renowned for its stunning graphics capabilities and powerful tools. It is often used for AAA games and is favored by developers looking for advanced features like photorealistic rendering and robust physics simulation.
- **Godot:** Godot is an open-source game engine that has gained traction for its lightweight design and user-friendly interface. It supports both 2D and 3D game development and offers a unique scene system that allows developers to create complex games efficiently.
#### 5. **The Game Development Process**
Understanding game engines also involves grasping the game development process. This process typically includes the following stages:
- **Pre-production:** In this stage, developers conceptualize the game, create design documents, and plan the project. Prototyping may also occur to test gameplay mechanics.
- **Production:** This is the most intensive phase, where developers build the game using the selected game engine. Artists create assets, programmers write code, and designers refine gameplay.
- **Testing:** Testing is critical to identify and fix bugs, improve gameplay, and ensure a smooth user experience. This stage often involves playtesting with real users to gather feedback.
- **Release:** After thorough testing and polishing, the game is prepared for launch. This includes marketing efforts to promote the game and attract players.
- **Post-release:** Post-launch support may involve updates, bug fixes, and additional content to keep players engaged and maintain the game's longevity.
#### 6. **Future Trends in Game Engines**
As technology continues to evolve, so do game engines. Emerging trends include the integration of artificial intelligence (AI) for smarter non-player characters (NPCs), enhanced virtual reality (VR) and augmented reality (AR) capabilities, and more robust cloud gaming solutions. These advancements promise to create even more immersive and dynamic gaming experiences in the future.
#### Conclusion
Understanding the fundamentals of game engines is essential for anyone aspiring to work in the game development industry. With their ability to streamline the development process and provide powerful tools for creativity, game engines play a crucial role in bringing engaging and innovative games to life. Whether you’re a programmer, artist, or designer, mastering game engines will enhance your ability to contribute to the exciting world of video game creation. Joining a reputable institution like MAAC Pune can provide aspiring game developers with the knowledge and skills needed to excel in this dynamic field.
0 notes
Text
3D Reconstruction: Capturing the World in Three Dimensions

3D reconstruction refers to the process of capturing the shape and appearance of real objects using specialized scanners and software and converting those scans into digital 3D models. These 3D models allow us to represent real-world objects in virtual 3D space on computers very accurately. The technology behind 3D reconstruction utilizes a variety of different scanning techniques, from laser scanning to photometric stereo, in order to digitally preserve real objects and environments.
History and Early Developments
One of the earliest forms of 3D scanning and reconstruction dates back to the 1960s, when laser range scanning first emerged as a method. Early laser scanners were slow and bulky, but provided a way to accurately capture 3D coordinates from surfaces. In the 1970s and 80s, raster stereo techniques came about, using cameras instead of lasers to capture depth maps of scenes. Over time, scanners got faster, accuracy improved, and multiple scanning technologies started to converge into unified 3D modeling pipelines. By the 1990s, digitizing entire buildings or archeological sites became possible thanks to the increased capabilities of 3D reconstruction tools and hardware.
Photogrammetry and Structure from Motion
One major development that helped accelerate 3D Reconstruction was the emergence of photogrammetry techniques. Photogrammetry uses 2D imagery, often from consumer cameras, to extract 3D geometric data. Structure from motion algorithms allow one to take unordered image collections, determine overlapping features across images, and reconstruct the camera positions and a sparse 3D point cloud. These image-based methods paved the way for reconstructing larger exterior environments accurately and cheaply compared to laser scanners alone. Photogrammetry is now a widely used technique for cultural heritage documentation, architecture projects, and even film/game production.
Integral 3D Scanning Technologies
Today there are many 3D scanning technologies in use for different types of objects and environments. Structured light scanning projects patterns of lines or dots onto surfaces and reads distortions from a camera to calculate depth. It works well for industrial inspection, small objects and scanning interiors with controlled lighting. Laser scanning uses time-of-flight or phase-shift measurements to rapidly capture millions of precise 3D data points. Laser scanners excel at large outdoor environments like cultural heritage sites, construction projects and full building documentation. Multi-view stereo and photometric stereo algorithms fuse together image collections into full and detailed 3D reconstructions even with untextured surfaces.
Applications in Mapping and Modeling
3D reconstruction mapping applications are widespread. Cultural heritage sites are extensively documented with 3D models to make high resolution digital archives and share artifacts globally online. Forensic reconstruction of accident or crime scenes relies on 3D modeling to understand what happened. Engineering companies use 3D scans to digitally inspect parts for quality control. Manufacturers design products in CAD but validate and improve designs with physical prototypes that are 3D scanned. Cities are mapped in 3D with aerial and mobile scanning to plan infrastructure projects or monitor urban development over time. The gaming and animation industries also reconstruct detailed digital environments, objects and characters for immersive 3D experiences. Advancing computing power allows more complex reconstructions than ever before across many industries.
Ongoing Developments and the Future of 3D
There is continued work to improve the speed, resolution, automation and scaling of 3D acquisition techniques. Multi-sensor fusion and simultaneous localization and mapping (SLAM) is leading to capabilities like interior mapping with handheld scanners. Artificial intelligence and deep learning are also entering the field with applications like automatically registering separate scans or recognizing objects in 3D data. On the modeling side, semantics and building information models (BIM) are merging geometric shapes with metadata, properties and relationships. Advances will open the door to dynamic 3D representations that change over time, interaction with virtual objects through augmented reality and further immersive experiences in artificial worlds reconstructed from real environments. The future vision is seamlessly integrating virtual 3D spaces with our daily physical world.
Get more insights on 3D Reconstruction
About Author:
Money Singh is a seasoned content writer with over four years of experience in the market research sector. Her expertise spans various industries, including food and beverages, biotechnology, chemical and materials, defense and aerospace, consumer goods, etc. (https://www.linkedin.com/in/money-singh-590844163)
#3DReconstruction#ComputerVision#ImagingTechnology#SpatialData#DigitalModeling#Photogrammetry#PointClouds#3DScanning
0 notes
Text
Okay so not really 1 or 2 but somewhere in between.
After ONE TERM (so like idk 10-12 weeks) of year 9 computing, my teacher started pushing "what about year 11/12!?" at Parent/Teacher interviews.
(This wasn't exactly a complete surprise looking back - family background in tech, personal interests in digital art and multimedia, etc etc. Kinda walked into it.)
So somehow - they made it happen. First day of year 10, I had a complicated timetable to make my year 11 subject work. All very PoA Hermione vibes, minus an actual time turner. Walked into that classroom with all the kids from the year above, because of course it was their class. Fair enough.
"Sit on this side of the room if you want to do Software Development and Programming," one of the teachers said. "Or sit on that side of the room if you want to do Information Processes and Technology"
(We had two teachers of course because two classes - lovely husband-wife couple. Both individually awesome teachers, too.)
GUESS WHO'S THE ONLY PERSON SITTING ON THE INFORMATION PROCESSES SIDE OF THE ROOM. YUP. ITS ME.
So for like the first year of the course I'm pretty much the only one in the class - which is fine, it made it really good for one-on-one tutoring. (That thing where I said the teachers were awesome? It also meant that she got the opportunity to share and explain a whole heap of study techniques. Do little funky tests to help determine what colours help me retain information better [yellow, with orange as a secondary], little movement things to do before and after a study session. Which sounds like she was making it easy but like lol no she was also NOTORIOUS for making her exams so difficult that you literally were not meant to finish them in the time allocated. She got both me and the other student that joined us later on to get twitter to make us ask or answer questions with that enforced 120 character limit. She was actually amazing in terms of "here's some things to help you" but equally "I'm going to push your limits".)
Technically still one of my best classes, and all jokes aside I think it actually was something that has so much fundamental use in my everyday life - both personal and professional - that I would without a second thought do it all over again. Stupid 8pt textbook and all.
[we covered all sorts of stuff like databases and html, binary which you had to learn how to calculate manually because they didn't let you take calculators into that exam, and we focused on multimedia in depth for the final year which meant we covered all sorts of stuff like analogue media vs digital media, how things like fibre optics and bandwidth work, the difference of file formats and raster vs vector. There's just SO MUCH that is so applicable to stuff today I'm really sad they didn't run it for my actual year group.]
little joel on youtube got me wondering what the percentage is actually like. please reblog so i can get more responses and thus a more representative data pool for my demographic of "people who use tumblr in 2023"
#There's also the Extension Japanese thing but that was just me being a fucking nerd#'saved for kids who go on exchange'#still manages to get offered to take the class anyway#ironically that created a sort of paradox of standard Japanese class too easy but extension Japanese v hard#there is no winning we know that by now don't we kajhsdhf#computing#study#school
7K notes
·
View notes