#simple linear regression
Explore tagged Tumblr posts
Visit Tumblr Blog
Explore Tumblr blogs with no restrictions, modern design and the best experience.
Last Seen Tumblr Blogs


Fun Fact
There are dozens of funny blogs to kill time on Tumblr.
Text
just spent three hours looking for proper statistical tests to do only to come up with my original idea again #hellishexperience
#daily warning to not take ap research#not socs#ap research#ended up deciding on both types of t-tests and simple linear regression#Bc my data wouldn’t Nawt cooperate with spearman’s or kendall’s#AND DONT EVEN GET ME STARTED KN THE MANN WHITNEY U TEST AND THE KRISKALL WWAWAWA WTV#sorry guys im going through it rn#Data is due next month 💔
11 notes
·
View notes
Text
things to do while regressed ✩
something i hear a lot is littles feeling bored or not knowing what to do while regressed, so here are some things i do that may help u ^_^

🎶 - watching nostalgic youtube videos !
youtubers such as fgteev , popularmmos , little kelly, aphmau, markiplier and game theory are all super nostalgic content creators for me,.,
my regression is very big on childhood + 2010s nostalgia, so making playlists with video game songs, mlp songs, and other nostalgic songs to listen to while i color is soemthing i luvv to do!!
🧁 - play roblox + other kids games ^_^
playing games like adopt me, piggy or hello kitty cafe are super fun to do while regressed!! other games i like to play that aren't necessarily kids games r dandys world and regretevator !!
💫 - take a nap >w<
this ones simple but one i do quite commonly, especially when im regressing due to burnout or stress ! just falling asleep with lullaby music and a paci can be soooo calming and make u feel loads better !
🍰 - play with toys !
making storylines with your toys can be sssooo fun!! especially when u have other little friends + friends that are willing to play with u.,, besides from the obvious plushies, other toys i play with are shopkins , my little ponies, blues clues + octonauts figures , an video game trinkets !! >w<
🧃 - listen to lullabies / asmr >w<
piano lullabies + agere asmr ar soooo comforting while regressed and are great background noise even if i dont wanna go to bed just yet !! i recommend fidning some u like and making a playlist on youtube or spotify C:

your regression is valid , you are safe here and healing isnt linear 🩷

#age regression#age regressor#agere blog#agere community#agere caregiver#safe agere#sfw agere#agere little#fandom agere#age regression sfw#age regression blog#age regressing
21 notes
·
View notes
Text
Executive summary
If you wanted to show the American public that the COVID vaccines saved lives, the easiest proof is to plot each state (or county) based on its vaccination rate (x axis) and its change in mortality from pre-vaccination baseline on the y-axis.
I did this. The slope is positive.
This means that more vaccinations are associated with higher mortality.
Can this be challenged?
I don’t think so.
The data is the data. They can’t change it. And there is only one way to draw a line through the data. If the shots worked, the slope would be strongly negative and it’s not.
This is likely why not a single paper attempts to do the most obvious analysis. They probably did it, saw that it was not supporting the narrative, and then decided not to publish.
Results for state regression and county regression
The slope was positive and statistically significant for both the state and county analysis. This means that the COVID vaccines did the opposite of what they promised: it increased your risk of death.
The R2 value of .31 is quite spectacular and it means this isn’t an accident.
21 notes
·
View notes
Note
wanted to contribute to your otome AU brainrot by proposing a complete alternate take on the oneshot + another au
So the Apple does some real fucky wucky stuff in that Desmond isn't the only one stuck in the game like the team assumes
Nay, every love interest's soul too is locked within this game, all of them have the game description as well as notes of their own roles, and it seems simple, they're stuck in a game with two-dimensional characters
the conditions of escape are only half dependent on them
Desmond achieves 30% approval from them (something they can't fool the game on) and since this Desmond isn't real either, but they also need him to escape, and cannot fool the game, they simply accept the game as it is
Until they notice ... discrepencies in one another and realize, wait ... who said I was the only one stuck in here??
And Rebecca is like "I did NAWT program that! 💀💀💀" but everybody is watching eachother to make the first move while they figure out who is an isn't a person
for drama we could extend the game itself, either pre or post picking an escort so there's more time to investigate and confront others, plus the fact time isn't linear in this game and will timeskip itself could make for miscommunication or whatnot
======
Alternate Alternate Universe, instead of being isekaied into the game, they instead reincarnate in post-mortem into a legit fantasy world
Maybe it's instant, or some time after birth they remember everything, or a mix of both, but they have memories of their first and new lives and are like "alright lets use my first life to my advantage for my second one"
Not knowing there are other reincarnators running around, plot ensues
The otome AU oneshot that I’m planning to write a sequel soon-ish (if Eagle of Alamut cooperated with me XD): Badump Animus Destiny
So, for this one, Desmond transmigrated to what he assumed was Rebecca’s otome game but turned out to be an actual fantasy world that the Animus had ‘tuned into’ to create Rebecca’s story.
The others though have already went through this game once.
To be more exact, all of them remembers their first life where Desmond got a bad ending and died in front of them.
When they woke up, they remember their first life AND also their lives as an Assassin.
So, in this case, Desmond is just continuing what he assumes is Rebecca’s game while the others have actually regressed and have different plans to get their happy endings.
All of them don’t realize that there are other regressors and a trasmigrator because they believed that the changes made by the others are butterfly effects in motion.
Desmond thinks this ‘game’ is making him have otome worthy moments with everyone because that’s the genre of the game.
The truth is that all regressors are in love with Desmond and all those moments happen because they want to be with him.
This will also put a lot of angst in place when Desmond learns that all of them are carrying a torch for another Desmond and he would think he was meant to be a replacement in their eyes.
.
The easy way out of this is that Desmond is actually a regressor too. Unfortunately, he regressed after his death in the first timeline and that’s why he doesn’t remember that he was the Desmond that everyone lost. It’s actually more accurate to say that when time rewinded, Desmond’s memories rewinded as well.
The hard way is that the endgame pairing will be the one who pushes past their love for the Desmond of the previous timeline and learn to love this Desmond as himself, not as a replacement.
33 notes
·
View notes
Text
Simple Linear Regression in Data Science and machine learning
Simple linear regression is one of the most important techniques in data science and machine learning. It is the foundation of many statistical and machine learning models. Even though it is simple, its concepts are widely applicable in predicting outcomes and understanding relationships between variables.
This article will help you learn about:
1. What is simple linear regression and why it matters.
2. The step-by-step intuition behind it.
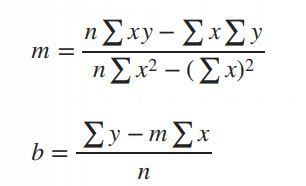
3. The math of finding slope() and intercept().
4. Simple linear regression coding using Python.
5. A practical real-world implementation.
If you are new to data science or machine learning, don’t worry! We will keep things simple so that you can follow along without any problems.
What is simple linear regression?
Simple linear regression is a method to model the relationship between two variables:
1. Independent variable (X): The input, also called the predictor or feature.
2. Dependent Variable (Y): The output or target value we want to predict.
The main purpose of simple linear regression is to find a straight line (called the regression line) that best fits the data. This line minimizes the error between the actual and predicted values.
The mathematical equation for the line is:
Y = mX + b
: The predicted values.
: The slope of the line (how steep it is).
: The intercept (the value of when).
Why use simple linear regression?
click here to read more https://datacienceatoz.blogspot.com/2025/01/simple-linear-regression-in-data.html
#artificial intelligence#bigdata#books#machine learning#machinelearning#programming#python#science#skills#big data#linear algebra#linear b#slope#interception
6 notes
·
View notes
Text
Python Libraries to Learn Before Tackling Data Analysis
To tackle data analysis effectively in Python, it's crucial to become familiar with several libraries that streamline the process of data manipulation, exploration, and visualization. Here's a breakdown of the essential libraries:
1. NumPy
- Purpose: Numerical computing.
- Why Learn It: NumPy provides support for large multi-dimensional arrays and matrices, along with a collection of mathematical functions to operate on these arrays efficiently.
- Key Features:
- Fast array processing.
- Mathematical operations on arrays (e.g., sum, mean, standard deviation).
- Linear algebra operations.
2. Pandas
- Purpose: Data manipulation and analysis.
- Why Learn It: Pandas offers data structures like DataFrames, making it easier to handle and analyze structured data.
- Key Features:
- Reading/writing data from CSV, Excel, SQL databases, and more.
- Handling missing data.
- Powerful group-by operations.
- Data filtering and transformation.
3. Matplotlib
- Purpose: Data visualization.
- Why Learn It: Matplotlib is one of the most widely used plotting libraries in Python, allowing for a wide range of static, animated, and interactive plots.
- Key Features:
- Line plots, bar charts, histograms, scatter plots.
- Customizable charts (labels, colors, legends).
- Integration with Pandas for quick plotting.
4. Seaborn
- Purpose: Statistical data visualization.
- Why Learn It: Built on top of Matplotlib, Seaborn simplifies the creation of attractive and informative statistical graphics.
- Key Features:
- High-level interface for drawing attractive statistical graphics.
- Easier to use for complex visualizations like heatmaps, pair plots, etc.
- Visualizations based on categorical data.
5. SciPy
- Purpose: Scientific and technical computing.
- Why Learn It: SciPy builds on NumPy and provides additional functionality for complex mathematical operations and scientific computing.
- Key Features:
- Optimized algorithms for numerical integration, optimization, and more.
- Statistics, signal processing, and linear algebra modules.
6. Scikit-learn
- Purpose: Machine learning and statistical modeling.
- Why Learn It: Scikit-learn provides simple and efficient tools for data mining, analysis, and machine learning.
- Key Features:
- Classification, regression, and clustering algorithms.
- Dimensionality reduction, model selection, and preprocessing utilities.
7. Statsmodels
- Purpose: Statistical analysis.
- Why Learn It: Statsmodels allows users to explore data, estimate statistical models, and perform tests.
- Key Features:
- Linear regression, logistic regression, time series analysis.
- Statistical tests and models for descriptive statistics.
8. Plotly
- Purpose: Interactive data visualization.
- Why Learn It: Plotly allows for the creation of interactive and web-based visualizations, making it ideal for dashboards and presentations.
- Key Features:
- Interactive plots like scatter, line, bar, and 3D plots.
- Easy integration with web frameworks.
- Dashboards and web applications with Dash.
9. TensorFlow/PyTorch (Optional)
- Purpose: Machine learning and deep learning.
- Why Learn It: If your data analysis involves machine learning, these libraries will help in building, training, and deploying deep learning models.
- Key Features:
- Tensor processing and automatic differentiation.
- Building neural networks.
10. Dask (Optional)
- Purpose: Parallel computing for data analysis.
- Why Learn It: Dask enables scalable data manipulation by parallelizing Pandas operations, making it ideal for big datasets.
- Key Features:
- Works with NumPy, Pandas, and Scikit-learn.
- Handles large data and parallel computations easily.
Focusing on NumPy, Pandas, Matplotlib, and Seaborn will set a strong foundation for basic data analysis.
8 notes
·
View notes
Text
Long-term effects of COVID-19 on endothelial function, arterial stiffness, and blood pressure in college students: a pre-post-controlled study - Published July 27, 2024
Abstract
Background
The COVID-19 has been shown to have negative effects on the cardiovascular system, but it is unclear how long these effects last in college students. This study aimed to assess the long-term impact of COVID-19 on arterial stiffness, endothelial function, and blood pressure in college students.
Methods
We enrolled 37 college students who had been infected with COVID-19 for more than 2 months. Brachial artery flow-mediated dilation (FMD) was used to assess endothelial function, while arterial stiffness was evaluated using the ABI Systems 100, including variables such as ankle-brachial index (ABI), brachial-ankle pulse wave velocity (baPWV), carotid-femoral pulse wave velocity (cfPWV), heart rate (HR), and blood pressure (BP).
Results
Our results showed that FMD was significantly impaired after COVID-19 infection (p < 0.001), while cfPWV and systolic blood pressure (SBP) were significantly increased (p < 0.05). Simple linear regression models revealed a significant negative correlation between post-COVID-19 measurement time and baPWV change (p < 0.01), indicating an improvement in arterial stiffness over time. However, there was a significant positive correlation between post-COVID-19 measurement time and diastolic blood pressure (DBP) change (p < 0.05), suggesting an increase in BP over time. There were no significant differences in ABI and HR between pre- and post-COVID-19 measurements, and no significant correlations were observed with other variables (p > 0.05). Conclusion: Our study demonstrated that COVID-19 has long-term detrimental effects on vascular function in college students. However, arterial stiffness tends to improve over time, while BP may exhibit the opposite trend.
#long covid#covid#mask up#pandemic#covid 19#coronavirus#wear a mask#sars cov 2#still coviding#public health#wear a respirator
14 notes
·
View notes
Text
How to Become a Data Scientist in 2025 (Roadmap for Absolute Beginners)

Want to become a data scientist in 2025 but don’t know where to start? You’re not alone. With job roles, tech stacks, and buzzwords changing rapidly, it’s easy to feel lost.
But here’s the good news: you don’t need a PhD or years of coding experience to get started. You just need the right roadmap.
Let’s break down the beginner-friendly path to becoming a data scientist in 2025.
✈️ Step 1: Get Comfortable with Python
Python is the most beginner-friendly programming language in data science.
What to learn:
Variables, loops, functions
Libraries like NumPy, Pandas, and Matplotlib
Why: It’s the backbone of everything you’ll do in data analysis and machine learning.
🔢 Step 2: Learn Basic Math & Stats
You don’t need to be a math genius. But you do need to understand:
Descriptive statistics
Probability
Linear algebra basics
Hypothesis testing
These concepts help you interpret data and build reliable models.
📊 Step 3: Master Data Handling
You’ll spend 70% of your time cleaning and preparing data.
Skills to focus on:
Working with CSV/Excel files
Cleaning missing data
Data transformation with Pandas
Visualizing data with Seaborn/Matplotlib
This is the “real work” most data scientists do daily.
🧬 Step 4: Learn Machine Learning (ML)
Once you’re solid with data handling, dive into ML.
Start with:
Supervised learning (Linear Regression, Decision Trees, KNN)
Unsupervised learning (Clustering)
Model evaluation metrics (accuracy, recall, precision)
Toolkits: Scikit-learn, XGBoost
🚀 Step 5: Work on Real Projects
Projects are what make your resume pop.
Try solving:
Customer churn
Sales forecasting
Sentiment analysis
Fraud detection
Pro tip: Document everything on GitHub and write blogs about your process.
✏️ Step 6: Learn SQL and Databases
Data lives in databases. Knowing how to query it with SQL is a must-have skill.
Focus on:
SELECT, JOIN, GROUP BY
Creating and updating tables
Writing nested queries
🌍 Step 7: Understand the Business Side
Data science isn’t just tech. You need to translate insights into decisions.
Learn to:
Tell stories with data (data storytelling)
Build dashboards with tools like Power BI or Tableau
Align your analysis with business goals
🎥 Want a Structured Way to Learn All This?
Instead of guessing what to learn next, check out Intellipaat’s full Data Science course on YouTube. It covers Python, ML, real projects, and everything you need to build job-ready skills.
https://www.youtube.com/watch?v=rxNDw68XcE4
🔄 Final Thoughts
Becoming a data scientist in 2025 is 100% possible — even for beginners. All you need is consistency, a good learning path, and a little curiosity.
Start simple. Build as you go. And let your projects speak louder than your resume.
Drop a comment if you’re starting your journey. And don’t forget to check out the free Intellipaat course to speed up your progress!
2 notes
·
View notes
Text


19-03-2024, Tuesday, Day 2/100
Finals are 5 weeks away and my anxiety is off the roof. Today's Productivity List:
Simple Linear Regression: for 4 hours. note-taking and practice problems.
Correlation: Still studying. Might take 3 hours or so. Again note-taking and practice problems.
Slept full 8 hours.
tag me --> #altinstudies
Been on hiatus for too long. DM me, folks 🥺
#altin posts#studyspo#study aesthetic#studyblr#aes#study hard#studying#datablr#statblr#astudentslifebuoy#study motivation#somuchtostudysolittletime#myhoneststudyblr#problematicprocrastinator#heyfrithams#diaryofastemstudent#100 days of productivity#100 days of studying#100dop
19 notes
·
View notes
Text
Did R0 go up?
R0, which is the reproductive number, is a measure of how fast a virus replicates. Reducing the risk of infection and transmission both lower R0 leading to lower peaks and a longer infection time which doesn’t overwhelm medical care. That was the goal of these shots.
Here’s your answer, courtesy of Israel, one of the most vaccinated places on earth.
A spike like the one above to 60,000 cases per million people is a clear signal that means R0 was increased relative to the 75% vaccinated US.
The slope and the height are dead giveaways of a higher R0.
There is no hiding from this data. It’s been in plain sight for years if anyone looks.
How R0 affects the shape of a virus outbreak
As the Israel data clearly shows, R0 was increased by heavy vaccination.
Because the infection fatality rate went up too as I showed earlier by looking at case fatality rates (CFR) in the nursing home before vs. after vaccine rollout (a “longitudinal analysis”), all these countries KILLED people.This is how a virus spreads. The higher R0, the higher the peak, the more people who are infected and the sharper the shape. This is why the Omicron spike in Israel was a crystal clear signal that the vaccine increased R0. Israel should have had the flattest curve in the world if the vaccine worked.
Other studies
The Cleveland Clinic (CC) study and the second CC study showed the vaccines increased your risk of contracting COVID. Other studies found the same effect: here, here, here, here, here, here, here.
A new Japan study confirmed the CC results that more vaccines→more cases: “The odds of contracting COVID-19 increased with the number of vaccine doses: one to two doses (OR: 1.63, 95% CI: 1.08-2.46, p = 0.020), three to four doses (OR: 2.04, 95% CI: 1.35-3.08, p = 0.001), and five to seven doses (OR: 2.21, 95% CI: 1.07-4.56, p = 0.033).” This is consistent with Table 2 in the CC study.
I’ve done simple linear regression on the US data as well and the slopes are all positive (meaning it increases your risk of getting infected).
The answer to the poll was B
Choice B was the data from all the sites in the least 5 highly vaccinated states in the US. The peaks are lower.
You can click each image to see the states included in the image.
Summary
The Phase 3 clinical trials were a fraud.
Your government lied to you.
The wastewater data is dispositive: the vaccine did not lower R0. If anything, it increased it as you can clearly see from the Israel data. If the vaccine worked, they wouldn’t have the highest peak in the world; they’d have the lowest.
Isn’t it great what you can learn if you can read the wastewater tea leaves?
Now you know why all the health authorities avoid this topic.
6 notes
·
View notes
Text
What are the skills needed for a data scientist job?
It’s one of those careers that’s been getting a lot of buzz lately, and for good reason. But what exactly do you need to become a data scientist? Let’s break it down.
Technical Skills
First off, let's talk about the technical skills. These are the nuts and bolts of what you'll be doing every day.
Programming Skills: At the top of the list is programming. You’ll need to be proficient in languages like Python and R. These are the go-to tools for data manipulation, analysis, and visualization. If you’re comfortable writing scripts and solving problems with code, you’re on the right track.
Statistical Knowledge: Next up, you’ve got to have a solid grasp of statistics. This isn’t just about knowing the theory; it’s about applying statistical techniques to real-world data. You’ll need to understand concepts like regression, hypothesis testing, and probability.
Machine Learning: Machine learning is another biggie. You should know how to build and deploy machine learning models. This includes everything from simple linear regressions to complex neural networks. Familiarity with libraries like scikit-learn, TensorFlow, and PyTorch will be a huge plus.
Data Wrangling: Data isn’t always clean and tidy when you get it. Often, it’s messy and requires a lot of preprocessing. Skills in data wrangling, which means cleaning and organizing data, are essential. Tools like Pandas in Python can help a lot here.
Data Visualization: Being able to visualize data is key. It’s not enough to just analyze data; you need to present it in a way that makes sense to others. Tools like Matplotlib, Seaborn, and Tableau can help you create clear and compelling visuals.
Analytical Skills
Now, let’s talk about the analytical skills. These are just as important as the technical skills, if not more so.
Problem-Solving: At its core, data science is about solving problems. You need to be curious and have a knack for figuring out why something isn’t working and how to fix it. This means thinking critically and logically.
Domain Knowledge: Understanding the industry you’re working in is crucial. Whether it’s healthcare, finance, marketing, or any other field, knowing the specifics of the industry will help you make better decisions and provide more valuable insights.
Communication Skills: You might be working with complex data, but if you can’t explain your findings to others, it’s all for nothing. Being able to communicate clearly and effectively with both technical and non-technical stakeholders is a must.
Soft Skills
Don’t underestimate the importance of soft skills. These might not be as obvious, but they’re just as critical.
Collaboration: Data scientists often work in teams, so being able to collaborate with others is essential. This means being open to feedback, sharing your ideas, and working well with colleagues from different backgrounds.
Time Management: You’ll likely be juggling multiple projects at once, so good time management skills are crucial. Knowing how to prioritize tasks and manage your time effectively can make a big difference.
Adaptability: The field of data science is always evolving. New tools, techniques, and technologies are constantly emerging. Being adaptable and willing to learn new things is key to staying current and relevant in the field.
Conclusion
So, there you have it. Becoming a data scientist requires a mix of technical prowess, analytical thinking, and soft skills. It’s a challenging but incredibly rewarding career path. If you’re passionate about data and love solving problems, it might just be the perfect fit for you.
Good luck to all of you aspiring data scientists out there!
#artificial intelligence#career#education#coding#jobs#programming#success#python#data science#data scientist#data security
9 notes
·
View notes
Text

Econometrics Demystified: The Ultimate Compilation of Top 10 Study Aids
Welcome to the world of econometrics, where economic theories meet statistical methods to analyze and interpret data. If you're a student navigating through the complexities of econometrics, you know how challenging it can be to grasp the intricacies of this field. Fear not! This blog is your ultimate guide to the top 10 study aids that will demystify econometrics and make your academic journey smoother.
Economicshomeworkhelper.com – Your Go-To Destination
Let's kick off our list with the go-to destination for all your econometrics homework and exam needs – https://www.economicshomeworkhelper.com/. With a team of experienced experts, this website is dedicated to providing high-quality assistance tailored to your specific requirements. Whether you're struggling with regression analysis or hypothesis testing, the experts at Economicshomeworkhelper.com have got you covered. When in doubt, remember to visit the website and say, "Write My Econometrics Homework."
Econometrics Homework Help: Unraveling the Basics
Before delving into the intricacies, it's crucial to build a strong foundation in the basics of econometrics. Websites offering econometrics homework help, such as Khan Academy and Coursera, provide comprehensive video tutorials and interactive lessons to help you grasp fundamental concepts like linear regression, correlation, and statistical inference.
The Econometrics Academy: Online Courses for In-Depth Learning
For those seeking a more immersive learning experience, The Econometrics Academy offers online courses that cover a wide range of econometrics topics. These courses, often led by seasoned professors, provide in-depth insights into advanced econometric methods, ensuring you gain a deeper understanding of the subject.
"Mastering Metrics" by Joshua D. Angrist and Jörn-Steffen Pischke
No compilation of study aids would be complete without mentioning authoritative books, and "Mastering Metrics" is a must-read for econometrics enthusiasts. Authored by two renowned economists, Joshua D. Angrist and Jörn-Steffen Pischke, this book breaks down complex concepts into digestible chapters, making it an invaluable resource for both beginners and advanced learners.
Econometrics Forums: Join the Conversation
Engaging in discussions with fellow econometrics students and professionals can enhance your understanding of the subject. Platforms like Econometrics Stack Exchange and Reddit's econometrics community provide a space for asking questions, sharing insights, and gaining valuable perspectives. Don't hesitate to join the conversation and expand your econometrics network.
Gretl: Your Free Econometrics Software
Practical application is key in econometrics, and Gretl is the perfect tool for hands-on learning. This free and open-source software allows you to perform a wide range of econometric analyses, from simple regressions to advanced time-series modeling. Download Gretl and take your econometrics skills to the next level.
Econometrics Journal Articles: Stay Updated
Staying abreast of the latest developments in econometrics is essential for academic success. Explore journals such as the "Journal of Econometrics" and "Econometrica" to access cutting-edge research and gain insights from scholars in the field. Reading journal articles not only enriches your knowledge but also equips you with the latest methodologies and approaches.
Econometrics Bloggers: Learn from the Pros
Numerous econometrics bloggers share their expertise and experiences online, offering valuable insights and practical tips. Follow blogs like "The Unassuming Economist" and "Econometrics by Simulation" to benefit from the expertise of professionals who simplify complex econometric concepts through real-world examples and applications.
Econometrics Software Manuals: Master the Tools
While software like STATA, R, and Python are indispensable for econometric analysis, navigating through them can be challenging. Refer to comprehensive manuals and documentation provided by these software platforms to master their functionalities. Understanding the tools at your disposal will empower you to apply econometric techniques with confidence.
Econometrics Webinars and Workshops: Continuous Learning
Finally, take advantage of webinars and workshops hosted by academic institutions and industry experts. These events provide opportunities to deepen your knowledge, ask questions, and engage with professionals in the field. Check out platforms like Econometric Society and DataCamp for upcoming events tailored to econometrics enthusiasts.
Conclusion
Embarking on your econometrics journey doesn't have to be daunting. With the right study aids, you can demystify the complexities of this field and excel in your academic pursuits. Remember to leverage online resources, engage with the econometrics community, and seek assistance when needed. And when the workload becomes overwhelming, don't hesitate to visit Economicshomeworkhelper.com and say, "Write My Econometrics Homework" – your trusted partner in mastering econometrics. Happy studying!
13 notes
·
View notes
Text
Beginner’s Guide to Ridge Regression in Machine Learning
Introduction
Regression analysis is a fundamental technique in machine learning, used to predict a dependent variable based on one or more independent variables. However, traditional regression methods, such as simple linear regression, can struggle to deal with multicollinearity (high correlation between predictors). This is where ridge regression comes in handy.
Ridge regression is an advanced form of linear regression that reduces overfitting by adding a penalty term to the model. In this article, we will cover what ridge regression is, why it is important, how it works, its assumptions, and how to implement it using Python.
What is Ridge Regression?
Ridge regression is a type of regularization technique that modifies the linear
click here to read more
https://datacienceatoz.blogspot.com/2025/02/a-beginners-guide-to-ridge-regression.html
#artificial intelligence#bigdata#books#machine learning#machinelearning#programming#python#science#skills#big data
4 notes
·
View notes
Text
a Basic Linear Regression Model
What is linear regression?
Linear regression analysis is used to predict the value of a variable based on the value of another variable. The variable you want to predict is called the dependent variable. The variable you are using to predict the other variable's value is called the independent variable.
This form of analysis estimates the coefficients of the linear equation, involving one or more independent variables that best predict the value of the dependent variable. Linear regression fits a straight line or surface that minimizes the discrepancies between predicted and actual output values. There are simple linear regression calculators that use a “least squares” method to discover the best-fit line for a set of paired data. You then estimate the value of X (dependent variable)
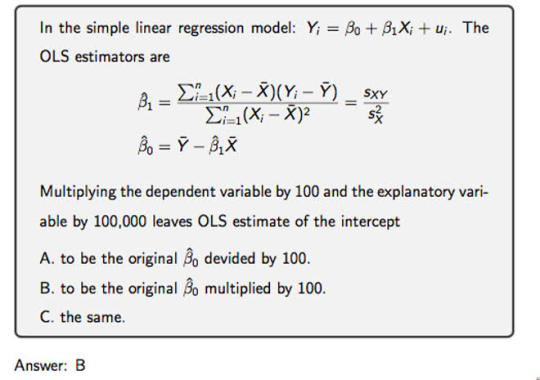
n statistics, simple linear regression (SLR) is a linear regression model with a single explanatory variable.[1][2][3][4][5] That is, it concerns two-dimensional sample points with one independent variable and one dependent variable (conventionally, the x and y coordinates in a Cartesian coordinate system) and finds a linear function (a non-vertical straight line) that, as accurately as possible, predicts the dependent variable values as a function of the independent variable. The adjective simple refers to the fact that the outcome variable is related to a single predictor.
It is common to make the additional stipulation that the ordinary least squares (OLS) method should be used: the accuracy of each predicted value is measured by its squared residual (vertical distance between the point of the data set and the fitted line), and the goal is to make the sum of these squared deviations as small as possible. In this case, the slope of the fitted line is equal to the correlation between y and x corrected by the ratio of standard deviations of these variables. The intercept of the fitted line is such that the line passes through the center of mass (x, y) of the data points.
Formulation and computation
[edit]
This relationship between the true (but unobserved) underlying parameters α and β and the data points is called a linear regression model.
Here we have introduced
x¯ and y¯ as the average of the xi and yi, respectively
Δxi and Δyi as the deviations in xi and yi with respect to their respective means.
Expanded formulas
[edit]
Interpretation
[edit]
Relationship with the sample covariance matrix
[edit]
where
rxy is the sample correlation coefficient between x and y
sx and sy are the uncorrected sample standard deviations of x and y
sx2 and sx,y are the sample variance and sample covariance, respectively
Interpretation about the slope
[edit]
Interpretation about the intercept
Interpretation about the correlation
[edit]
Numerical properties
[edit]
The regression line goes through the center of mass point, (x¯,y¯), if the model includes an intercept term (i.e., not forced through the origin).
The sum of the residuals is zero if the model includes an intercept term:∑i=1nε^i=0.
The residuals and x values are uncorrelated (whether or not there is an intercept term in the model), meaning:∑i=1nxiε^i=0
The relationship between ρxy (the correlation coefficient for the population) and the population variances of y (σy2) and the error term of ϵ (σϵ2) is:[10]: 401 σϵ2=(1−ρxy2)σy2For extreme values of ρxy this is self evident. Since when ρxy=0 then σϵ2=σy2. And when ρxy=1 then σϵ2=0.
Statistical properties
[edit]
Description of the statistical properties of estimators from the simple linear regression estimates requires the use of a statistical model. The following is based on assuming the validity of a model under which the estimates are optimal. It is also possible to evaluate the properties under other assumptions, such as inhomogeneity, but this is discussed elsewhere.[clarification needed]
Unbiasedness
[edit]
Variance of the mean response
[edit]
where m is the number of data points.
Variance of the predicted response
[edit]
Further information: Prediction interval
Confidence intervals
[edit]
The standard method of constructing confidence intervals for linear regression coefficients relies on the normality assumption, which is justified if either:
the errors in the regression are normally distributed (the so-called classic regression assumption), or
the number of observations n is sufficiently large, in which case the estimator is approximately normally distributed.
The latter case is justified by the central limit theorem.
Normality assumption
[edit]


Asymptotic assumption
[edit]
The alternative second assumption states that when the number of points in the dataset is "large enough", the law of large numbers and the central limit theorem become applicable, and then the distribution of the estimators is approximately normal. Under this assumption all formulas derived in the previous section remain valid, with the only exception that the quantile t*n−2 of Student's t distribution is replaced with the quantile q* of the standard normal distribution. Occasionally the fraction 1/n−2 is replaced with 1/n. When n is large such a change does not alter the results appreciably.
Numerical example
[edit]
See also: Ordinary least squares §��Example, and Linear least squares § Example
Alternatives
[edit]Calculating the parameters of a linear model by minimizing the squared error.
In SLR, there is an underlying assumption that only the dependent variable contains measurement error; if the explanatory variable is also measured with error, then simple regression is not appropriate for estimating the underlying relationship because it will be biased due to regression dilution.
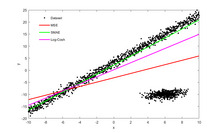
Other estimation methods that can be used in place of ordinary least squares include least absolute deviations (minimizing the sum of absolute values of residuals) and the Theil–Sen estimator (which chooses a line whose slope is the median of the slopes determined by pairs of sample points).
Deming regression (total least squares) also finds a line that fits a set of two-dimensional sample points, but (unlike ordinary least squares, least absolute deviations, and median slope regression) it is not really an instance of simple linear regression, because it does not separate the coordinates into one dependent and one independent variable and could potentially return a vertical line as its fit. can lead to a model that attempts to fit the outliers more than the data.
Line fitting
[edit]
This section is an excerpt from Line fitting.[edit]
Line fitting is the process of constructing a straight line that has the best fit to a series of data points.
Several methods exist, considering:
Vertical distance: Simple linear regression
Resistance to outliers: Robust simple linear regression
Perpendicular distance: Orthogonal regression (this is not scale-invariant i.e. changing the measurement units leads to a different line.)
Weighted geometric distance: Deming regression
Scale invariant approach: Major axis regression This allows for measurement error in both variables, and gives an equivalent equation if the measurement units are altered.
Simple linear regression without the intercept term (single regressor)
[edit]
2 notes
·
View notes
Text
Unlock the Power of Data Analysis with STAT Data Modeling Software - LabDeck's Stat Studio
In today's data-driven world, having the right tools to analyze and interpret vast amounts of data is essential for researchers, data scientists, and analysts. LabDeck’s Stat Studio stands out as a premier STAT Data Modeling Software, designed to meet the diverse needs of professionals who work with complex datasets. This robust software offers an intuitive interface combined with powerful analytical features, enabling users to perform advanced statistical modeling with ease.
Why Choose Stat Studio for Your Data Analysis Needs?
Stat Studio is more than just another statistical software; it's an all-in-one solution that helps you unlock deeper insights from your data. Here's why it's a top choice for anyone looking to elevate their data modeling capabilities:
1. Advanced Regression Analysis
One of Stat Studio's most powerful features is its regression analysis toolset. Whether you are performing basic linear regression or more complex methods, Stat Studio gives you the flexibility to choose the right model for your data. Key statistical measures, such as Mean Squared Error (MSE) and R-squared values, are automatically calculated and displayed, providing instant insight into your model's performance. This makes it easy to interpret relationships between variables, ensuring accurate and reliable results.
2. Comprehensive Data Handling
Stat Studio excels in data handling by supporting a wide range of file formats and data sources. With its flexible import options, users can seamlessly integrate and analyze datasets from various origins. Whether your data comes from spreadsheets, databases, or other statistical software, Stat Studio ensures that you can work with it efficiently.
3. Customizable Visualizations
Data visualization is an integral part of any analysis, and Stat Studio’s advanced plotting capabilities make it simple to create professional-grade charts and graphs. Users can easily generate scatter plots, line graphs, bar charts, and more, with a full range of customizable options like marker styles, line types, and color schemes. Additionally, the software allows you to overlay regression lines and add trend lines, giving your visualizations deeper analytical value.
4. Tailored Analysis and Presentation
Customization doesn’t end with visuals. Stat Studio offers extensive options to tailor every aspect of your analysis to meet specific presentation or publication requirements. You can adjust parameters for data scaling, clean your datasets, and fine-tune the presentation of your results to suit your audience, whether you are presenting to a boardroom or preparing for publication.
Advanced Features for Complex Analyses
For users who require more than just basic analysis, Stat Studio offers an array of advanced features. A dedicated “Tests” tab hints at the software’s ability to run a wide variety of statistical tests, including hypothesis testing, ANOVA, and more. These features make Stat Studio a versatile tool for users in fields like academia, market research, healthcare, and beyond.
Additionally, the software includes tools for data cleaning and scaling, which are essential for preparing large and complex datasets for accurate analysis. These pre-processing steps ensure that your data is ready for in-depth statistical modeling, leading to more reliable and meaningful results.
Conclusion: Empower Your Data with LabDeck's Stat Studio
LabDeck’s Stat Studio offers a complete package for anyone looking to perform STAT Data Modeling software. With its combination of advanced analysis features, flexible data handling, and customizable visualization options, Stat Studio is a powerful tool for both novice and experienced statisticians alike. Whether you're conducting regression analysis, creating intricate data visualizations, or preparing your data for publication, Stat Studio provides the precision, efficiency, and versatility you need to succeed.
To learn more about how Stat Studio can revolutionize your data analysis process, visit the official page here.
Embrace the power of Stat Studio and take your data modeling to new heights!
2 notes
·
View notes
Text
Flexes on you by calculating simple linear regression using only matrices
2 notes
·
View notes