#skills data analytics
Explore tagged Tumblr posts
Visit Tumblr Blog
Explore Tumblr blogs with no restrictions, modern design and the best experience.
Last Seen Tumblr Blogs


Fun Fact
Total funding amounts to $125.3M.
Link
0 notes
Text
Understanding Outliers in Machine Learning and Data Science

In machine learning and data science, an outlier is like a misfit in a dataset. It's a data point that stands out significantly from the rest of the data. Sometimes, these outliers are errors, while other times, they reveal something truly interesting about the data. Either way, handling outliers is a crucial step in the data preprocessing stage. If left unchecked, they can skew your analysis and even mess up your machine learning models.
In this article, we will dive into:
1. What outliers are and why they matter.
2. How to detect and remove outliers using the Interquartile Range (IQR) method.
3. Using the Z-score method for outlier detection and removal.
4. How the Percentile Method and Winsorization techniques can help handle outliers.
This guide will explain each method in simple terms with Python code examples so that even beginners can follow along.
1. What Are Outliers?
An outlier is a data point that lies far outside the range of most other values in your dataset. For example, in a list of incomes, most people might earn between $30,000 and $70,000, but someone earning $5,000,000 would be an outlier.
Why Are Outliers Important?
Outliers can be problematic or insightful:
Problematic Outliers: Errors in data entry, sensor faults, or sampling issues.
Insightful Outliers: They might indicate fraud, unusual trends, or new patterns.
Types of Outliers
1. Univariate Outliers: These are extreme values in a single variable.
Example: A temperature of 300°F in a dataset about room temperatures.
2. Multivariate Outliers: These involve unusual combinations of values in multiple variables.
Example: A person with an unusually high income but a very low age.
3. Contextual Outliers: These depend on the context.
Example: A high temperature in winter might be an outlier, but not in summer.
2. Outlier Detection and Removal Using the IQR Method
The Interquartile Range (IQR) method is one of the simplest ways to detect outliers. It works by identifying the middle 50% of your data and marking anything that falls far outside this range as an outlier.
Steps:
1. Calculate the 25th percentile (Q1) and 75th percentile (Q3) of your data.
2. Compute the IQR:
{IQR} = Q3 - Q1
Q1 - 1.5 \times \text{IQR}
Q3 + 1.5 \times \text{IQR} ] 4. Anything below the lower bound or above the upper bound is an outlier.
Python Example:
import pandas as pd
# Sample dataset
data = {'Values': [12, 14, 18, 22, 25, 28, 32, 95, 100]}
df = pd.DataFrame(data)
# Calculate Q1, Q3, and IQR
Q1 = df['Values'].quantile(0.25)
Q3 = df['Values'].quantile(0.75)
IQR = Q3 - Q1
# Define the bounds
lower_bound = Q1 - 1.5 * IQR
upper_bound = Q3 + 1.5 * IQR
# Identify and remove outliers
outliers = df[(df['Values'] < lower_bound) | (df['Values'] > upper_bound)]
print("Outliers:\n", outliers)
filtered_data = df[(df['Values'] >= lower_bound) & (df['Values'] <= upper_bound)]
print("Filtered Data:\n", filtered_data)
Key Points:
The IQR method is great for univariate datasets.
It works well when the data isn’t skewed or heavily distributed.
3. Outlier Detection and Removal Using the Z-Score Method
The Z-score method measures how far a data point is from the mean, in terms of standard deviations. If a Z-score is greater than a certain threshold (commonly 3 or -3), it is considered an outlier.
Formula:
Z = \frac{(X - \mu)}{\sigma}
is the data point,
is the mean of the dataset,
is the standard deviation.
Python Example:
import numpy as np
# Sample dataset
data = {'Values': [12, 14, 18, 22, 25, 28, 32, 95, 100]}
df = pd.DataFrame(data)
# Calculate mean and standard deviation
mean = df['Values'].mean()
std_dev = df['Values'].std()
# Compute Z-scores
df['Z-Score'] = (df['Values'] - mean) / std_dev
# Identify and remove outliers
threshold = 3
outliers = df[(df['Z-Score'] > threshold) | (df['Z-Score'] < -threshold)]
print("Outliers:\n", outliers)
filtered_data = df[(df['Z-Score'] <= threshold) & (df['Z-Score'] >= -threshold)]
print("Filtered Data:\n", filtered_data)
Key Points:
The Z-score method assumes the data follows a normal distribution.
It may not work well with skewed datasets.
4. Outlier Detection Using the Percentile Method and Winsorization
Percentile Method:
In the percentile method, we define a lower percentile (e.g., 1st percentile) and an upper percentile (e.g., 99th percentile). Any value outside this range is treated as an outlier.
Winsorization:
Winsorization is a technique where outliers are not removed but replaced with the nearest acceptable value.
Python Example:
from scipy.stats.mstats import winsorize
import numpy as np
Sample data
data = [12, 14, 18, 22, 25, 28, 32, 95, 100]
Calculate percentiles
lower_percentile = np.percentile(data, 1)
upper_percentile = np.percentile(data, 99)
Identify outliers
outliers = [x for x in data if x < lower_percentile or x > upper_percentile]
print("Outliers:", outliers)
# Apply Winsorization
winsorized_data = winsorize(data, limits=[0.01, 0.01])
print("Winsorized Data:", list(winsorized_data))
Key Points:
Percentile and Winsorization methods are useful for skewed data.
Winsorization is preferred when data integrity must be preserved.
Final Thoughts
Outliers can be tricky, but understanding how to detect and handle them is a key skill in machine learning and data science. Whether you use the IQR method, Z-score, or Wins
orization, always tailor your approach to the specific dataset you’re working with.
By mastering these techniques, you’ll be able to clean your data effectively and improve the accuracy of your models.
#science#skills#programming#bigdata#books#machinelearning#artificial intelligence#python#machine learning#data centers#outliers#big data#data analysis#data analytics#data scientist#database#datascience#data
4 notes
·
View notes
Text
mid-year review went well. boss has so much confidence in my competency.
#mine#I've shown ''advanced data analytics skills'' uwu#next quarter they want me trained up so I can start supervising small projects#fantastic I have no idea what that means#one small step for lem
9 notes
·
View notes
Text
Mastering Data Analytics: Your Path to Success Starts at Corpus Digital Hub
Corpus Digital Hub is more than just a training institute—it's a hub of knowledge, innovation, and opportunity. Our mission is simple: to empower individuals with the skills and expertise needed to thrive in the fast-paced world of data analytics. Located in the vibrant city of Calicut, our institute serves as a gateway to endless possibilities and exciting career opportunities.
A Comprehensive Approach to Learning
At Corpus Digital Hub, we believe that education is the key to unlocking human potential. That's why we offer a comprehensive curriculum that covers a wide range of topics, from basic data analysis techniques to advanced machine learning algorithms. Our goal is to provide students with the tools and knowledge they need to succeed in today's competitive job market.
Building Strong Foundations
Success in data analytics begins with a strong foundation. That's why our courses are designed to provide students with a solid understanding of core concepts and principles. Whether you're new to the field or a seasoned professional, our curriculum is tailored to meet your unique needs and aspirations.
Hands-On Experience
Theory is important, but nothing beats hands-on experience. That's why we place a strong emphasis on practical learning at Corpus Digital Hub. From day one, students have the opportunity to work on real-world projects and gain valuable experience that will set them apart in the job market.
A Supportive Learning Environment
At Corpus Digital Hub, we believe that learning is a collaborative effort. That's why we foster a supportive and inclusive learning environment where students feel empowered to ask questions, share ideas, and explore new concepts. Our experienced faculty members are dedicated to helping students succeed and are always available to provide guidance and support.
Cultivating Future Leaders
Our ultimate goal at Corpus Digital Hub is to cultivate the next generation of leaders in data analytics. Through our rigorous curriculum, hands-on approach, and supportive learning environment, we provide students with the tools and confidence they need to excel in their careers and make a positive impact on the world.
Join Us on the Journey
Are you ready to take the next step towards a brighter future? Whether you're a recent graduate, a mid-career professional, or someone looking to make a career change, Corpus Digital Hub welcomes you with open arms. Join us on the journey to mastery in data analytics and unlock your full potential.
Contact Us Today
Ready to get started? Contact Corpus Digital Hub to learn more about our programs, admissions process, and scholarship opportunities. Your journey towards success starts here!
Stay connected with Corpus Digital Hub for the latest news, updates, and success stories from our vibrant community of learners and educators. Together, we'll shape the future of data analytics and make a difference in the world!

#data analytics#data science#machinelearning#Data Visualization#Business Intelligence#big data#Data Mining#Business Analytics#Data Exploration#Data Analysis Techniques#Data Analytics Certification#Data Analytics Training#Data Analyst Skills#Data Analytics Careers#Data Analytics Jobs#Data Analytics Industry
2 notes
·
View notes
Text
#business analytics#business analysis training#business analytics institute in india#power bi#business analyst certification#businessanalysis#business analyst#business analysis course#business analyst careers#business analyst skills#business analyst course#data analysis#data analytics#tableau#excel
0 notes
Text
1 note
·
View note
Text
Top Certifications That Can Land You a Job in Tech
Published by Prism HRC – Leading IT Recruitment Agency in Mumbai
Breaking into the tech industry doesn’t always require a degree. With the rise of online learning and skill-based hiring, certifications have become the new ticket into some of the highest-paying and most in-demand jobs. Whether you're switching careers or upskilling to stay ahead, the right certification can boost your credibility and fast-track your job search.
Why Certifications Matter in Tech
Tech employers today are less focused on your college background and more interested in what you can actually do. Certifications show you're committed, skilled, and up-to-date with industry trends a huge plus in a fast-moving field like IT.
Let’s explore the top certifications in 2025 that are actually helping people land real tech jobs.

1. Google IT Support Professional Certificate
Perfect for: Beginners starting in tech or IT support This beginner-friendly course, offered through Coursera, teaches you everything from troubleshooting to networking. It’s backed by Google and respected across the industry.
Tip: It’s also a great way to pivot into other IT roles, including cybersecurity and network administration.
2. AWS Certified Solutions Architect – Associate
Perfect for: Cloud engineers, DevOps aspirants With cloud computing continuing to explode in 2025, AWS skills are hotter than ever. This cert proves you know how to design secure, scalable systems on the world’s most popular cloud platform.
Real Edge: Many employers prioritize candidates with AWS experience even over degree holders.
3. Microsoft Certified: Azure Fundamentals
Perfect for: Beginners interested in Microsoft cloud tools Azure is a close second to AWS in the cloud market. If you’re looking for a job at a company that uses Microsoft services, this foundational cert gives you a leg up.
4. CompTIA Security+
Perfect for: Cybersecurity beginners If you're aiming for a job in cybersecurity, this is often the first certification employers look for. It covers basic network security, risk management, and compliance.
Why it matters: As cyber threats grow, demand for cybersecurity professionals is rising rapidly.
5. Google Data Analytics Professional Certificate
Perfect for: Aspiring data analysts This course teaches data analysis, spreadsheets, SQL, Tableau, and more. It’s beginner-friendly and widely accepted by tech companies looking for entry-level analysts.
Industry Insight: Data skills are now essential across tech, not just for analysts, but for marketers, product managers, and more.
6. Certified ScrumMaster (CSM)
Perfect for: Project managers, product managers, team leads Tech teams often use Agile frameworks like Scrum. This certification helps you break into roles where communication, leadership, and sprint planning are key.
7. Cisco Certified Network Associate (CCNA)
Perfect for: Network engineers, IT support, and infrastructure roles If you’re into hardware, routers, switches, and network troubleshooting, this foundational cert is gold.
Why it helps: Many entry-level IT jobs prefer CCNA holders over generalists.

8. Meta (Facebook) Front-End Developer Certificate
Perfect for: Front-end developers and web designers This cert teaches HTML, CSS, React, and design systems. It’s hands-on and offered via Coursera in partnership with Meta.
The bonus? You also get portfolio projects to show in interviews.
How to Choose the Right Certification
Match it to your career goal – Don't do a cert just because it’s popular. Focus on the role you want.
Check job listings – Look at what certifications are frequently mentioned.
Time vs Value – Some certs take weeks, others months. Make sure the ROI is worth it.
- Based in Gorai-2, Borivali West, Mumbai - www.prismhrc.com - Instagram: @jobssimplified - LinkedIn: Prism HRC
#Tech Certifications#IT Jobs#Top Certifications 2025#Cloud Computing#Cybersecurity#Data Analytics#AWS Certification#Microsoft Azure#CompTIA Security+#Prism HRC#IT Recruitment#Mumbai IT#Skill-Based Hiring#Future of Tech#Mumbai IT Jobs#Google IT Support#Google Data Analytics
0 notes
Text

Step Into the Future: Learn Data Analytics & Business Analytics (Free Session)
What if one class could shift your entire career path? From spreadsheets to strategic insights — data is the new power, and it's time to harness it.
On May 12th at 6:00 PM IST, join Ms. Tarakeshwari for a live online masterclass that breaks down the buzzwords and delivers real, job-ready skills in Data Analytics and Business Intelligence.
🔍 What you’ll uncover: • How raw data becomes meaningful insights • Key tools used by today’s top analysts • Ways to future-proof your career in a data-driven world
💡 No jargon. No fluff. Just actionable learning from someone who’s been there.
📌 Save your seat now → https://shorturl.at/nOS8F
0 notes
Text

having fun with Power BI, figuring out some bits of the program. i tracked details of the TRverse students' designs as i was going through the character pages, for funsies. eye and hair color are fun simple ones to compare.
hold on i'm going back up and adding a cut. i started rambling, as i am wont to do
i pulled up some articles just now on percentages of eye/hair colors in the world population to compare my stats (that's really interesting dude have you been evaluated for autism) and they're definitely not equal. brown eyes should be winning by a LOT more (70-80%), hazel then gray would come before green. black isn't one that's tracked, which is interesting to me; i guess it falls under the 'brown' category but i thought it was distinct enough to be noted. hmm. also i didn't realize there was a specific amber color, i hadn't been tracking that. might have to go in and look through the brown/hazel kids and see if amber would fit better, because i'm pedantic. also i was just using hazel to largely mean yellow/orange-tinted that don't fall close enough to brown but i think there's generally flecks of green in hazel, right? okay i'll need to re-evaluate.
for hair color, and this article doesn't have sources so take it with a grain of salt lmao, black should be winning by a lot (75-85%), then brown then blond, then red and orange combined since they're not officially distinct. maybe i should merge them and i mean unnatural dyed hair isn't tracked in this article so who knows where that falls.
WAIT WAIT HANG ON I REALIZED A FLAW IN MY ANALYSIS those are global stats! this takes place in the US, i should be looking at those stats for more accurate comparison! like i CAN compare to the global population, that's perfectly valid, i'll just get more accurate results with USian numbers. okay hang on
actually i'm having trouble finding a reliable source quickly and i don't want to put this post in my drafts. maybe another time, privately lol
ALSO A FUN THING ABOUT THESE CHARTS if you click on one of the colors, it highlights how many fall into the categories in the other chart!! like this
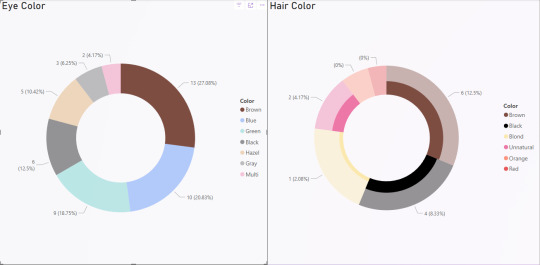
brown eyes selected, then showing how many of those 13 have what color hair. this is fascinating to me. and it's making me vibrate at the possibilities that exist in my general OC spreadsheet if i just rearrange the data a little bit.....
god i fucking love data
#reference tag#??? sure#trverse tag#i want to learn power bi mostly b/c i'm shooting for a career in data analytics and am trying to grow my skills there#and after some browsing i see a lot of relevant job listings asking for power bi experience#so seems good for me to know!#but also. so i can do analytics at home. for fun. lmao
0 notes
Text
0 notes
Text
#train the trainer#mct requirements#instructional skills#how to become a mct#mct benefits#microsoft training#microsoft certification#microsoft certified trainer#data analytics
0 notes
Text
1 note
·
View note
Text
#business analytics#business analysis training#business analytics institute in india#business analyst certification#businessanalysis#business analyst#business analysis course#business analyst careers#business analyst course#business analyst skills#power bi#sql#tableau#excel#data analytics#data analysis#courses
0 notes
Text
1 note
·
View note
Text
From Basics to Pro: Must-Know Power BI Tricks for Data Visualization

Introduction
Power BI has become one of the most powerful tools for data analytics and business intelligence. Whether you're a beginner or a data professional, mastering Power BI can help you transform raw data into meaningful insights. If you're looking to enhance your data visualization skills, here are some essential Power BI tricks to take you from basics to pro.
1. Mastering Data Connectivity
Before creating dashboards, it's crucial to understand how to connect Power BI with different data sources. Power BI supports multiple data connectors, allowing you to pull in data from Excel, SQL databases, and cloud platforms. If you're enrolled in a data analytics course in Yamuna Vihar or data analytics training in Uttam Nagar, learning these connectivity options will make data integration seamless.
2. Effective Data Modeling
Data modeling is the backbone of Power BI. Understanding relationships between tables, using DAX (Data Analysis Expressions), and creating calculated columns/measures can significantly improve your analytical capabilities. Many data analytics courses for beginners in Yamuna Vihar and best data analytics courses in Uttam Nagar cover these concepts in detail.
3. Creating Interactive Dashboards
A well-designed dashboard enhances decision-making. Here are a few tips:
Use slicers to filter data dynamically.
Leverage drill-through functionality for deeper analysis.
Utilize bookmarks for storytelling. If you're looking for a data analytics course online in Yamuna Vihar, ensure it includes practical projects on dashboard creation.
4. Advanced DAX Functions for Data Analysis
DAX functions are crucial for performing calculations. Some must-know DAX functions include:
SUMX and AVERAGEX for aggregation
CALCULATE to modify context
FILTER for custom filtering If you're pursuing data science and analytics in Yamuna Vihar, learning DAX can give you a competitive edge in data-driven decision-making.
5. Optimizing Performance with Data Reduction
Handling large datasets efficiently is key. Here’s how to optimize performance:
Remove unnecessary columns.
Use summarized tables instead of raw data.
Optimize DAX queries to minimize processing time. If you're enrolled in a data science certificate program in Yamuna Vihar, this skill will help in handling big data effectively.
6. Power BI AI Features for Smart Insights
Power BI incorporates AI-powered features such as:
Q&A Visual: Allows users to ask questions in natural language.
Decomposition Tree: Helps in analyzing hierarchical data.
Key Influencers: Identifies key drivers impacting KPIs. If you're interested in data science and machine learning in Yamuna Vihar, these AI tools can enhance your analytical capabilities.
7. Real-Time Data Analysis with Power BI Service
With Power BI Service, you can:
Share dashboards with teams.
Schedule automatic data refreshes.
Embed Power BI reports in web applications. Many data analytics coaching centers in Uttam Nagar offer hands-on training in Power BI Service, making collaboration easier.
8. Automating Reports with Power Automate
Power BI integrates with Power Automate to automate workflows. You can:
Trigger email alerts based on data changes.
Automatically update datasets.
Connect with other Microsoft services like Teams and SharePoint. A data science training institute in Yamuna Vihar will guide you on how to use automation for efficiency.
9. Best Practices for Power BI Visualization
To create impactful visualizations:
Use contrasting colors for clarity.
Choose appropriate chart types.
Keep dashboards simple and intuitive. If you're part of a data analytics training institute in Uttam Nagar, applying these best practices will make your reports stand out.
10. Power BI Certification for Career Growth
Getting a Power BI certification can boost your career prospects. Many best data science certifications in Yamuna Vihar and data science courses with placement in Uttam Nagar offer industry-recognized training to help you ace Power BI exams.
Conclusion
Power BI is a game-changer for data professionals. Whether you’re a beginner or an advanced user, implementing these tricks will enhance your analytical skills. If you're looking to upskill, enrolling in a data analytics institute in Yamuna Vihar or a data analytics course in Uttam Nagar can provide hands-on learning to master Power BI efficiently. Happy analyzing. Visit Us
Suggested Links
Big Data With Hadoop
MIS Reporting
Advanced MS – Excel
#ms excel#advanced excel#mis#data visualization#data analytics#data science#e learning#skills development
0 notes